RUSSELL Overbought for the 3rd time in 7 months. Sell.Last time we had a look at Russell 2000 (RUT) was 2 months ago (November 28 2025, see chart below) where we gave a strong Buy Signal that quickly hit our 2600 Target:
This time, with the price approaching the top (Higher Highs trend-line) of its 10-month Channel Up, the technical sentiment turns bearish again. The maximum a Bullish Leg rose by within this pattern was +21.74% (its 1st) and since the 1D RSI got overbought for the 3rd time in 7 months (the previous two were Higher High tops), we expect the index to start a new Bearish Leg soon.
The last two Bearish Legs pulled back and hit at least their 0.5 Fibonacci levels. Even from a potential +21.50% max, that gives us a 2550 Target for the short-term, which won't only be a Higher Low bottom for the Channel Up, but will also test the 1D MA100 (green trend-line).
---
** Please LIKE 👍, FOLLOW ✅, SHARE 🙌 and COMMENT ✍ if you enjoy this idea! Also share your ideas and charts in the comments section below! This is best way to keep it relevant, support us, keep the content here free and allow the idea to reach as many people as possible. **
---
💸💸💸💸💸💸
👇 👇 👇 👇 👇 👇
What traders are saying

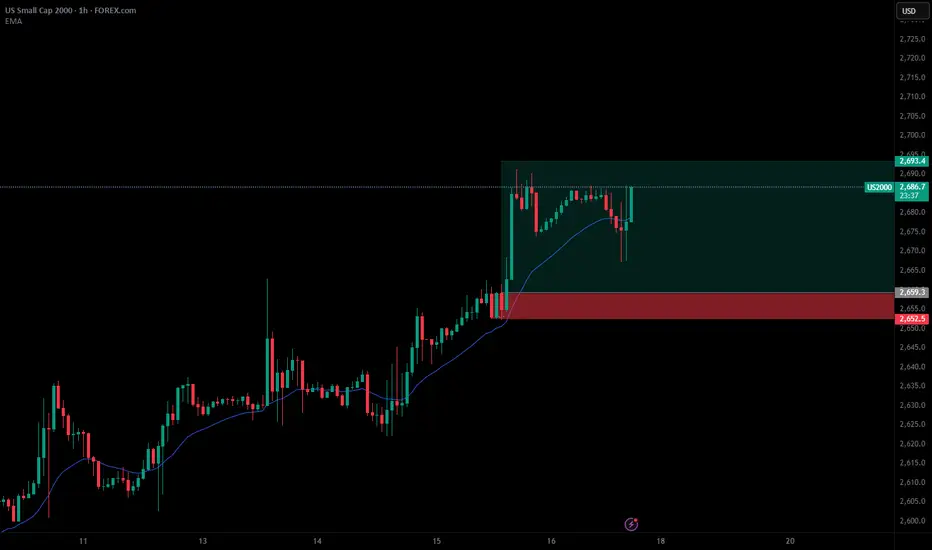
US2000 H4 | Bullish Momentum To Extend?Based on the H4 chart analysis, we could see the fall to our buy entry level at 2,601.61, which is a pullback support that is slightly above the 50% Fibonacci retracemnt.
Our stop loss is set at 2,554.64, which is a pullback support that aligns with the 61.8% Fibonacci retracement.
Our take profit is set at 2,687.99, which is a swing high resistance.
High Risk Investment Warning
Stratos Markets Limited (fxcm.com/uk), Stratos Europe Ltd (fxcm.com/eu):
CFDs are complex instruments and come with a high risk of losing money rapidly due to leverage. 69% of retail investor accounts lose money when trading CFDs with this provider. You should consider whether you understand how CFDs work and whether you can afford to take the high risk of losing your money.
Stratos Global LLC (fxcm.com/en): Losses can exceed deposits.
Please be advised that the information presented on TradingView is provided to FXCM (‘Company’, ‘we’) by a third-party provider (‘TFA Global Pte Ltd’). Please be reminded that you are solely responsible for the trading decisions on your account. Any information and/or content is intended entirely for research, educational and informational purposes only and does not constitute investment or consultation advice or investment strategy. The information is not tailored to the investment needs of any specific person and therefore does not involve a consideration of any of the investment objectives, financial situation or needs of any viewer that may receive it. Past performance is not a reliable indicator of future results. Actual results may differ materially from those anticipated in forward-looking or past performance statements. We assume no liability as to the accuracy or completeness of any of the information and/or content provided herein and the Company cannot be held responsible for any omission, mistake nor for any loss or damage including without limitation to any loss of profit which may arise from reliance on any information supplied by TFA Global Pte Ltd.
Stratos Trading Pty. Limited (fxcm.com/au):
Trading FX/CFDs carries significant risks. FXCM AU (AFSL 309763), please read the Financial Services Guide, Product Disclosure Statement, Target Market Determination and Terms of Business at fxcm.com/au


SHORT 2000Probable corrective move towards a key liquidity zone on the 15-minute timeframe.
Analysis based on market structure and short-term liquidity levels.
Invalidations: above the recent 15M swing highs.
Target: identified liquidity zone.
⚠️ Informational analysis only – not financial advice.

US2000 H1 | Bullish Bounce OffThe price has bounced off our buy entry level at 2,641.87, which is a pullback support.
Our stop loss is set at 2,600.84, which is a pullback support that aligns with the 78.6% Fibonacci retracement.
Our take profit is set at 2,708.35, which is a pullback resistance.
High Risk Investment Warning
Stratos Markets Limited fxcm.com Stratos Europe Ltd fxcm.com
CFDs are complex instruments and come with a high risk of losing money rapidly due to leverage. 69% of retail investor accounts lose money when trading CFDs with this provider. You should consider whether you understand how CFDs work and whether you can afford to take the high risk of losing your money.
Stratos Global LLC fxcm.com Losses can exceed deposits.
Please be advised that the information presented on TradingView is provided to FXCM (‘Company’, ‘we’) by a third-party provider (‘TFA Global Pte Ltd’). Please be reminded that you are solely responsible for the trading decisions on your account. Any information and/or content is intended entirely for research, educational and informational purposes only and does not constitute investment or consultation advice or investment strategy. The information is not tailored to the investment needs of any specific person and therefore does not involve a consideration of any of the investment objectives, financial situation or needs of any viewer that may receive it. Past performance is not a reliable indicator of future results. Actual results may differ materially from those anticipated in forward-looking or past performance statements. We assume no liability as to the accuracy or completeness of any of the information and/or content provided herein and the Company cannot be held responsible for any omission, mistake nor for any loss or damage including without limitation to any loss of profit which may arise from reliance on any information supplied by TFA Global Pte Ltd.
Stratos Trading Pty. Limited fxcm.com
Trading FX/CFDs carries significant risks. FXCM AU (AFSL 309763), please read the Financial Services Guide, Product Disclosure Statement, Target Market Determination and Terms of Business at fxcm.com

US2000 H1 | Bearish Reversal SetupBased on the H1 chart analysis, we could see the price rise towards our sell entry level at 2,692.02, which is a pullback resistance that aligns with the 50% Fibonacci retracement.
Our stop loss is set at 2,738.46, which is a swing high resistance.
Our take profit is set at 2,626.00, which is a multi swing low support.
High Risk Investment Warning
Stratos Markets Limited fxcm.com Stratos Europe Ltd fxcm.com
CFDs are complex instruments and come with a high risk of losing money rapidly due to leverage. 69% of retail investor accounts lose money when trading CFDs with this provider. You should consider whether you understand how CFDs work and whether you can afford to take the high risk of losing your money.
Stratos Global LLC fxcm.com Losses can exceed deposits.
Please be advised that the information presented on TradingView is provided to FXCM (‘Company’, ‘we’) by a third-party provider (‘TFA Global Pte Ltd’). Please be reminded that you are solely responsible for the trading decisions on your account. Any information and/or content is intended entirely for research, educational and informational purposes only and does not constitute investment or consultation advice or investment strategy. The information is not tailored to the investment needs of any specific person and therefore does not involve a consideration of any of the investment objectives, financial situation or needs of any viewer that may receive it. Past performance is not a reliable indicator of future results. Actual results may differ materially from those anticipated in forward-looking or past performance statements. We assume no liability as to the accuracy or completeness of any of the information and/or content provided herein and the Company cannot be held responsible for any omission, mistake nor for any loss or damage including without limitation to any loss of profit which may arise from reliance on any information supplied by TFA Global Pte Ltd.
Stratos Trading Pty. Limited fxcm.com
Trading FX/CFDs carries significant risks. FXCM AU (AFSL 309763), please read the Financial Services Guide, Product Disclosure Statement, Target Market Determination and Terms of Business at fxcm.com

US2000 (Russell) eyes on $2690: Golden Genesis fib may give DIP Small caps have been flying strong for some time now.
US2000 index just hit a Golden Genesis fib at $2690.66
Look for a Break-n-Retest or Dip-to-Fib to join trend.
.
See "Related Publications" for other examples of Golden fibs at work ----->>>>>>>>>>>
.

RUSSELL 2000 — Follow-up on prior liquidity-based scenario (15M)This post provides a follow-up observation on a previously published liquidity-based scenario.
Price has since interacted with the identified liquidity zone, with market behavior aligning with the initial structural framework.
This follow-up is shared for documentation purposes only and does not constitute a new scenario or a trade recommendation.
No changes are made to the original analysis or its invalidation criteria.
⚠️ Informational market analysis only — not financial advice.

Russell 2K: Don't Let the Fake Move Cheat You Out of a 20% RallyRussell 2000: Don't Let the Fake Move Cheat You Out of a 20% Rally
For the past few years, the IG:RUSSELL has been a master of frustration . If you feel like this index has been moving sideways forever, you are right. However, there is a very specific pattern repeating itself that most retail traders are missing.
The market is not just moving randomly, it is hunting for liquidity before making its big moves.
The Anatomy of the Fake Out
Looking at the chart, we can see that the Russell has been moving between clear zones since 2021. But here is the trick, every time the price prepares to leave a zone and start a major trend, it performs a Fake Movement.
When the price breaks a level or approaches a support/resistance, then quickly reverses . This is a TRAP .
This move is designed to hit the Stop Losses of early traders.
Once those stops are hit, the market has the fuel it needs to launch a True 20% rally in just a few weeks.
We saw this happen in early 2022 and again throughout 2024. Each time the Fake Movement ended, a massive, fast vertical move followed.
Where We Stand Now
What we are seeing here is the start of the next big phase . The index has finally broken above the massive resistance zone around $2,400.
Just as expected, we recently saw a dip, a Fake Movement, where the price touched the breakout zone again. This scared many buyers out of their positions. But look at the green arrow, the path is now clear for a 3,000 target.
💡 The Trading Plan: Riding the 20% Wave
This setup offers a magnificent risk-to-reward ratio because we are entering new territory for the index.
Any small pullback to the breakout line is a gift for buyers or the break of any consolidation zone in this new territory.
To keep the risk tight, a close back inside the old range (below 2,350) could invalidate this idea.
The market is giving us a clear signal. We are no longer in a boring range, we are in a breakout phase fueled by the weak hands that were just stopped out.
👇 WANT MORE?
🚀 Hit the rocket, read my profile and follow so we can find each other again :)

Russell 2000 Bullish Bias | Accumulation Before Expansion🎯 US2000 (Russell 2000) Index CFD | Bullish Swing Trade Setup 📈
🔥 MARKET OPPORTUNITY: Small-Cap Breakout Play 🔥
📊 TRADE PLAN OVERVIEW
Strategy: Bullish Accumulation → Resistance Breakout → Re-accumulation Zone
Timeframe: Swing Trade (Multi-day to weeks)
Technical Confirmation: Simple Moving Average (SMA) pullback creating accumulation zone + Overbought resistance breakout signaling continuation momentum
💰 ENTRY STRATEGY: "THIEF LAYERING METHOD" 💰
⚡ Multi-Limit Order Layering Strategy (DCA Style) ⚡
Instead of a single entry, we're using multiple buy limit orders to build our position strategically:
🎯 Layer 1: 2560
🎯 Layer 2: 2580
🎯 Layer 3: 2600
💡 Pro Tip: You can add MORE layers based on your capital and risk appetite! This "ladder entry" approach averages your cost and reduces timing risk during volatile accumulation phases.
🚨 OR: Market Entry Available - Jump in at ANY current price level if you prefer aggressive entry over layering!
🛡️ RISK MANAGEMENT
Stop Loss (Thief's SL): 2530 ⛔
⚠️ IMPORTANT DISCLAIMER:
Dear Ladies & Gentlemen (Thief OG's) 👋 - This is MY stop loss level based on technical invalidation. You are NOT required to follow my exact SL! Adjust according to YOUR risk tolerance, account size, and trading psychology. Trade at your own risk. Your money, your rules! 💪
🎯 PROFIT TARGETS
Target Zone (TP): 2660 🚀
🚔 "Police Force" Resistance Alert:
This level acts as strong resistance + overbought zone + potential bull trap area + correlation pressure point. Smart money takes profits here! Don't be greedy - ESCAPE WITH PROFITS when we hit this zone! 💵
⚠️ IMPORTANT DISCLAIMER:
Dear Ladies & Gentlemen (Thief OG's) 👋 - This is MY take profit target. You are NOT required to follow my exact TP! Scale out partially, move SL to breakeven, or hold for extended targets - it's YOUR choice. Your money, your decision! 🎲
🔗 CORRELATED ASSETS TO WATCH 📡
Monitor these pairs for confluence and risk-on/risk-off sentiment:
💵 TVC:DXY (US Dollar Index) - Inverse correlation; weak dollar = strong equities
📈 SP:SPX (S&P 500) - Broad market sentiment gauge
📊 NASDAQ:NDX (Nasdaq 100) - Tech-heavy index correlation
🏦 AMEX:IWM (iShares Russell 2000 ETF) - Direct ETF tracking Russell 2000
⚡ TVC:VIX (Volatility Index) - Fear gauge; rising VIX = caution for longs
🛢️ BLACKBULL:WTI (Crude Oil) - Risk-on asset correlation
💰 FX:USDJPY - Risk sentiment barometer; weakness supports equities
🏦 AMEX:XLF (Financial Sector ETF) - Russell 2000 has heavy financial exposure
📰 FUNDAMENTAL & ECONOMIC FACTORS 🌍
✅ Bullish Catalysts to Consider:
1️⃣ Federal Reserve Policy Easing 🏦
If Fed maintains dovish stance or signals rate cuts, small-caps (Russell 2000) typically outperform as they're more sensitive to borrowing costs
2️⃣ Economic Soft Landing Narrative 📉➡️📈
If inflation cools without recession, domestic-focused small-caps benefit heavily
3️⃣ Dollar Weakness 💵⬇️
Falling DXY supports risk assets; Russell 2000 tends to rally when USD weakens
4️⃣ Earnings Season Performance 📊
Monitor upcoming small-cap earnings reports; positive surprises fuel momentum
5️⃣ Banking Sector Stability 🏦✅
Russell 2000 has significant financial exposure; stable/rising financials = bullish for index
⚠️ Bearish Risks to Monitor:
1️⃣ Recession Fears 📉😰
Small-caps underperform during economic contraction; watch GDP, unemployment data
2️⃣ Fed Hawkish Surprise 🦅📈
Higher-for-longer rates hurt small-caps disproportionately (debt-heavy balance sheets)
3️⃣ Credit Market Stress 💳⚠️
Rising corporate bond yields or credit spreads = danger for leveraged small-caps
4️⃣ Geopolitical Tensions 🌍💥
Trade wars, conflicts = risk-off sentiment = exodus from small-caps
5️⃣ Strong Dollar Rally 💵🚀
DXY strength typically pressures equities, especially domestic-focused Russell 2000
📅 UPCOMING KEY EVENTS TO WATCH 🗓️
🔔 Fed Meeting Minutes/Speeches - Any policy shift hints
🔔 CPI/PPI Inflation Data - Inflation trajectory crucial for rate policy
🔔 Non-Farm Payrolls (NFP) - Employment strength = economic health gauge
🔔 Small-Cap Earnings Reports - Watch Russell 2000 component earnings
🔔 ISM Manufacturing/Services PMI - Economic activity indicators
🔔 Regional Banking Sector Updates - Financial stability matters for IWM
🎓 KEY TECHNICAL POINTS 🔍
✅ SMA Pullback = Healthy Accumulation - Price retracing to moving average shows institutional buying interest
✅ Overbought Breakout - Previous resistance becomes new support after successful break
✅ Re-accumulation Phase - Consolidation above breakout = continuation pattern
✅ Volume Confirmation - Watch for increasing volume on bullish moves (not shown but critical!)
✅ Risk-Reward Favorable - Layered entry provides cushion; defined exit at 2660
🚨 FINAL THIEF OG WISDOM 🚨
💎 "The market doesn't care about your entry price - it only cares about supply and demand."
📌 Risk Management > Being Right
📌 Patience > Precision
📌 Profits > Predictions
Not financial advice. Trade responsibly. Always use stop losses. Never risk more than you can afford to lose! 🛡️
🔥 LIKE + FOLLOW for more Thief OG setups! 🔥
💬 Drop your thoughts below - Are YOU bullish on small-caps? 💬

SHORT RUSSELLProbable corrective move towards a key liquidity zone on the 15-minute timeframe.
Analysis based on market structure and short-term liquidity levels.
Invalidations: above the recent 15M swing highs.
Target: identified liquidity zone.
⚠️ Informational analysis only – not financial advice.

Russell's Rising Wedge: A Trap for Bulls Setting Up a FallTo forecast the overall trajectory of the Russell Index in the new year,
we analyze the prevailing technical structure. The daily chart displays a textbook **Rising Wedge** pattern, a bearish continuation structure that has compressed price action into a converging range following a prior decline.
The pattern is now approaching its critical lower trendline support as it nears the apex, significantly increasing the probability of a decisive breakdown in the new trading year.
A confirmed daily close below this support level, especially on elevated volume, would activate the pattern's measured move projection and signal a resumption of the prior downtrend.
The initial decline would target TP1, calculated by projecting the wedge's maximum height downward from the point of breakdown.A sustained bearish impulse could then extend the move toward TP2.
Therefore, the technical setup presently favors a bearish resolution for the Russell Index, contingent upon a confirmed wedge breakdown.

US2000 H4 | Bullish bounce offBased on the H4 chart analysis, we could see the price fall to our buy entry level at 2,538.01, which is a pullback support that aligns with the 50% FIbonacci retracement.
Our stop loss is set at 2,504.43, which is a pullback support that aligns with the 78.6% Fibonacci retracement.
Our take profit is set at 2,589.09, which is a pullback resistance.
High Risk Investment Warning
Stratos Markets Limited (

Where are we going Russell?I’ve been watching the Russell 2000 (small-cap index) and something feels different this time.
It’s pushing into new highs and the setup suggests we might be on the verge of a real breakout. I’m talking about +20% upside in the coming weeks or months , and not as a distant dream, but as a plausible scenario.
For years the market has toyed with the “ Magnificent 7 ” and passive funds dumping money into the same handful of stocks .
Small-caps were left behind.
But when so many assets are crowded into a few names, it only takes one meaningful shift for the tide to turn. I’m seeing early signs that investors might finally rotate out of mega-caps and into the under-owned smaller stocks. If that happens, the Russell could catch a strong tail-wind and lower Interest rates are also important for Small caps.
On the flip side, I’m keeping one ear open for red flags. If the breakout fails, say, due to a macro twist (rates stay high, growth slows) or passive flows reverse back into large caps, then this move could turn into a bul trap . The chart is showing potential, yes, but momentum can evaporate just as fast if volume doesn’t follow or support this breakout.
So here’s how I’m playing it: I¡ve bought the Russell above that resistance zone, expecting a +15 to 20% move. If instead we see a heavy rejection and roll-over, I’ll be ready to step aside and change my mind. Small-caps are exciting territory, but also unforgiving if the thesis collapses.
This could be the moment when smaller stocks shine again. Or it could be the moment the market reminds us how tricky false breakouts are.
What is your vision in IG:RUSSELL ?


US2000 H4 | Falling Towards Key SupportThe price is falling towards our buy entry level at 2,479.37, which is an overlap support that aligns with the 38.2% Fibonacci retracement.
Our Stop loss is set at 2,449.15, which aligns with the 50% Fibonacci retracement.
Our take profit is set at 2,538.48, which is a pullback resistance.
High Risk Investment Warning
Stratos Markets Limited (

When Structure Repeats | A Clean Market Behavior StudyMarket Structure & Pattern Observation
This chart presents a clear example of how market structure and classical chart patterns have unfolded over time, based strictly on historical price behavior.
Since early December, price has formed a sequence of well-defined structural phases :
• A horizontal channel developed, followed by a clean upside resolution
• A Head & Shoulders structure later formed and resolved to the downside
• An Inverse Head & Shoulders appeared afterward, with price respecting the upward structural break
• Currently, price is developing within a descending channel , approaching another potential structural transition
What makes this chart particularly interesting is that previous structural breaks were respected by price action , without immediate failure or false breakouts. Each structure completed its formation and was followed by directional continuation aligned with the pattern context.
This creates an opportunity to observe how consistency in market structure has played out historically , while remaining aware that market behavior can change at any time.
Rather than focusing on prediction, this analysis highlights:
• How structure forms
• How price reacted in previous phases
• How context can be evaluated without assumptions
This post is shared for educational and analytical purposes only.
It does not constitute financial advice or a trading recommendation.
No outcomes are guaranteed. All decisions remain the sole responsibility of the reader.

RTY breakout Crypto Bull run coming soonEvery time rty has broken in Htf the crypto Bull phase has started.
This is just starting.
Euphoria phase is still coming.

US2000 H4 | Falling Towards Pullback SupportMomentum: Bullish
The price is falling towards the buy entry, which aligns with the 38.2% Fibonacci retracement and also trading above the Ichimoku cloud, a good sign of bullish momentum.
Buy entry: 2,538.22
Pullback support
38.2% Fibonacci retracement
Stop loss: 2,499.78
Overlap support
Take profit: 2,600.83
Swing high resistance
High Risk Investment Warning
Stratos Markets Limited (tradu.com ), Stratos Europe Ltd (tradu.com ):
CFDs are complex instruments and come with a high risk of losing money rapidly due to leverage. 70% of retail investor accounts lose money when trading CFDs with this provider. You should consider whether you understand how CFDs work and whether you can afford to take the high risk of losing your money.
Stratos Global LLC (tradu.com ): Losses can exceed deposits.
Please be advised that the information presented on TradingView is provided to Tradu (‘Company’, ‘we’) by a third-party provider (‘TFA Global Pte Ltd’). Please be reminded that you are solely responsible for the trading decisions on your account. Any information and/or content is intended entirely for research, educational and informational purposes only and does not constitute investment or consultation advice or investment strategy. The information is not tailored to the investment needs of any specific person and therefore does not involve a consideration of any of the investment objectives, financial situation or needs of any viewer that may receive it. Past performance is not a reliable indicator of future results. Actual results may differ materially from those anticipated in forward-looking or past performance statements. We assume no liability as to the accuracy or completeness of any of the information and/or content provided herein and the Company cannot be held responsible for any omission, mistake nor for any loss or damage including without limitation to any loss of profit which may arise from reliance on any information supplied by TFA Global Pte Ltd.


US2000 ATH idea Q1-early Q2 2026I applied the fractal from the last cycle when FX:US2000 put the peak, look how it repeats the structure with a false breakdown exactly like in 21 and what synchronization on the corrections in the current cycle.
if we look at the fractal, we can assume that ath will be put in the range of 3000-3400.

Monetary Liquidity: the Russell 2000 on the Front LineThe Russell 2000 is a U.S. stock market index that includes approximately 2,000 small-cap companies listed in the United States. Unlike the S&P 500 or the Nasdaq, which are largely dominated by large multinational corporations with significant international exposure, the Russell 2000 primarily reflects the domestic U.S. economic dynamics of small and mid-sized companies. The firms that make up the index are generally younger, more leveraged, and more dependent on financing conditions than large-cap companies. They derive most of their revenues from the domestic market and are therefore particularly sensitive to changes in U.S. growth, consumer demand, and the cost of credit. For this reason, the Russell 2000 is often regarded as a leading barometer of the U.S. economic cycle and of risk appetite in financial markets.
This index is also one of the most sensitive to monetary liquidity conditions, both current and anticipated. Periods of declining policy rates and accommodative monetary policies—particularly quantitative easing (QE) programs—have historically been favorable for it. When the Federal Reserve eases policy, the cost of capital declines, refinancing conditions improve, and access to credit becomes more fluid for small and mid-sized businesses. In this context, the Fed’s recent decision to lower the federal funds rate to 3.75%, combined with the announcement of a so-called “technical” QE, represents a strong signal for assets that are most dependent on liquidity. By its very structure, the Russell 2000 acts as an amplifier of these monetary regime shifts: when liquidity returns or when markets begin to anticipate it, the index tends to outperform large-cap benchmarks.
From a technical perspective, a bullish continuation signal has just been triggered on the weekly time frame. The index has broken above its former all-time high, set at the end of 2021, a level that had acted as a major resistance for more than four years. This breakout fits within a clearly identifiable long-term uptrend structure, characterized by a succession of higher lows and higher highs. Clearing this key zone confirms an upside exit from a broad consolidation phase and turns the former high into a potential new support level. From a chartist standpoint, such a breakout above a historical high is a classic trend-continuation signal, made even more relevant by a monetary environment that has become more accommodative again. As long as the index holds above this threshold, the underlying trend remains bullish, with further upside potential supported by both technical factors and global liquidity. Caution is still warranted, however, as corrective phases can always occur in the short term.
DISCLAIMER:
This content is intended for individuals who are familiar with financial markets and instruments and is for information purposes only. The presented idea (including market commentary, market data and observations) is not a work product of any research department of Swissquote or its affiliates. This material is intended to highlight market action and does not constitute investment, legal or tax advice. If you are a retail investor or lack experience in trading complex financial products, it is advisable to seek professional advice from licensed advisor before making any financial decisions.
This content is not intended to manipulate the market or encourage any specific financial behavior.
Swissquote makes no representation or warranty as to the quality, completeness, accuracy, comprehensiveness or non-infringement of such content. The views expressed are those of the consultant and are provided for educational purposes only. Any information provided relating to a product or market should not be construed as recommending an investment strategy or transaction. Past performance is not a guarantee of future results.
Swissquote and its employees and representatives shall in no event be held liable for any damages or losses arising directly or indirectly from decisions made on the basis of this content.
The use of any third-party brands or trademarks is for information only and does not imply endorsement by Swissquote, or that the trademark owner has authorised Swissquote to promote its products or services.
Swissquote is the marketing brand for the activities of Swissquote Bank Ltd (Switzerland) regulated by FINMA, Swissquote Capital Markets Limited regulated by CySEC (Cyprus), Swissquote Bank Europe SA (Luxembourg) regulated by the CSSF, Swissquote Ltd (UK) regulated by the FCA, Swissquote Financial Services (Malta) Ltd regulated by the Malta Financial Services Authority, Swissquote MEA Ltd. (UAE) regulated by the Dubai Financial Services Authority, Swissquote Pte Ltd (Singapore) regulated by the Monetary Authority of Singapore, Swissquote Asia Limited (Hong Kong) licensed by the Hong Kong Securities and Futures Commission (SFC) and Swissquote South Africa (Pty) Ltd supervised by the FSCA.
Products and services of Swissquote are only intended for those permitted to receive them under local law.
All investments carry a degree of risk. The risk of loss in trading or holding financial instruments can be substantial. The value of financial instruments, including but not limited to stocks, bonds, cryptocurrencies, and other assets, can fluctuate both upwards and downwards. There is a significant risk of financial loss when buying, selling, holding, staking, or investing in these instruments. SQBE makes no recommendations regarding any specific investment, transaction, or the use of any particular investment strategy.
CFDs are complex instruments and come with a high risk of losing money rapidly due to leverage. The vast majority of retail client accounts suffer capital losses when trading in CFDs. You should consider whether you understand how CFDs work and whether you can afford to take the high risk of losing your money.
Digital Assets are unregulated in most countries and consumer protection rules may not apply. As highly volatile speculative investments, Digital Assets are not suitable for investors without a high-risk tolerance. Make sure you understand each Digital Asset before you trade.
Cryptocurrencies are not considered legal tender in some jurisdictions and are subject to regulatory uncertainties.
The use of Internet-based systems can involve high risks, including, but not limited to, fraud, cyber-attacks, network and communication failures, as well as identity theft and phishing attacks related to crypto-assets.
