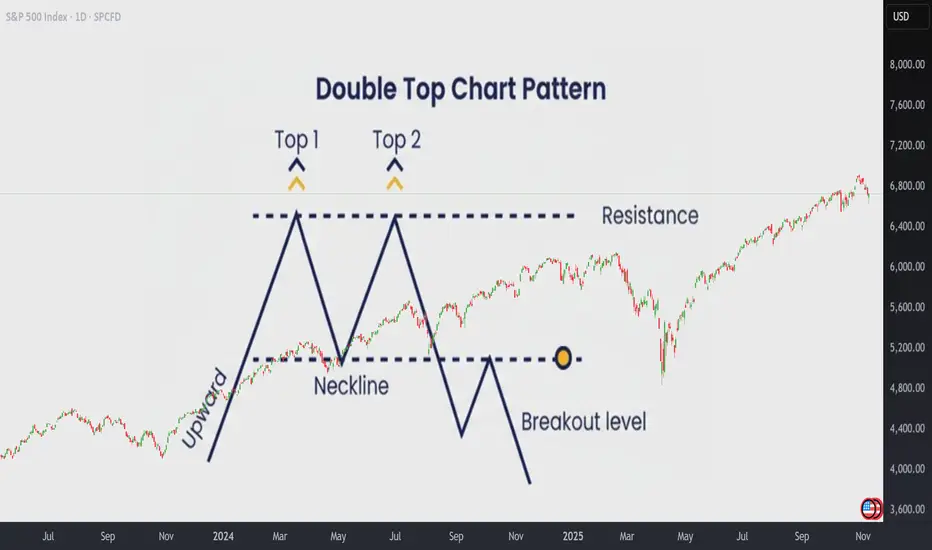
How to Trade the Double Top Pattern Like a ProHow to Trade the Double Top Pattern Like a Pro
The Double Top is one of the most reliable patterns in technical analysis. It often marks the beginning of a resistance zone and signals that bullish momentum is losing strength.
The first top is hard to anticipate, it’s usually just a continuati
Related indices
SPX – Recovery Momentum Gradually ReturningThe U.S. stock market is regaining its upward rhythm after a period of correction, as investor sentiment improves notably on hopes that the U.S. government shutdown will soon end .
At the same time, the U.S. Dollar Index has stalled and bond yields have slightly declined , creating favorable condi

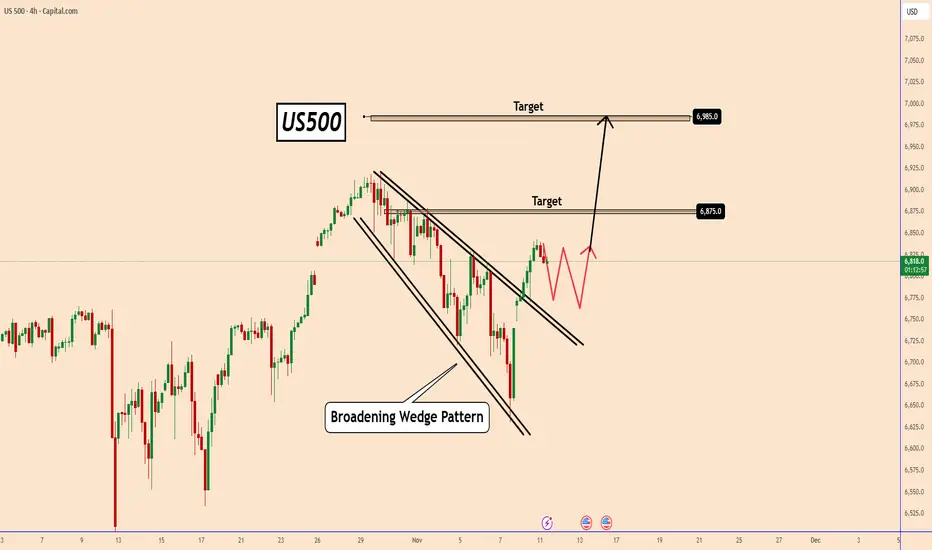
US500: Breaking Out of the Falling ChannelUS500: Breaking Out of the Falling Channel
The US500 index has finally broken out from its falling channel, signaling a potential continuation of the broader bullish trend.
After a strong recovery from recent lows, price action suggests a possible pullback to retest the breakout zone before targe
Hellena | SPX500 (4H): LONG to max of wave "3" area of 6929.4.Good afternoon colleagues, it looks like the correction is ending and soon I expect wave “5” in the upward movement. Perhaps wave “4” will update the low of 6637.8 before the upward movement.
I expect to reach the maximum of wave “3” at 6929.4. Further we will observe the price behavior in this are

US 500 - Has All the Good News Been Priced?After a volatile and nervy 5 days for US stock indices the week ended on a slightly more stable and positive footing.
In relation to the US 500 index this volatility saw it open on Monday November 3rd around 6885, trade down to a low of 6633 early on Friday November 7th, before rallying by over

SPX Digests the Highs SPX spent the last week and a half digesting the new all-time high, pulling back deeper than I expected but holding the weekly trend. Price found support at 6,632 and closed back inside the yellow zone where we’ve seen noise before.
This week I’m watching for one of these scenarios: a sideways res

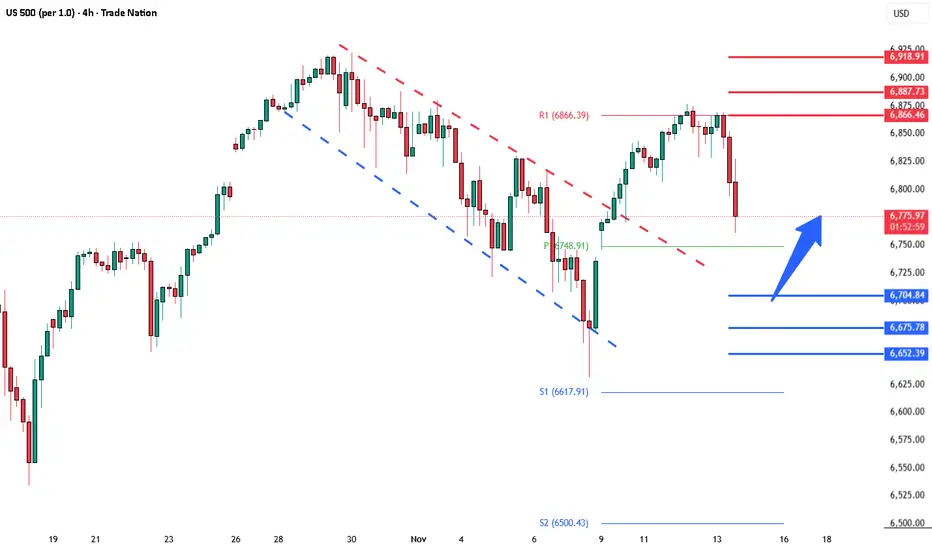
S&P Key Trading LevelsKey Support and Resistance Levels
Resistance Level 1: 6866
Resistance Level 2: 6890
Resistance Level 3: 6920
Support Level 1: 6704
Support Level 2: 6675
Support Level 3: 6650
This communication is for informational purposes only and should not be viewed as any form of recommendation as to a p
SPX about to come crashing down hard. Buckle up.The parabolic growth curve that started almost 30 years ago in the US stock market is about to come to a dramatic conclusion.
We saw a test example of what happened in April when the market for the first time in 27 years broke through the parabolic growth curve, how quickly things just fell apart

Important Breakout - US500Hello traders,
The US500 failed to create a new lower low, and the price broke the lower high — confirming a change of character (ChoCH)!
So, I expect a bullish move ahead 🚀
🎯 Target: 6890.0

S&P 500 – Topping Signs Emerging Amid Momentum DivergenceThe S&P 500 appears to have formed a potential top, with initial downside targets near 5,700. In a more pronounced bearish scenario, price could extend toward 4,900—representing roughly a 27% correction from the highs. The index has rejected from the upper boundary of its ascending channel, while bo

See all ideas
Displays a symbol's price movements over previous years to identify recurring trends.
Frequently Asked Questions
US 500 reached its highest quote on Oct 30, 2025 — 6,921.7 USD. See more data on the US 500 chart.
The lowest ever quote of US 500 is 666.8 USD. It was reached on Mar 6, 2009. See more data on the US 500 chart.
US 500 is just a number that lets you track performance of the instruments comprising the index, so you can't invest in it directly. But you can buy US 500 futures or funds or invest in its components.