Revision to Prior Idea. Range Bound SellsI want to scratch my prior idea as the market is showing me it is in a distribution phase in this range.
I am confident that the all time high will hold until price pulls back down to the prior low of 43,400 and then take out the all time high.
Does this look familiar?
The exhaustion bar wi
Related futures
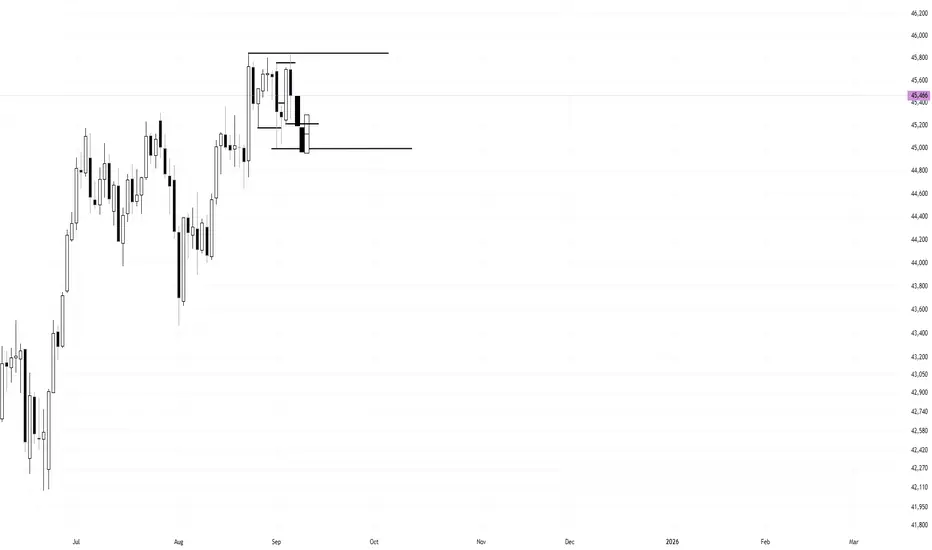
Market In Range. Low of Week Buying Using the Daily timeframe signals, price is in a range. Nothing is setup yet. I will wait for Monday to close down. I want to see a bearish closing day down near the lows for the Low of Week reversal.
This is what I am waiting for and will have to see IF price will setup this way.
1. Cree
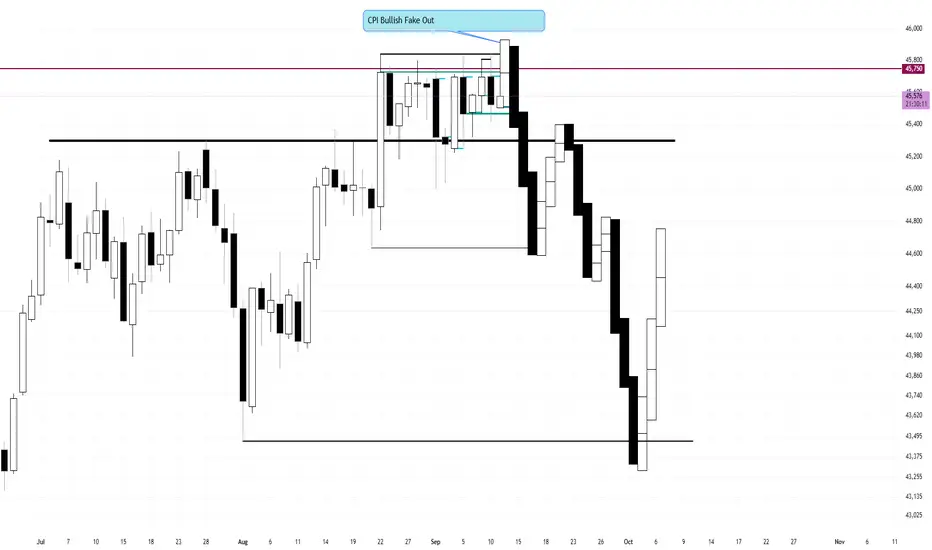
CPI Bullish Fake out (Bearish Range- False Break Reversal)
I am anticipating a Bullish close on Thursday to close above these highs for a 1% rally. Then Friday to wipe the board to start the move back down to the other side of the range for the true support Long.
I will continue to look for Sells until support. This is a Bearish range at the top.

YM 9/4 1hrMonthly timeframe Pink
Weekly = Grey
Daily = Red
4hr = Orange
1hr = Yellow
15min = Blue
5min = Green
4 candles, 6 Levels, & MarketMeta
Range = 2 or consecutive candles of the same color.
Distribution Range - When price is above a distribution range it will act as support. When price is below, the

YM 9/4 4hrMonthly timeframe Pink
Weekly = Grey
Daily = Red
4hr = Orange
1hr = Yellow
15min = Blue
5min = Green

selling pressure or lack or buying pressure presents breakout ?* looking at this pattern and pivot points we see a reduction of power from buyers, unable to push the market higher, while sellers then are logically stronger.
* buyers are currently holding the price point in the purple line marked, but they are less able to defend it with every attempt to break

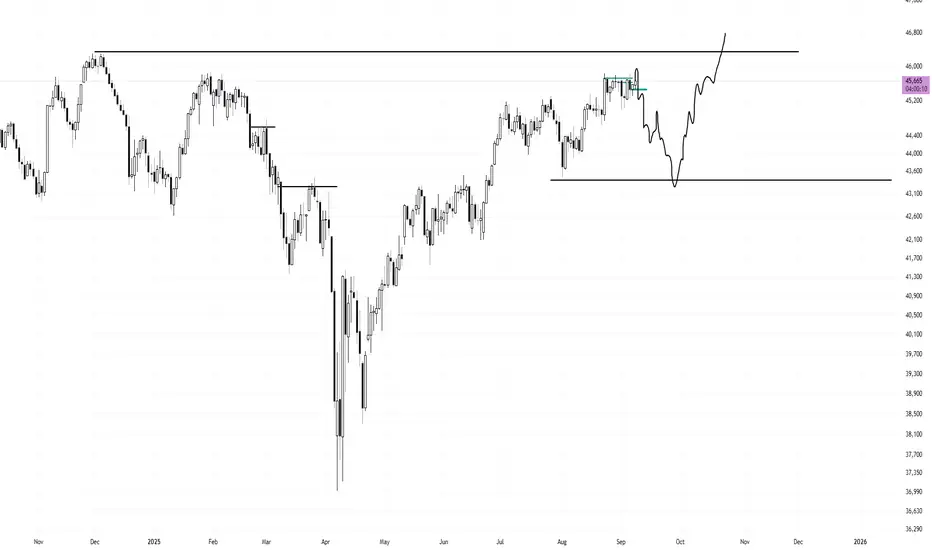
September Gameplan Down Month To Sweep Lows B/O ATHsSeptember I am going to look for bearish trades in line with these three peak wedge formations.
I am looking for 46,000 to possibly be the high of month
What I am seeing is a build up before the break out of all time highs. I believe the market will make one more dip down to the 43,000 area before
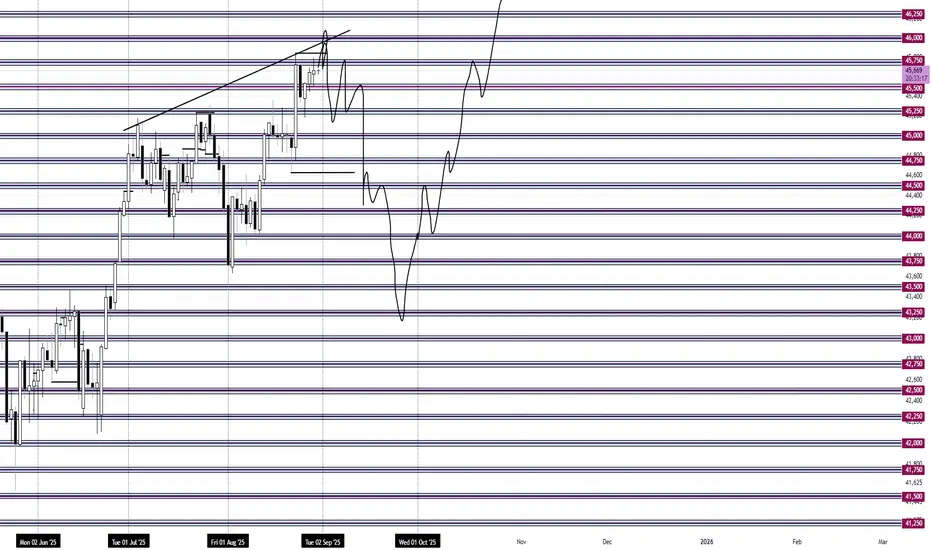
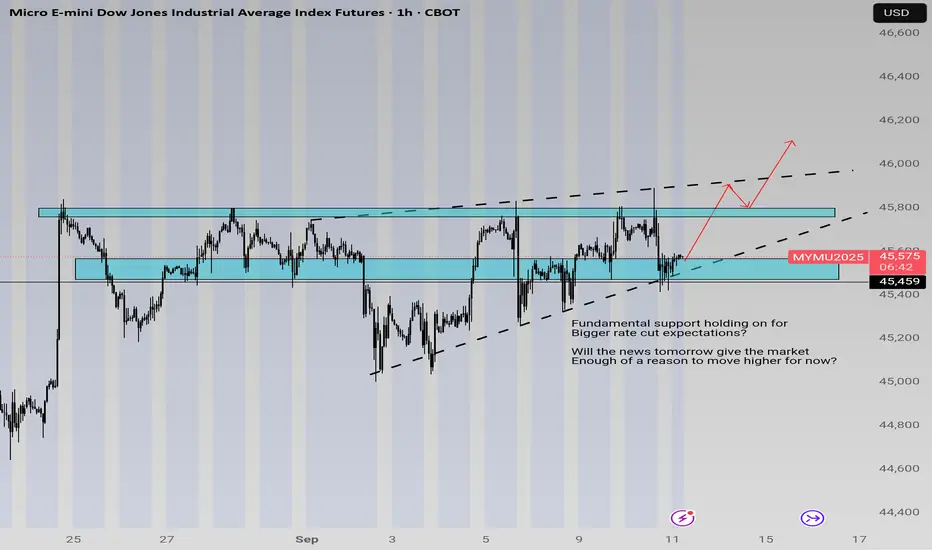
Technicals Illustrating Current Positioning of BullsEquities have bulls building into positions as seen with rising support, and the pressure against the supply zone around ATHs are becoming more squeezed as we get closer to next week.
The zone is main Key Level holding direction. Tomorrow's news will give more volatility and will be the next clue a
YM week 37Lets watch how these levels of interest react this week. There are 10 lines on the chart.
Monthly timeframe lines are pink
weekly timeframe = grey
Daily = Red
4hr = orange
1hr = yellow.

See all ideas
A representation of what an asset is worth today and what the market thinks it will be worth in the future.
Displays a symbol's price movements over previous years to identify recurring trends.
Frequently Asked Questions
The nearest expiration date for E-mini Dow Jones Industrial Average Index Futures (Sep 2013) is Sep 20, 2013.
Traders prefer to sell futures contracts when they've already made money on the investment, but still have plenty of time left before the expiration date. Thus, many consider it a good option to sell E-mini Dow Jones Industrial Average Index Futures (Sep 2013) before Sep 20, 2013.