Dow jones ( us30) - Has All the Good News Been Priced?
Dow Jones Is Loading for a Violent Break Into ATH
The corrective phase is nearly complete, and the chart structure is tightening exactly as expected.
Market Geometry confirms that momentum is building for a sharp upside continuation — with the next destination set firmly toward a new **All-Time
Related futures

YM UpdateOverbought, but probably overshoots it like last time.
YM is the only index that has not filled the TACO gap. WOndering if it matters....

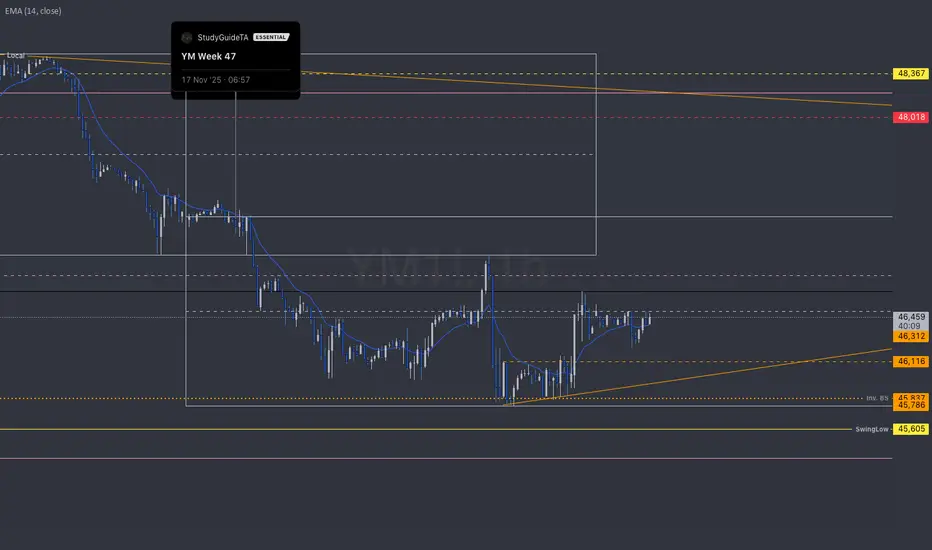
YM | Week 50T.A explained -
BackSide (BS)
FrontSide (FS)
Inverse BS (Inv.BS)
Inverse FS (Inv.FS)
BS & FS levels are expected support when dashed lines, tested when dotted and resistance when solid lines.
The inverse is true for the Inv. BS Inv. FS levels, they are resistance as dashed lines, tested as dotted

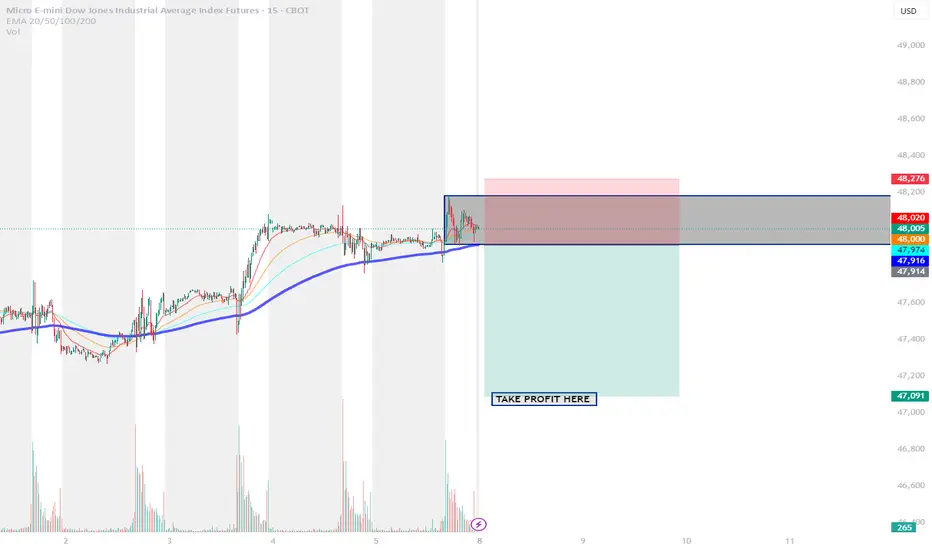
Short YM Trading ideaIf we broke this box to the downside I expect price will go to 1.5 Standard deviation or 4.23 Fibo Level drawn from the box
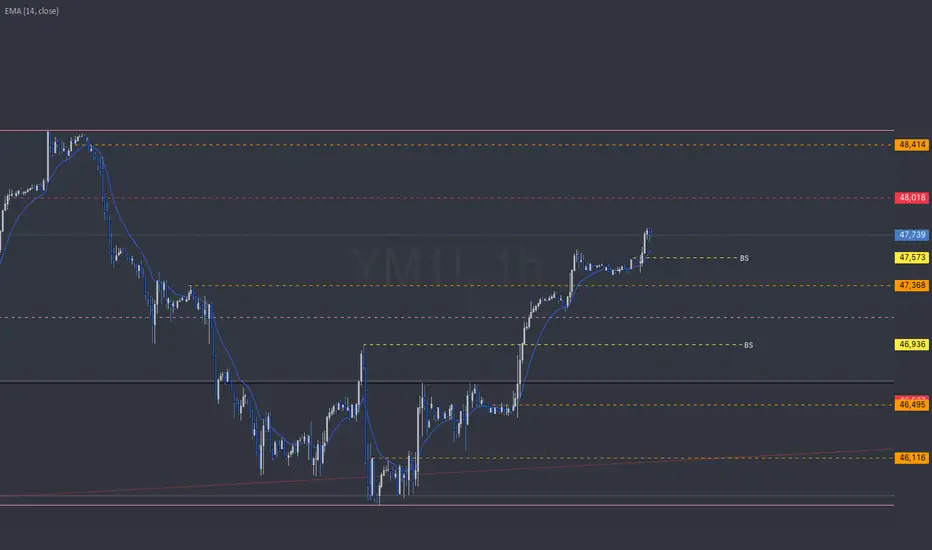
YM | Week 49 | 1hr chartT.A explained -
BackSide (BS)
FrontSide (FS)
Inverse BS (Inv.BS)
Inverse FS (Inv.FS)
BS & FS levels are expected support when dashed lines, tested when dotted and resistance when solid lines.
The inverse is true for the Inv. BS Inv. FS levels, they are resistance as dashed lines, tested as dotted
$YM Long the pullback.In the Dow today, we're coming off yestserday's fresh breakout to the upside, which makes us bullish for today.
We're simply waiting for a pullback on the 30 minute chart. We want a touch of the Weekly VWAP +1 standard deviation. Stop loss just above Weekly-VWAP.
Manage your risk and wait for the

Rapid ORB ProFew more signals in YM and SL also gold is forming. So lets see how far we could go today. All live trades. Most importantly 7 signal has already been populated on Gold and we are expecting a very good our come.

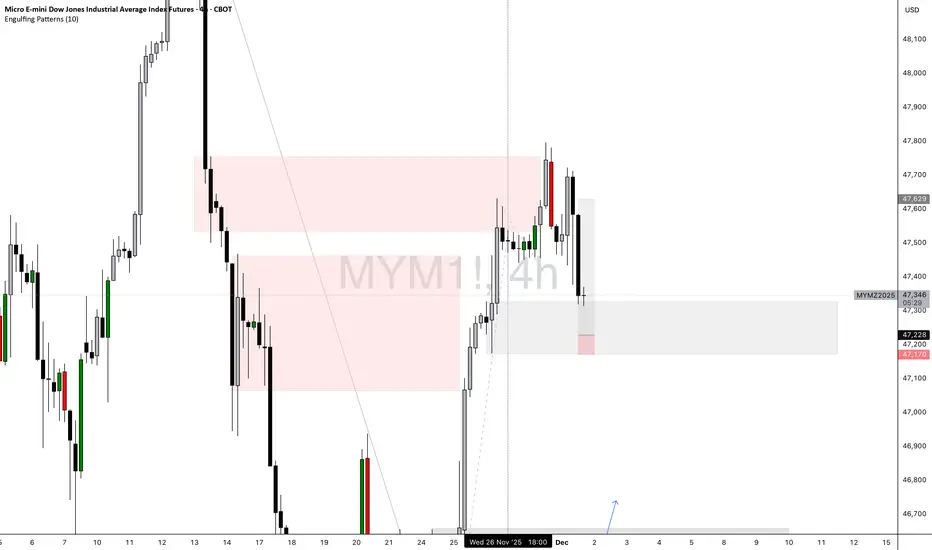
4h RBR with 15 min 4h demand in control after removing supply. daily demand also in control
entry zone is 15 min nested in 4h
YM Week 48 (1hr chart)T.A explained -
BackSide (BS)
FrontSide (FS)
Inverse BS (Inv.BS)
Inverse FS (Inv.FS)
BS & FS levels are expected support when dashed lines, tested when dotted and resistance when solid lines.
The inverse is true for the Inv. BS Inv. FS levels, they are resistance as dashed lines, tested as dotted
$YM | Get long the pullback!Today we go through plans in $YM. After a large bull day, it's not the best day to trade as the market often needs a 'day of rest'. However, we were able to dig into our tools and come up with a solid plan to potentially get long.
Hopefully you can learn something from this video about how to make

See all ideas
Summarizing what the indicators are suggesting.
Neutral
SellBuy
Strong sellStrong buy
Strong sellSellNeutralBuyStrong buy
Neutral
SellBuy
Strong sellStrong buy
Strong sellSellNeutralBuyStrong buy
Neutral
SellBuy
Strong sellStrong buy
Strong sellSellNeutralBuyStrong buy
A representation of what an asset is worth today and what the market thinks it will be worth in the future.
Frequently Asked Questions
The current price of E-mini Dow Jones Industrial Average Index Futures (Dec 2025) is 47,598 USD — it has fallen −0.27% in the past 24 hours. Watch E-mini Dow Jones Industrial Average Index Futures (Dec 2025) price in more detail on the chart.
The volume of E-mini Dow Jones Industrial Average Index Futures (Dec 2025) is 97.00. Track more important stats on the E-mini Dow Jones Industrial Average Index Futures (Dec 2025) chart.
The nearest expiration date for E-mini Dow Jones Industrial Average Index Futures (Dec 2025) is Dec 19, 2025.
Traders prefer to sell futures contracts when they've already made money on the investment, but still have plenty of time left before the expiration date. Thus, many consider it a good option to sell E-mini Dow Jones Industrial Average Index Futures (Dec 2025) before Dec 19, 2025.
Open interest is the number of contracts held by traders in active positions — they're not closed or expired. For E-mini Dow Jones Industrial Average Index Futures (Dec 2025) this number is 82.09 K. You can use it to track a prevailing market trend and adjust your own strategy: declining open interest for E-mini Dow Jones Industrial Average Index Futures (Dec 2025) shows that traders are closing their positions, which means a weakening trend.
Buying or selling futures contracts depends on many factors: season, underlying commodity, your own trading strategy. So mostly it's up to you, but if you look for some certain calculations to take into account, you can study technical analysis for E-mini Dow Jones Industrial Average Index Futures (Dec 2025). Today its technical rating is buy, but remember that market conditions change all the time, so it's always crucial to do your own research. See more of E-mini Dow Jones Industrial Average Index Futures (Dec 2025) technicals for a more comprehensive analysis.