$CELO on watch to close above $3 on the weeklyIf this manages to close above $3, I'll be entering long!
Trade ideas

CELO LOOKING PROMISINGit's a very simple trend analyses on time frame : daily
having broken the recent reliable trend very nicely one can say we have big gain ahead of us but it all depends on the momentum of market
so put your stop loss and take profit levels wisely.
have a good one
and as always make a choice.
good luck *(whatever that means)

CELO USDT Observation>>>>>>>>>>>>>>>>>Hello Everyone
Based on the chart.CELO was able to get ready to hitting the resistance's by high power
This is not all, and CELO will find the potential to reach higher prices by updating the network(Fundamentals). (You can read abut programs in site)
Currently engaged in daily time frame with 20-day MA and 100-day MA resistance at 4-hour time frame.
So We Can Expect To Hitting Our price Goal's.
I Have Tried My Best to Bring the best Possible outcome in this Chart
PLZ RDOR
With Good Hopping>>>>>>>>>>>>>>>>>>>>>>>>>>>>>>>>>>>>>>>>>>>>>>>>>>>>>>>>
CELO - the buy level for the investmentHello, everyone!
The new heading - where is the bottom for altcoins! Let's get started with the CELO coin.
The Fibonacci retracement for the last downside impulse was corrected exactly to the 0.61 Fib. In this case the final downside target is the Zone 27 $1.83 - $2.25. There will be very nice accumulation zone to enter the position.
Good luck!
DISCLAMER: Information is provided only for educational purposes. Do your own study before taking any actions or decisions at the real market.

Celo Usdt Long Swing | CELOUSDT | LONG @ 3.06 - 3.12 | TP @ 3.15, 3.18, 3.2, 3.22, 3.25 | SL @ 2.75 | PATTERN = WHITE MARUBOZU | KUCOIN |
Swing trade idea. Kindly follow targets and stop loss. Will update with new targets once all 5 are achieved.


CELOUSDTHello Crypto Lovers,
Mars Signals team wishes you high profits.
We are in the 4-hour time frame. The price has broken our S1 line and we are Short on CELO. However, if the price breaks the R1 line our scenario would have failed. The S1 line has not been able to support the price during the previous candles. It seems that the price is retesting the broken S1 line. If it stays below the R1 line then you can enter Short.
Warning: This is just a suggestion and we do not guarantee profits. We advise you to analyze the chart before opening any positions.
Wish you luck


CelousdtWe had an obo in the Celousdt diary, I missed my share, but the transaction is active.
This is not investment advice
This idea is a prediction, no one knows the future.

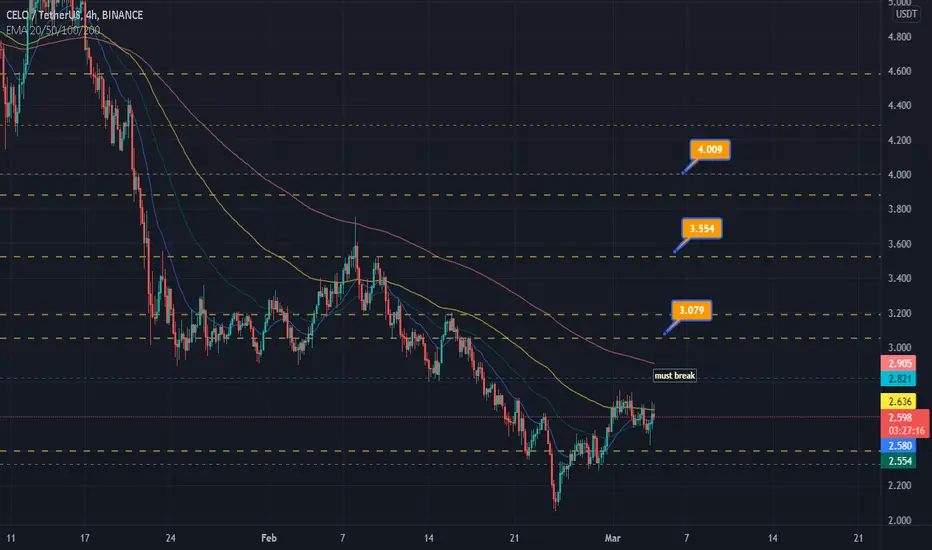
CELOUSDT is testing the 0.618 Fibonacci LevelThe price had a breakout from the descending channel on the daily timeframe ant it tried to have another breakout from the weekly resistance without any success.
Now the market is creating a head and shoulders on the daily timeframe and the price is testing the 0.618 Fibonacci level.
If the price is going to lose the support, we could see a retest of the dynamic support around 3.6$
–––––
Follow the Shrimp 🦐
Keep in mind.
🟣 Purple structure -> Monthly structure.
🔴 Red structure -> Weekly structure.
🔵 Blue structure -> Daily structure.
🟡 Yellow structure -> 4h structure.

$CELOwe have A BEAUTIFUL hidden divergence with RSI indecator
tell us the price ging down
line 2 is stronger then other for buying order

celo---usdtDue to the formation of the channel and the reversal of the price from the support area of the channel and also the creation of an inverted hammer pattern on the bottom of the channel, it is expected that the resistance area of the channel will increase in price.

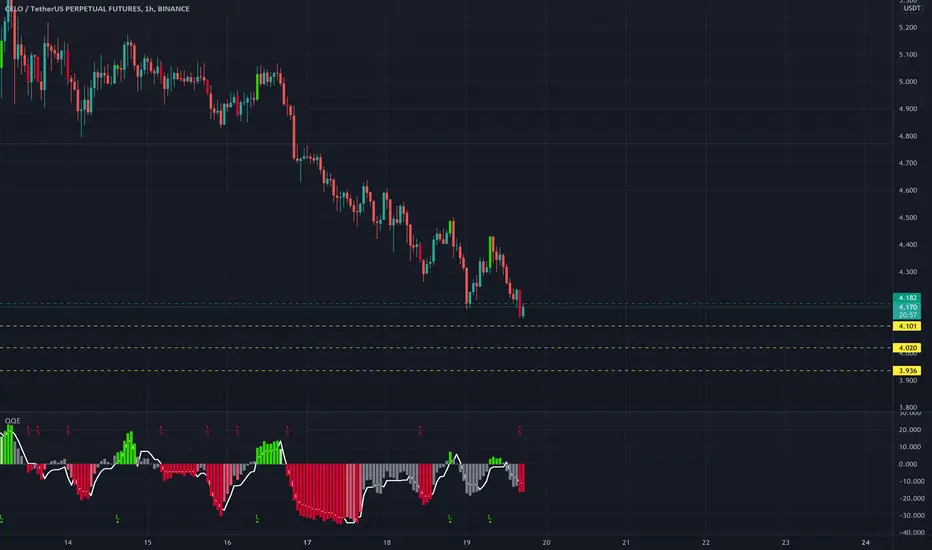
High Risk CELOUSDTPERP Short on the hourly time frameI am not taking this signal, but here's a high risk short. High risk because of BTC's weekly position. Nevertheless, this is an 8X short with liquidation as the SL and 3 TPs on the chart. This is a pullback entry short.

CELOUSDTBetween fibonacci levels of 0.5 and 0.618, limit buy orders can be placed with a ladder.
The current price doesn't look bad either, but bitcoin could ruin everything.

CELO/USDTANY FEEDBACK WOULD HELP ME OUT, SO I CAN UNDERSTAND IF IM DOING THIS RIGHT!!!
CELO/USDT. As you can see from the chart we have a descending triangle pattern occurring, making lower lows and lower highs. Using the Fib retracement from the highest point of each high, we can see each time the new highs are hit exactly on the golden ratio, where the current candle is you see we are directly on the golden ratio meaning that we could see it bounce off. However from the RSI indicator we have crossed over showing not a lot of buying pressure. Could see this dip down below following the descending triangle pattern.

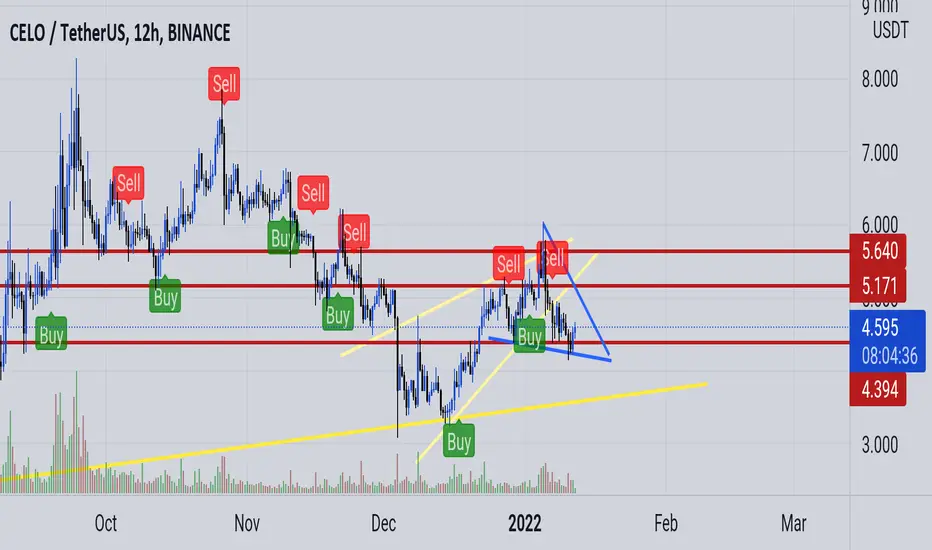
celousdtcelousdt if break the flag it will going for 6000usd
celo agar parchamesh ro beshkane mitone 6000 dollar ro bebine .
movafagh va piroz bashid. ❤❤❤❤

CELO, it's worth waiting for clear preconditions. CELO is in a big value area. It is worth highlighting that the price has broken the trend line and tested it as support. This is a good signal. At the moment the price is in the middle of this range and there are no clear prerequisites to open a position.
In case of a squeeze and breakout of the key level, there could be a good buying opportunity.
Write in the comments all your questions and instruments analysis of which you want to see.
Friends, push the like button, write a comment, and share with your mates - that would be the best THANK YOU.
P.S. I personally will open entry if the price will show it according to my strategy.
Always make your analysis before a trade.


