CELR : Sensitive areaHello friends🙌
✅Considering the decline we had, you can see that the price has been well supported in the support area drawn with Fibonacci and now it seems that it wants to go up to the specified ranges, which are also good and high-volume ranges, and these areas are like magnets for the price.
✅
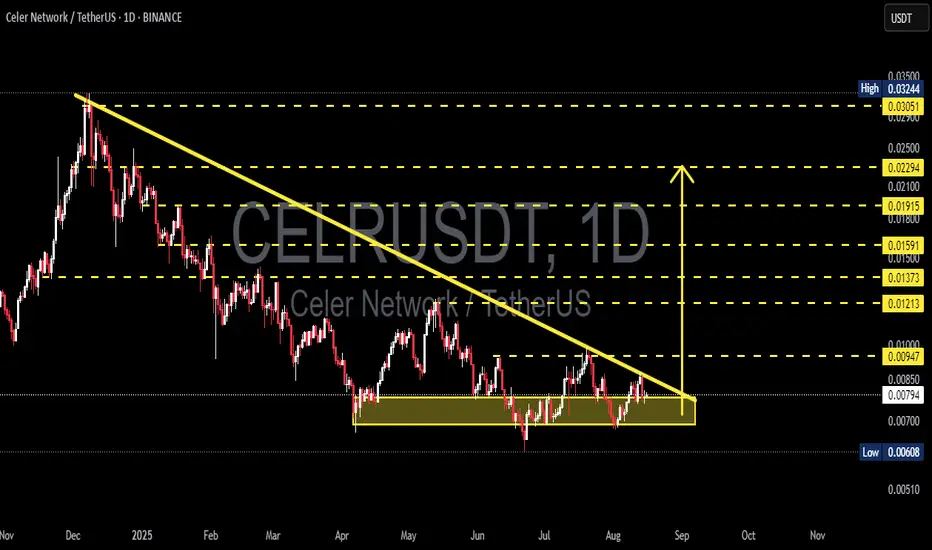
CELRUSDT – Descending Triangle: Breakout or Breakdown?Summary
Overall trend remains bearish since the late 2024/early 2025 peak (downtrend line in yellow).
Price is now compressed into a Descending Triangle:
– Falling resistance (yellow diagonal).
– Flat support / demand zone in 0.0074–0.0086.
Key horizontal levels (yellow dashed lines): 0.00947, 0.
#CELR/USDT#CELR
The price is moving within a descending channel on the 1-hour frame, adhering well to it, and is on its way to breaking it strongly upwards and retesting it.
We have a bounce from the lower boundary of the descending channel. This support is at 0.00686.
We have a downtrend on the RSI indicat

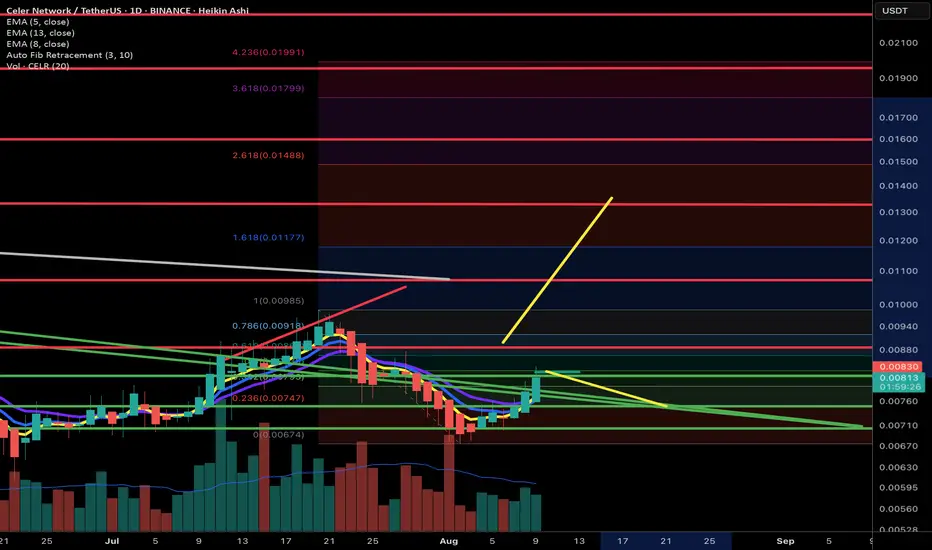
CELRUSDT 1D#CELR is on the verge of breaking above the Descending Broadening Wedge and the SMA100 on the daily chart. A confirmed breakout could set the stage for a move toward the following targets:
🎯 $0.01001
🎯 $0.01228
🎯 $0.01612
🎯 $0.01921
⚠️ As always, use a tight stop-loss and apply proper risk managem

CELRUSDT IDPrice action and RSI breakout already happened. Price stability suggest that its ready for the next leg up.
Its weekend, low volume,
Trade at your on risk.
NFA
Manage your Risk

CELRUSDT 1D AnalysisCELR ~ 1D Analysis
#CELR Buy after successfully penetrating this resistant line with a short -term target of at least 10%+.

$CELR BREAKOUT?$CELR broke out of 105 days downtrend. Just need more volume to kick in. Over 100% in potential returns.
📍Potential Targets:
0.01130
0.01390
0.01635
0.01794
Plan will be invalidated upon acceptance back into trendline.

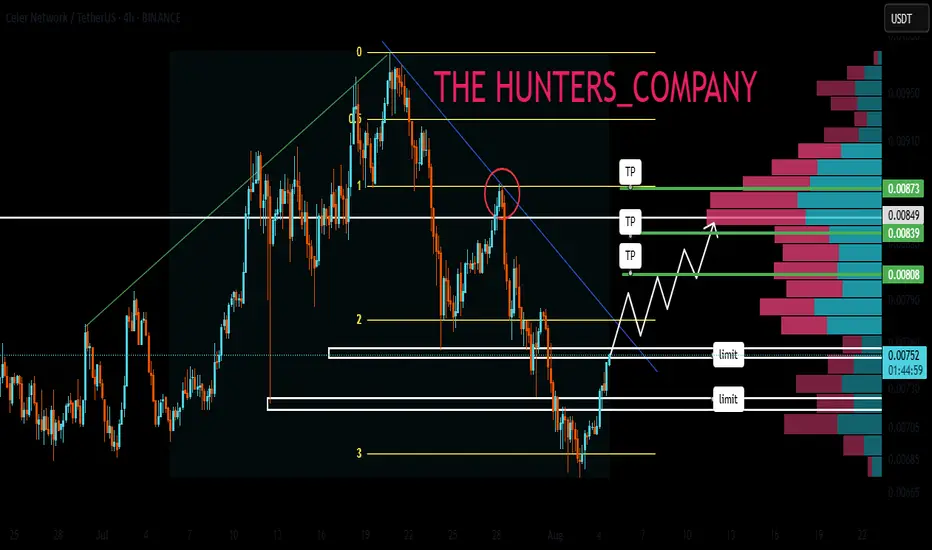
Celer Network Short-Term Full Trade-Numbers (PP: 126%)Celer Network is starting to move as it recovers from a descending trend. A break of this trend will lead to some growth and this growth can easily produce 100%+ profits in the short-term.
Here, I want to share the full trade-numbers for this chart setup.
_____
CELRUSDT (PP: 126%)
ENTRY: $0.007

Is Celer clear to buy?3 times Chain of +Dv in MACD, supporting level, breaking the down trade lin and end of correction time shows to change the structure to up trend. I think here is the low risk to buy.

See all ideas
Summarizing what the indicators are suggesting.
Oscillators
Neutral
SellBuy
Strong sellStrong buy
Strong sellSellNeutralBuyStrong buy
Oscillators
Neutral
SellBuy
Strong sellStrong buy
Strong sellSellNeutralBuyStrong buy
Summary
Neutral
SellBuy
Strong sellStrong buy
Strong sellSellNeutralBuyStrong buy
Summary
Neutral
SellBuy
Strong sellStrong buy
Strong sellSellNeutralBuyStrong buy
Summary
Neutral
SellBuy
Strong sellStrong buy
Strong sellSellNeutralBuyStrong buy
Moving Averages
Neutral
SellBuy
Strong sellStrong buy
Strong sellSellNeutralBuyStrong buy
Moving Averages
Neutral
SellBuy
Strong sellStrong buy
Strong sellSellNeutralBuyStrong buy
Displays a symbol's price movements over previous years to identify recurring trends.