NAS100 at Crossroads: Bulls Eye 25K Breakout or Pullback Trap?Spot Price: 24,875 | Session: London-NY Overlap | 09:43 UTC+4
━━━━━━━━━━━━━━━━━━━━━━━━━━━━━━
🔎 Market Structure Overview
Price action on NAS100 reveals a consolidation phase following last week's bullish momentum. The index is currently hovering near a critical demand zone, with buyers defending the 24,800 handle aggressively. On the higher timeframes, the trend remains intact, but shorter intervals suggest a potential retracement before continuation.
📈 Multi-Timeframe Breakdown
5M & 15M: Minor bearish divergence forming on RSI as price prints higher highs while momentum weakens. Watch for a pullback toward 24,820 for scalp entries.
30M: Price respecting the ascending trendline from Friday's lows. A breach below 24,790 invalidates this structure.
1H: Ichimoku Cloud providing solid support – Tenkan crossing above Kijun signals short-term bullish bias.
4H: Bollinger Bands tightening, hinting at an imminent volatility expansion. VWAP anchored at 24,850 acting as intraday pivot.
🧠 Technical Confluence Zones
Key Resistance: 24,950 – 25,020 (psychological barrier + prior swing high)
Key Support: 24,780 – 24,720 (demand cluster + 50 SMA on 1H)
⚡ Pattern Recognition
A potential ascending triangle is developing on the 30M chart, with horizontal resistance near 24,920 and rising lows. A decisive breakout above this ceiling could trigger acceleration toward 25,050. Conversely, failure at resistance may initiate a corrective wave toward the 24,700 region.
📐 Wyckoff & Elliott Perspective
Current price action resembles Phase C of accumulation under Wyckoff methodology – a spring or shakeout below 24,800 would confirm smart money absorption before markup. From an Elliott standpoint, we appear to be completing wave (iv) of a larger impulse sequence, with wave (v) extension targeting 25,100+.
━━━━━━━━━━━━━━━━━━━━━━━━━━━━━━
🎯 Trade Setup – Intraday Long
Entry Zone: 24,820 – 24,850 (on pullback to demand)
Stop Loss: 24,740 (below structure invalidation)
Take Profit 1: 24,950 (initial resistance)
Take Profit 2: 25,020 (extended target)
Risk-Reward: Approximately 1:2.5
🎯 Alternative Setup – Short Scalp (Counter-Trend)
Entry: 24,940 – 24,960 (rejection at resistance)
Stop Loss: 25,010
Take Profit: 24,850
━━━━━━━━━━━━━━━━━━━━━━━━━━━━━━
⚠️ Risk Note: Monitor US economic calendar for potential catalysts. Thin pre-holiday liquidity could amplify volatility – adjust position sizing accordingly.
Trade wisely. Protect capital first. 💼
Trade ideas

NAS100 Trade Secured 1500 PipsPrice swept SSL in London session and continued to make HL internally so i expected price to continue higher

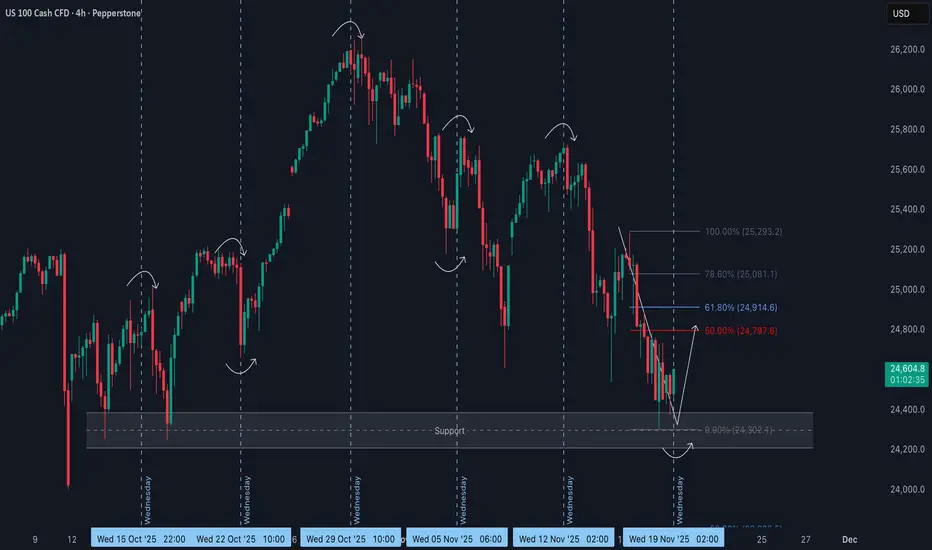
NAS100 Bullish Structure Break with Key Fibonacci Level in PlayThe NAS100 is now showing clear signs of strength, with a solid bullish move and a confirmed break of structure on the 4-hour timeframe 🚀. With this shift, the focus turns to how price behaves on the pullback.
The main level of interest is the 61.8% Fibonacci retracement of the current swing. A buy setup becomes valid only if price retraces and holds above the 61.8 level 🔥. Holding above this zone would indicate a shallow pullback — a strong sign that buyers are stepping in aggressively and maintaining control.
If price respects the 61.8 and then breaks structure to the upside again, that’s the confirmation needed to look for long opportunities 📊.
However, if price breaks below the 61.8 level, the idea is invalidated and should be abandoned. A deeper retracement may signal weakness, although it could also be a smart-money liquidity run before a continuation — either way, the priority is to see momentum hold above 61.8 to keep the bullish narrative intact ⚠️.
Not financial advice.


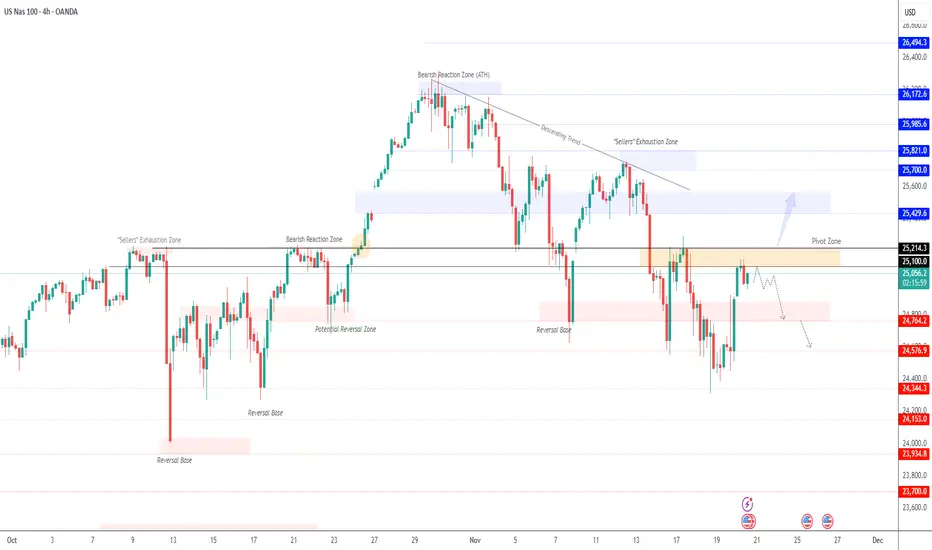
USNAS100 –Key Breakout Levels | Bearish Below 25100 Ahead of NFPUSNAS100 | OVERVIEW
NASDAQ futures surged as Nvidia’s strong earnings eased concerns of an AI-driven market bubble, boosting overall tech sentiment.
Markets are now shifting attention to the NFP and U.S. jobs report, with expectations of elevated volatility throughout the NY session, especially given Nvidia’s strong influence on tech stocks.
Technically:
Below 25100: Bearish continuation toward 24880 → 24760 → 24350
Above 25215: Bullish breakout toward 25430 → 25650 → 25700
Pivot: 25100
Support: 24880 · 24760 · 24350
Resistance: 25220 · 25430 · 25650
USNAS100 stays bearish under 25100; only a confirmed close above 25215 will signal bullish continuation.
NAS 2 MOON ?Ok so i made my oblivion call
where i expect incomprehensible shorting wothon the us stock market however i see one last impulse cooking up might react at the red levels and tank there before it goes my way idk but my bias is bullish and $27295 is my target
weekly timeframe keeps making higher highs if it breaks structure well game over

NASDAQ Week 32 OutlookOn the US Nas 100 1-hour chart, a bearish breakout from a symmetrical triangle suggests downward momentum. The Fair Value Gap at 23,500.0 is a pivotal level—watch for a breakout and retest here to confirm sell entries. Aim for the target at 22681.1, with a stop-loss at 23,740.4 to protect against adverse moves.

NAS100 BuyThe recent drop in the Nasdaq is largely tied to fears that the AI rally has become overheated, with major tech names pulling back sharply as investors question whether recent gains were justified. Much of the selloff reflects anxiety rather than a breakdown in fundamentals, as highlighted by concerns over an AI bubble in the CBS News report. However, this correction also sets the stage for a potential bullish reversal. The long-term growth story for AI remains intact, and strong underlying fundamentals could draw buyers back once panic selling eases. Market overreaction often creates attractive entry points for institutional investors, especially if leading tech companies deliver solid earnings or upbeat guidance. A shift in Federal Reserve tone toward more supportive policy would also boost growth stocks significantly. With investor sentiment still optimistic about the future of technology despite short-term volatility, the Nasdaq has room to recover and potentially resume its broader uptrend.

NAS100 1:1.5 RRThis is a trade idea, posting for future reference
not to be taken as financial advice

NASDAQDO YOU KNOW WHATS BEHIND THIS OR OTHER IDEAS?? in bio..
Preferably suitable for scalping and accurate as long as you watch carefully the price action with the drawn areas.
With your likes and comments, you give me enough energy to provide the best analysis on an ongoing basis.
And if you needed any analysis that was not on the page, you can ask me with a comment or a personal message.
Enjoy Trading ;)

NSDQ100 selling pressure below 24630 resistanceKey Support and Resistance Levels
Resistance Level 1: 24630
Resistance Level 2: 24920
Resistance Level 3: 25100
Support Level 1: 23816
Support Level 2: 23600
Support Level 3: 23300
This communication is for informational purposes only and should not be viewed as any form of recommendation as to a particular course of action or as investment advice. It is not intended as an offer or solicitation for the purchase or sale of any financial instrument or as an official confirmation of any transaction. Opinions, estimates and assumptions expressed herein are made as of the date of this communication and are subject to change without notice. This communication has been prepared based upon information, including market prices, data and other information, believed to be reliable; however, Trade Nation does not warrant its completeness or accuracy. All market prices and market data contained in or attached to this communication are indicative and subject to change without notice.

NAS100 Wednesday Reversal Potential from Key SupportOver the past several weeks, the NAS100 has shown a clear tendency for aggressive mid-week reversals, with Wednesdays repeatedly triggering sharp shifts in direction 🔄. This pattern suggests a strong time-based element in the algorithmic delivery of price, rather than random fluctuation.
🗓️ Each Wednesday has produced a notable reaction, whether through a liquidity grab, a stop run, or a full intraday reversal. With today being Wednesday once again, the timing aligns perfectly with the type of behaviour the market has been delivering consistently.
📉 The current decline has brought price directly into a well-defined high-timeframe support region. This area has a history of accumulation and typically holds a large amount of resting liquidity underneath it. The repeated wicks into this zone resemble classic Wyckoff spring behaviour 📦 — a sweep of sell-side liquidity followed by a potential response from larger players.
📐 The most recent bearish leg is noticeably overextended and has not offered a proper retracement since breaking lower. This leaves inefficiencies behind and increases the likelihood of a move back toward equilibrium.
🔄 Given the confluence of mid-week timing, the tap into higher-timeframe support, the liquidity sweep, and the extended nature of the current downswing, the expectation is for at least a corrective move back into equilibrium 📈.
A bullish break of short-term structure on the lower timeframes would strengthen this bias and open the door for a retracement into the premium levels listed above.
⚠️ Not financial advice. This is simply a technical outlook and my opinion.
Why Markets Struggle After a Big Drop (NASDAQ Case Study)Understanding liquidity, distribution phases and market-maker behavior
After the NASDAQ fell sharply from 25 000 to 24 000, many traders were surprised why the market suddenly stopped moving and started to “chop” around the same area.
But this behavior is not random — it’s a structural problem inside the order-flow.
1️⃣ Markets can fall fast — but they cannot continue without liquidity
Every trade in the market has a counter-party.
If traders want to buy the dip, someone must sell to them.
After a large drop, fewer participants are willing to sell at the new low prices.
Institutions are often already hedged or already sold during the fall.
Market makers cannot force liquidity out of thin air — they must create it.
This leads to a distribution phase, where price stops trending and starts rotating around a key area.
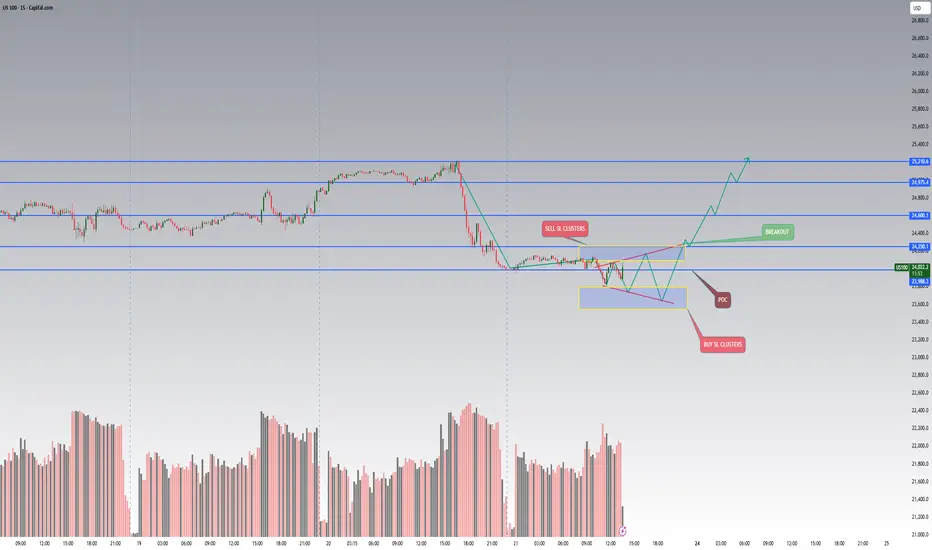
2️⃣ Why distribution forms around the Point of Control (POC)
When aggressive hedging is finished and volatility slows down, the market enters a phase where:
Price rotates around the Point of Control (POC)
Volume increases
Market makers attempt to rebuild liquidity on both sides of the range
This is not accumulation or re-accumulation — it is a liquidity-engineering phase.
Market makers need enough:
Buy-side liquidity above POC (stop losses of shorts, breakout traders, trapped buyers)
Sell-side liquidity below POC (stop losses of longs, late dip-buyers, liquidation clusters)
Without these pools, the market cannot initiate the next impulsive move.
3️⃣ The problem with sell-side liquidity after a big fall
When NAS dropped from 25k → 24k:
Most weak longs were already liquidated
Many sellers closed positions or took profit
Fresh shorts hesitate to enter at the lows
Institutions are waiting for better prices
This creates a liquidity vacuum.
To solve this vacuum, the market “mirrors” trades inside the range:
Price moves up → build stops above
Price moves down → build stops below
Repeated sweeps → fill both sides of liquidity
Only after enough stop-loss clusters form, the market is capable of moving again with real momentum.
4️⃣ What this means for traders
This is not a buy or sell signal.
It’s an explanation of why the market becomes extremely slow, sideways or manipulative after a big impulsive move.
In this phase:
Breakouts usually fail
Trend trading performs poorly
Range traps occur frequently
Market reacts strongly to liquidity pockets, not fundamentals
The key is to understand what the market is missing:
➡️ Not direction.
➡️ Not fundamentals.
➡️ But liquidity.
Until the liquidity pools are recreated, the next real directional move cannot start.
5️⃣ Final takeaway
A strong decline does not end because “buyers step in.”
It ends because no more sellers exist at those levels, forcing market makers to rotate price and rebuild the order-book.
Learning to identify these liquidity-reset periods helps traders avoid:
Chasing breakouts
Entering too early
Getting trapped during fake momentum
Misreading sideways distribution as a reversal
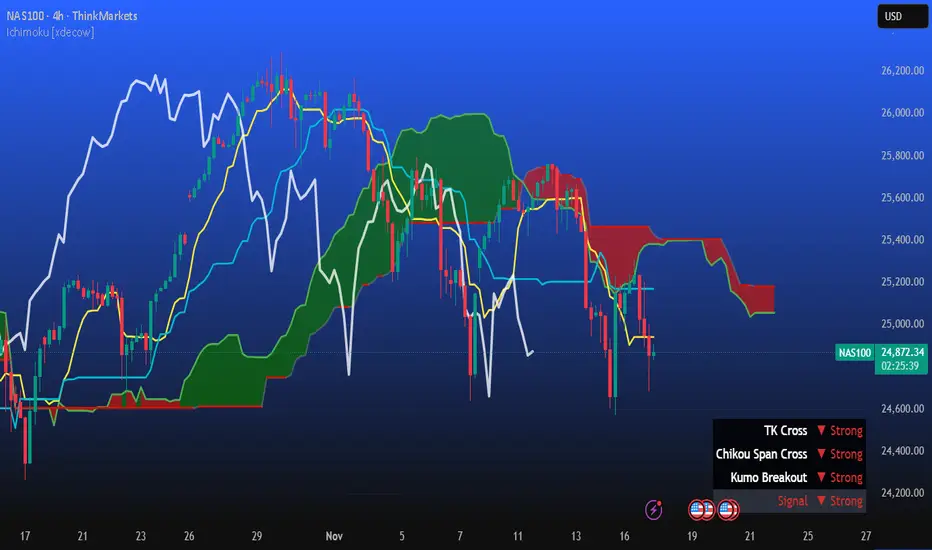
NAS100 - Waiting for buy setup on 4hr timeframeTimeframes Used: Monthly → Weekly → Daily → 4H
Current Market Condition:
Nas 100 is a valid trade according to my system rules:
Monthly: Price is above the Cloud → Bullish
Weekly: Price is above the Cloud → Bullish
Daily: Price is above the Cloud → Bullish
----------------------------------------------------------------------------------------------------------------
What I’m Waiting For:
I’ll be watching for the next 4H breakout opportunity.
Price to break above the 4hr timeframe.
NAS100 H4 | Potential bullish reversalMomentum: Bearish
The price may experience a short-term pullback toward the identified buy-entry level, which aligns with a key pullback-support zone.
Buy Entry: 24,851.44
Pullback Support
Stop Loss: 24,362.73
Multi Swing-Low Support
Take Profit: 25,774.15
Pullback Resistance
High Risk Investment Warning
Stratos Markets Limited (tradu.com ), Stratos Europe Ltd (tradu.com ):
CFDs are complex instruments and come with a high risk of losing money rapidly due to leverage. 70% of retail investor accounts lose money when trading CFDs with this provider. You should consider whether you understand how CFDs work and whether you can afford to take the high risk of losing your money.
Stratos Global LLC (tradu.com ): Losses can exceed deposits.
Please be advised that the information presented on TradingView is provided to Tradu (‘Company’, ‘we’) by a third-party provider (‘TFA Global Pte Ltd’). Please be reminded that you are solely responsible for the trading decisions on your account. Any information and/or content is intended entirely for research, educational and informational purposes only and does not constitute investment or consultation advice or investment strategy. The information is not tailored to the investment needs of any specific person and therefore does not involve a consideration of any of the investment objectives, financial situation or needs of any viewer that may receive it. Past performance is not a reliable indicator of future results. Actual results may differ materially from those anticipated in forward-looking or past performance statements. We assume no liability as to the accuracy or completeness of any of the information and/or content provided herein and the Company cannot be held responsible for any omission, mistake nor for any loss or damage including without limitation to any loss of profit which may arise from reliance on any information supplied by TFA Global Pte Ltd.

NAS100 Bullish Setup on 1hrNAS100 Bullish Setup on 1hr
Bullish Setup presented on 1hr
- Bullish divergence
- 1hr FVG created in this crazy sell off
- 1hr unfinished candle at my TP level
Entry: 24160
TP: 25000
SL: 23980
RR: 1:5.71

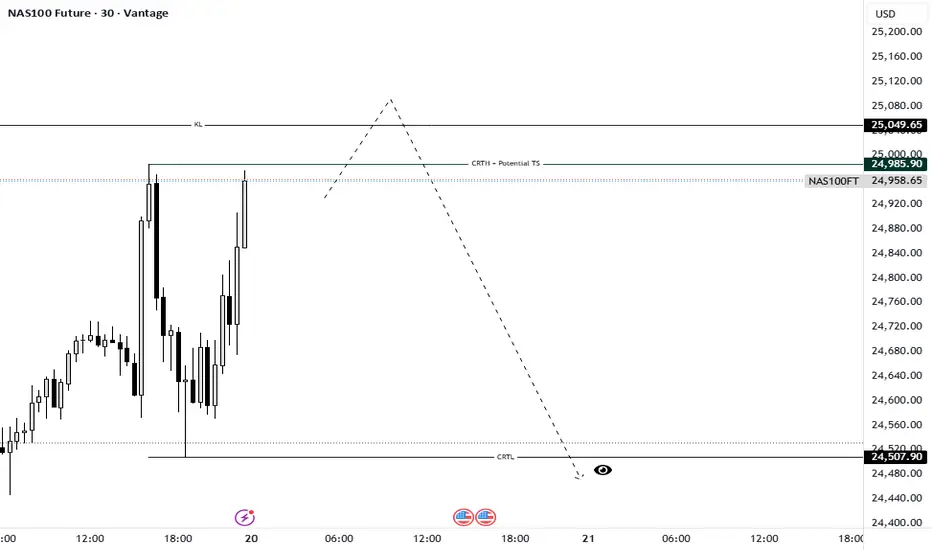
NAS100 Future: Waiting for the Turtle Soup Short SignalTimeframe: 30M | Model: Potential Turtle Soup (TS) / Bearish Model #1 Setup
The Nasdaq is setting up a crucial liquidity event that aligns perfectly with the CRT Manipulation (Candle 2) phase. We are currently consolidating just below a major structural high, which is acting as a magnetic zone for stops.
Here is the speculative short thesis:
The Trap Zone: The level at 24,985.90 is marked as the CRTH (Candle Range Theory High) and our "Potential TS" line. This is where most early breakout traders will place their buy stops, or where swing traders will look to enter short.
The Liquidity Hunt: We anticipate the market will execute a Turtle Soup—an aggressive spike above 24,985.90, potentially reaching the secondary resistance (RL) at 25,049.65, before immediately failing. This sweep is required to fuel the subsequent massive drop.
The Trigger (Bearish Model #1): Our entry signal (the Bearish Model #1) will only be confirmed IF price closes decisively back below the CRTH line after the liquidity sweep (the failure candle).
Targets:
Primary Objective (CRTL): If the Turtle Soup and reversal confirm, we expect a strong, fast drop (the Distribution, or Candle 3, phase) targeting the CRTL (Candle Range Theory Low) at 24,507.90. This low is holding significant Sell Side Liquidity (SSL).
Discipline: This is a high-risk, high-reward setup. Do not enter until the Turtle Soup has completed and the Bearish Model #1 reversal candle has closed. Patience is required to avoid being the liquidity that fuels the institutional move.
Wait for the Sweep. Trade the Reversal.
Greetings,
MrYounity
US100NASDAQ ( US - 100 )
- Completed " 12345 " Impulsive Waves
- Break of Structure
- Demand Zone
- RSI - Divergence
- Order Block

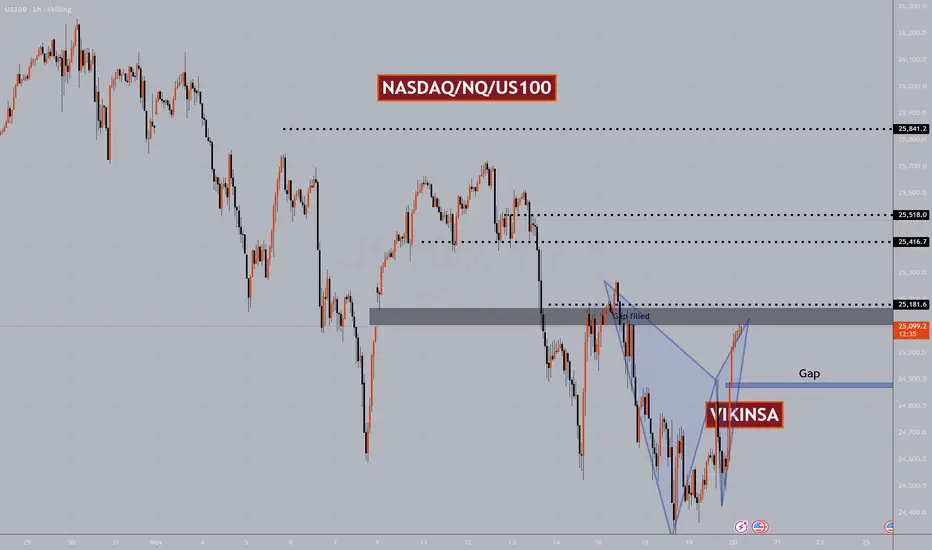
NASDAQ $NQ US100 Major Levels And PatternsNasdaq bounced yesterday heavily and completed a W pattern. I personally have been able to capture majority of this move. You can consider yesterday's W pattern a sort of double bottom which means hat more bullishness is expected in the medium term.
On a short term, now that it has completed a W pattern and reached previous important zone which had a gap, so we can expect a correction here but this may not be a big one. In a rare case there may not be any correction here at all because NASDAQ is forming a pattern which when forms usually ignores all the smaller W and M patterns.
For that reason my Bias is bullish and I will look for buying opportunities mostly.
There are certain Higher time frame levels that I am watching closely which you will find on the chart.
Trade what you see, manage the risk.
Follow for more. Please support this analysis by liking, commenting, and sharing with friends, colleagues, traders, and trading communities. Thanks👍🙂
US100 (NASDAQ) - LONG IDEANAS hit its major support level and seems to be respecting that level, NASDAQ shifted its internal structure looking good to buy at the current price. Do your own analysis before taking any trade, this isn't a financial advise.

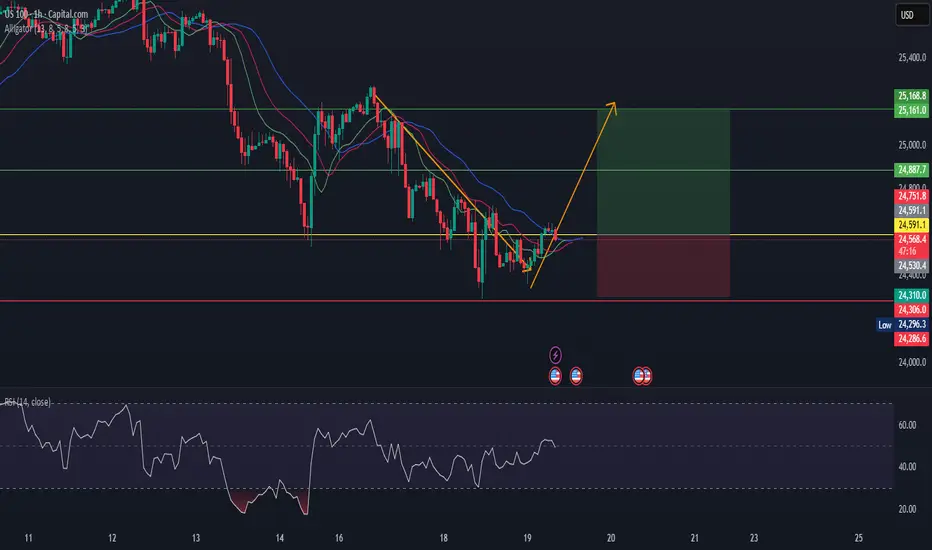
US100US100 is in reversal mode.
As per my analysis.
Alligator direction change to upward.
bullish divergence also made.
See here strong buy indicatin.
Buy at CMP.
nasdaq buyhi evryone the nasdaq index can rise to the specifed target. please don't forget capital managment

NDX today is the day.🚀 Today is the day that marks a before and after. ⚡️🔥
We haven’t even tasted true tech-sector FOMO yet — not even close.
Right now we’re sitting in the same extreme fear zone we saw back in early April…
and you know exactly what happened next. 😉
Google is leading the charge, showing the path the entire index is meant to follow.
And tonight, NVIDIA provides the fuel ⛽🔥
The rest of the market will move to its rhythm — like an orchestra waiting for the conductor.
Make no mistake:
🎄🚀 A massive Christmas rally is coming.
The kind that leaves you speechless.
The kind people remember for years.
The kind that turns disbelief into FOMO… and FOMO into vertical candles.
Buckle up.
The real move is just beginning. 😉
🔥🚀📈
#TechRally #NVIDIA #GoogleLeading #FearToFOMO #SantaRally #MarketShift #NextLegUp
