US100 trade ideas

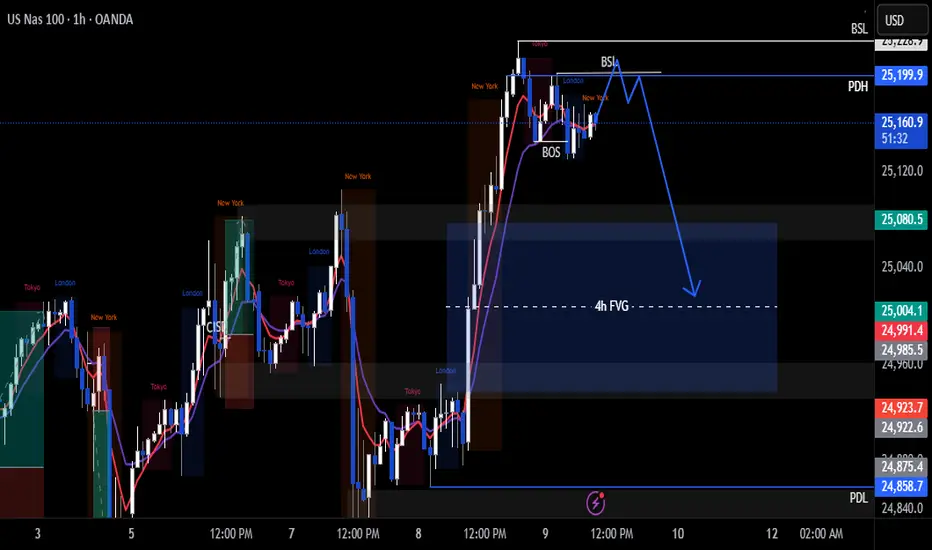
Nas100 Trade Set Up Oct 9 2025Price is currently making LH and broke structure so i want to see a sweep of BSL followed by a 1m IFVG/CISD to target 50% of the 4h FVG
www.tradingview.com

NDXNDX seems drawn to the middle of the channel about 24k, if we lose that support then we can expect it to hit the bottom of the channel around 22500...if it mirror the covid drop, then long term this will continue higher.

NASDAQ Did the 1D MA50 just save the day??Nasdaq (NDX) suffered a historically strong daily sell-off on Friday following President Trump's tariff threats and touched (and closed on) its 1D MA50 (blue trend-line).
Last time it hit that trend-line was on September 02 and that was a technical Higher Low on the 5-month Channel Up. Friday's Low was also very close to the bottom of this pattern. At the same time the 1D RSI hit and rebounded on its Lower Lows Support trend-line.
With the market rebounding and opening considerably higher today, it is more likely technically that we have started the pattern's new Bullish Leg. With the last two such sequences rising by at least +11.00%, we expect a new similar uptrend, which as long as the 1D MA50 holds, could hit at least 26000 within a 40 day horizon.
-------------------------------------------------------------------------------
** Please LIKE 👍, FOLLOW ✅, SHARE 🙌 and COMMENT ✍ if you enjoy this idea! Also share your ideas and charts in the comments section below! This is best way to keep it relevant, support us, keep the content here free and allow the idea to reach as many people as possible. **
-------------------------------------------------------------------------------
💸💸💸💸💸💸
👇 👇 👇 👇 👇 👇


NasSecond hits on shorts 🩳
She looking for $24,940…
$24,980 first up…
If can sustain high London will work towards it!!!

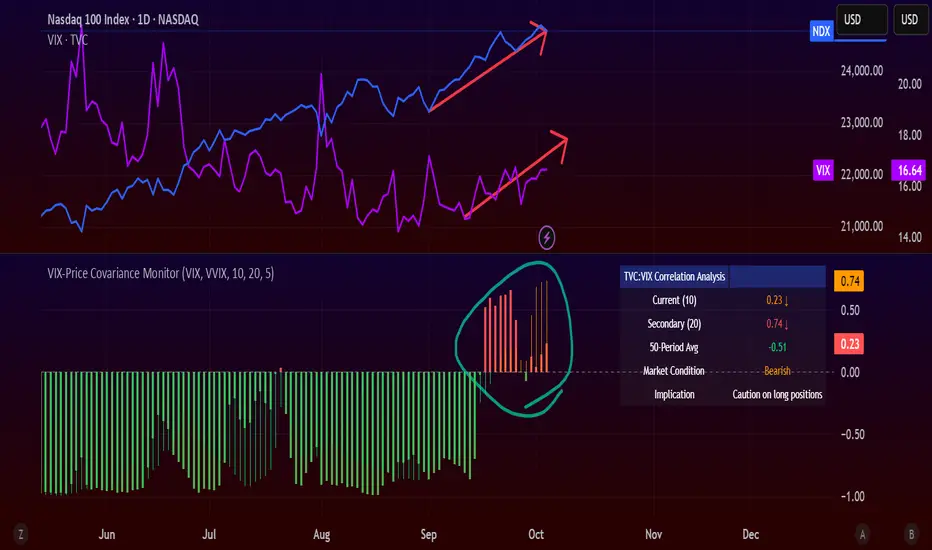
ALERT: VIX-NDX COVARIANCE HITS DANGER ZONEA few days ago, my custom VIX–Price Covariance Monitor started flashing red... and it hasn’t cooled off since.
Here’s what that means 👇
- The TVC:VIX (volatility index) and NASDAQ:NDX (Nasdaq 100) are now moving in the same direction.
That’s not normal.
Usually, when stocks rise, volatility falls.
But when both start climbing together — it means something under the surface is fracturing.
Half the times this correlation flips positive, the market corrects or worse, it crashes.
I’m not panic‑selling, but I’m definitely not buying either for now.
No new longs unless it’s a screaming opportunity.
In the meantime? Stacking cash and sitting tight.
This is time to play close attention to the market,
Sells in orderWe are taking short positions as price is aggressively dropping will be targeting previous HL areas as Tp zone and looking at the price action for potential scaling opportunities to the downside of price.

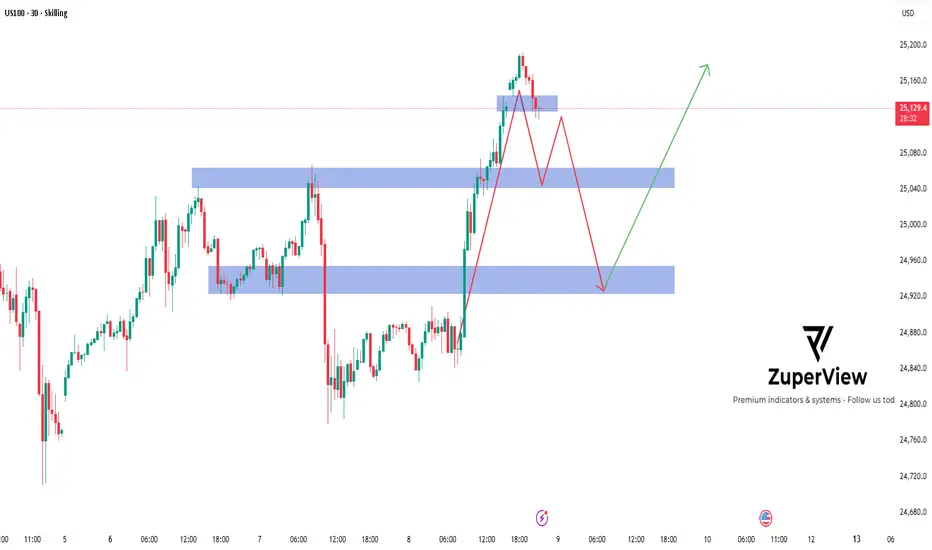
US100: Potential reversal from overbought zone
Symbol: SKILLING:US100
Timeframe: 30 Minutes
Indicators: OB/OS Overlap (RSI, MFI, Stochastic) + S/R
________________________________________
🔍 Quick Summary
After a strong rally 🚀 from the 24,750–24,800 support area, US100 has reached the 25,280–25,300 resistance zone — where multiple oscillators are showing overbought signals.
This suggests potential profit-taking or a technical correction may occur soon.
________________________________________
📊 Price Structure
• Price formed a temporary top after tapping the overbought area, with clear rejection candles near resistance.
• A pullback toward the first support zone around 25,000–25,050 could occur before the next move.
• If selling pressure continues, the next target area lies near 24,800–24,850, where previous structure and demand overlap 📉.
________________________________________
🧩 Technical Highlights
• OB/OS Overlap: RSI, MFI, and Stochastic are all in overbought territory (3/3 alignment) — a strong early signal of potential short-term exhaustion.
• Price Action: A minor double top or bearish divergence may be forming if momentum indicators continue to decline.
• Key Zones: Blue zones on the chart mark areas of potential buyer reaction (demand).
________________________________________
🧭 Scenario Outlook
Main Scenario (🔻 Pullback Expected):
Price could retrace toward 25,000–24,850 before buyers attempt a rebound.
Alternative Scenario (🚀 Continuation):
If the price holds above 25,100 and breaks 25,280, the bullish momentum might continue short-term.
________________________________________
⚙️ Risk Note
This analysis is for educational purposes only and not financial advice.
Always manage risk carefully and align your trade plan with your own strategy 📘💡.
Market conditions can change rapidly — stay flexible and objective!
Please like and comment below to support our traders. Your reactions will motivate us to do more analysis in the future 🙏✨
Harry Andrew @ ZuperView
NASDAQ Faces Downside Risk Amid Tariff and Shutdown UncertaintyUSNAS100 – Technical Outlook Aligned with Fundamentals
The Nasdaq 100 fell sharply on Friday, losing nearly 1,200 points within six hours as it retreated from its all-time high.
The drop came amid renewed U.S.–China tariff tensions and growing uncertainty from the ongoing U.S. government shutdown, which has delayed key economic data releases and weighed on sentiment ahead of third-quarter earnings season.
Technically, the index is showing clear bearish pressure, and sellers will likely maintain control while the price remains below 23,930.
A short-term corrective rebound toward 24,160 – 24,350 is possible before renewed downside momentum.
If the price closes a 1H or 4H candle below 23,930, it would confirm a continuation of the bearish trend, opening the way toward 23,700 → 23,500 → 23,350.
Conversely, as long as the index trades above 23,930, limited corrections may occur, but overall bias remains weak under current macro headwinds.
Pivot Line: 23,930
Support Levels: 23,700 / 23,500 / 23,350
Resistance Levels: 24,160 / 24,340 / 24,480
Summary:
Fundamental headwinds — from tariff threats to the shutdown’s data vacuum — are fueling pressure on tech stocks.
Technically, bias stays bearish below 23,930, with a potential correction toward 24,350 before continuation to the downside.


USNAS100 Extends Losses After Resistance RejectionUSNAS100 – Overview | Bearish Momentum Below 24,510
The index maintains a bearish momentum after dropping from its recent resistance zone.
As long as price trades below 24,510, the bearish trend is expected to continue toward 24,350 → 24,150.
A confirmed 1H close below 24,150 would extend losses toward the 24,000 area.
On the other hand, a 1H close above 24,550 would shift the structure bullish, opening the path toward 24,770 → 24,850.
Pivot: 24,510
Support: 24,350 – 24,150 – 24,000
Resistance: 24,700 – 24,850 – 25,000

US100 (NDQ): Trend in daily time frameThe color levels are very accurate levels of support and resistance in different time frames, and we have to wait for their reaction in these areas.
So, Please pay special attention to the very accurate trends, colored levels,
and you must know that SETUP is very sensitive.
Be careful
BEST
MT

Selling to Gap NAS100The picture says it all. I do not want to talk much. It is what it is. Risky trade as markey is bullish so risking small amount. Let us see.

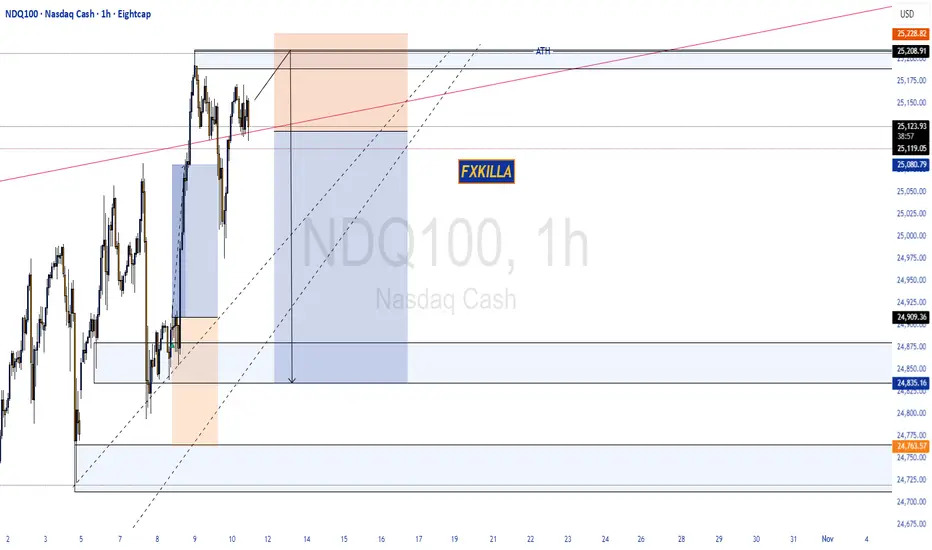
NASDAQ100 HIGH PROBABILITY SETUP SOON!!!🚨 NAS100 HIGH PROBABILITY SELL SETUP 🚨
* Here We Can See Clearly The Next Potential Move For US100 Coming Hours/Days.
* Keep Your Eyes Close On Your Trading Positions.
* Happy PIP Hunting Traders.
FXKILLA.
NAS100 4HThe price is currently in a pullback zone near the trendline and a key resistance area; therefore, the possibility of a correction or another decline cannot be ruled out.
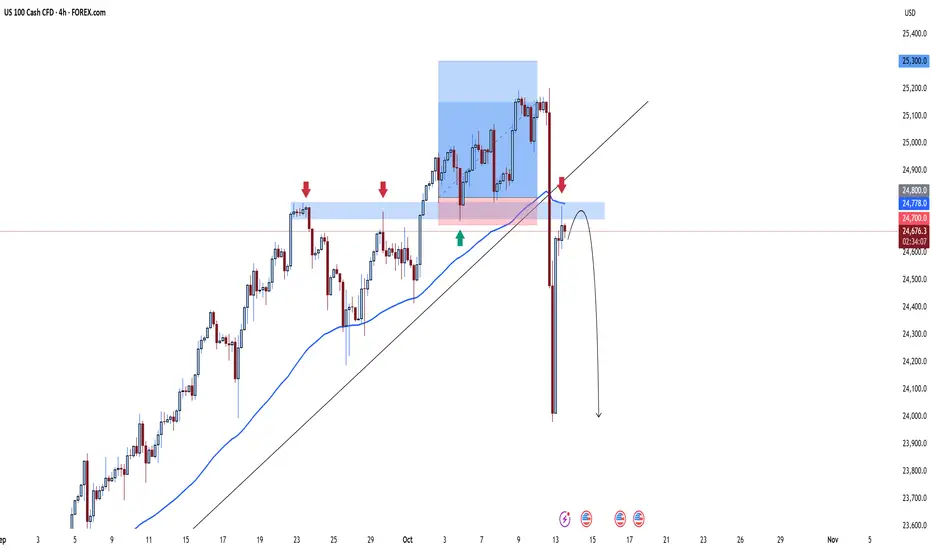
US100: Imbalance rejection – Bears back in control
🧠 SKILLING:US100 Technical Analysis
🧱 Resistance Zone (Imbalance)
• The 24,900 – 24,950 area acts as a strong resistance, overlapping with a supply/imbalance zone.
• Price has reacted bearish from this level, showing clear selling pressure.
• This is a potential area to look for short (Sell) setups.
________________________________________
📉 Current Market Structure
• After a sharp bullish retracement, price formed a rising channel 🔵.
• However, inside the highlighted circle, price has broken down from the channel — indicating weakening bullish momentum.
• This breakdown supports a short bias in the short term.
________________________________________
💡 Trade Plan
• Bias: Look for Sell setups near the resistance zone.
• Confirmation: Wait for a small pullback and a new lower high before entering short.
• Target (TP): Toward the Support zone 24,740 – 24,868 (previous bottom).
• Stop Loss (SL): Above resistance at around 24,950 – 25,000.
________________________________________
🟢 Support Zone
• The 24,740 – 24,780 area is the previous bottom, where price previously bounced strongly.
• This level might attract profit-taking from sellers or temporary buying interest.
________________________________________
⚠️ Risk Notes
• If price closes above 25,000 (H1 candle), the bearish scenario becomes invalid.
• Manage position sizing carefully and wait for clear confirmation before entering a trade.
________________________________________
🧭 Summary
• Short-term Trend: 🔻 Bearish correction
• Mid-term Trend: 🔄 Sideways – waiting for a breakout of either 24,740 or 25,000.
• Current Opportunity: Sell from resistance → Target support zone
Please like and comment below to support our traders. Your reactions will motivate us to do more analysis in the future 🙏✨
Harry Andrew @ ZuperView

US100 Bearish Breakout!
HI,Traders !
#US100 made a bearish
Breakout of the key
Horizontal level of 24795.7
Which is now a resistance
And the breakout is confirmed
So after the potential pullback
And retest we will be expecting
A further bearish move down !
Comment and subscribe to help us grow !

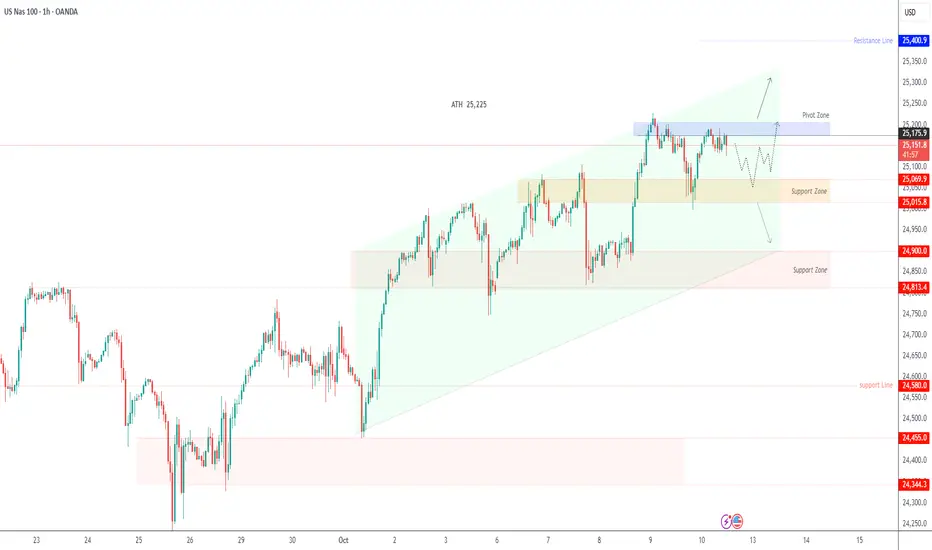
USNAS100 Extends Gains on AI Strength & Fed Cut Hopes?USNAS100 – Overview
Wall Street futures rose on Monday, extending last week’s rally as AI-related optimism and softer labor market data boosted expectations for a Fed rate cut later this year. The upbeat sentiment continues to support risk assets, though volatility remains sensitive to policy headlines.
Technical Outlook
The index has stabilized in a bullish zone, maintaining upward pressure above 24,900, with potential to extend toward 25,175, especially if it breaks 25,040.
To confirm a bearish reversal, the price must close a 4H candle below 24,810, which would expose downside targets near 24,580.
Pivot: 25,040
Resistance: 25,175 – 25,390
Support: 24,810 – 24,590 – 24,450
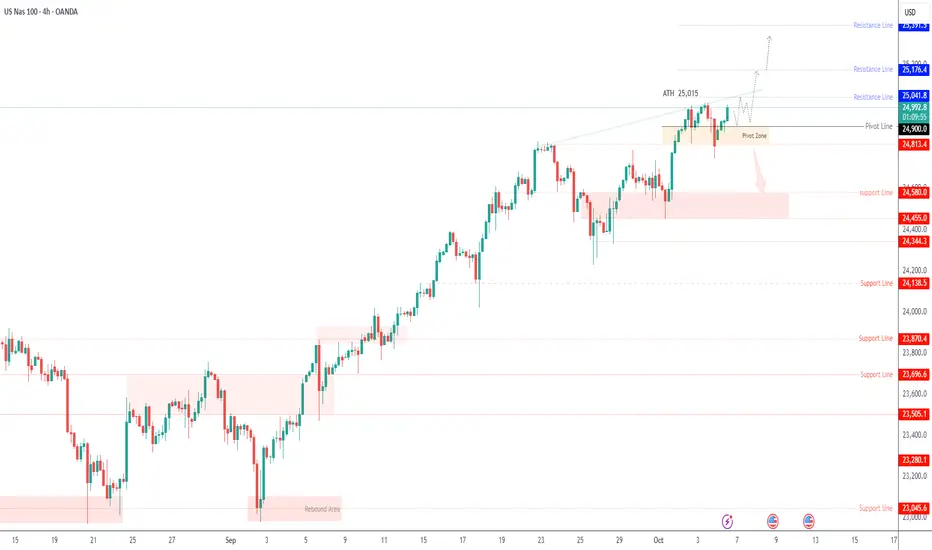
USNAS100 – Range Consolidation Before Breakout, Key Zone: 25,175USNAS100 – Overview | Range-Bound Ahead of Key Market Events
The NASDAQ 100 rebounded from the support zone highlighted earlier, though market sentiment remains cautious ahead of upcoming U.S. data releases and the prolonged government shutdown.
Price action shows consolidation near the upper range, with short-term traders watching for a breakout to define direction.
Technical Outlook
The index is currently capped below the 25,175 – 25,225 zone.
As long as price trades beneath this resistance band, momentum favors a bearish correction toward 25,070 → 25,015, and a sustained move below 25015 could extend losses to 24900.
Conversely, a 1-hour close above 25,220 would confirm a bullish breakout and open the path toward 25,300 → 25,390, with further upside potential if buyers remain in control.
Pivot Line: 25 175
Resistance: 25 300 · 25 390 · 25 450
Support: 25 070 · 25 015 · 24 900
Summary:
USNAS100 remains range-bound, trading between 25,070 and 25,225.
A breakout on either side of this range will define the next intraday move—above 25,220 favors continuation toward 25,390, while below 25,015 signals deeper correction toward 24,900.
US NAS 100Preferably suitable for scalping and accurate as long as you watch carefully the price action with the drawn areas.
With your likes and comments, you give me enough energy to provide the best analysis on an ongoing basis.
And if you needed any analysis that was not on the page, you can ask me with a comment or a personal message.
Enjoy Trading ;)

US NAS100Preferably suitable for scalping and accurate as long as you watch carefully the price action with the drawn areas.
With your likes and comments, you give me enough energy to provide the best analysis on an ongoing basis.
And if you needed any analysis that was not on the page, you can ask me with a comment or a personal message.
Enjoy Trading ;)
