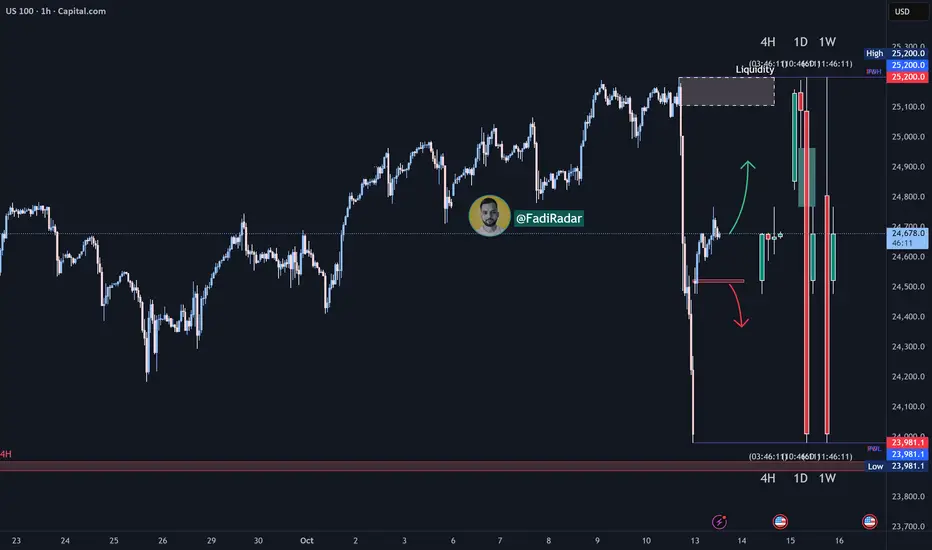
NASDAQ Index Analysis:📉 U.S. indices witnessed a sharp decline on Friday’s session, with the NASDAQ being one of the most affected, closing at 23,980.
📈 As Monday’s session opened, the market started with a strong bullish gap (Gap Up) at 24,480, then continued to move upward — a trend likely to persist in the coming hours.
🔹 Expected Scenario:
As long as the price remains above the 24,500 support zone, the likely movement is toward the 25,100 resistance level for a potential retest.
🔸 However, if 24,500 support is broken and closed below, we could see a deeper correction before the uptrend resumes.
US100 trade ideas
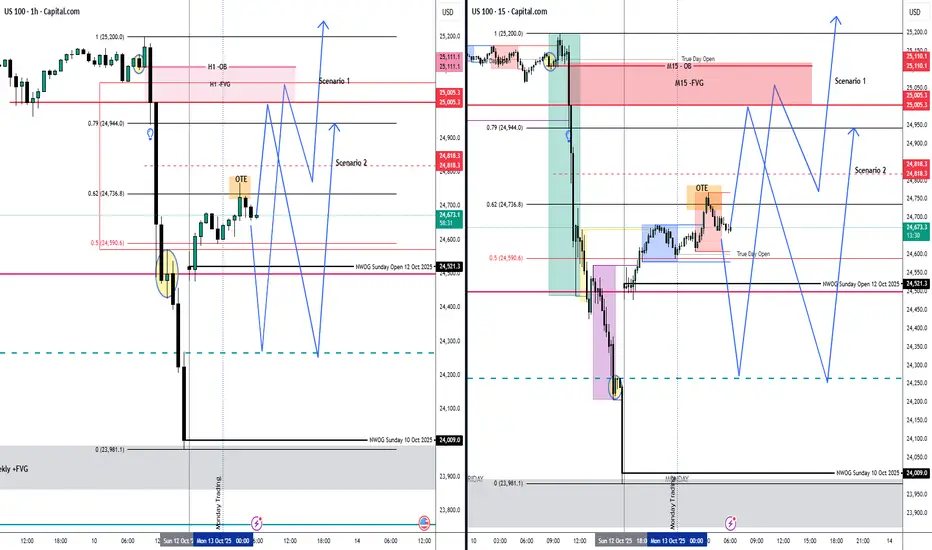
BULLISH TRADE IDEAS - IF THEN ANALYSISMONDAY: 13 OCTOBER 2025
PRE-NY ANALYSIS:
BULLISH INTRA-DAY IDEA FRAMED ON H1 AND REFINED ON M15:
- Market currently in a Premium and just caressed the OTE (62%) of the Fib
- Price also currently below the True-Day Open.
- Would like to see price trade lower into the Discount of the range before trading higher as per scenario 1.
- Otherwise, we look to scenario 2.
DISCLAIMER:
The owner of this page is an authorised Representative under supervision of TD MARKETS (PTY) LTD, an authorised Financial Services Provider (FSP No. 49128) licensed by the Financial Sector Conduct Authority (FSCA) under the Financial Advisory and Intermediary Services Act (FAIS).
The FSP is licensed to provide advice and intermediary services in respect of Category I financial products, including but not limited to derivative instruments, long-term deposits, and short-term deposits.
All investment ideas are provided in accordance with the scope of the FSP's license and applicable regulatory requirements. Derivative instruments is a leveraged products that carry high risks and could result in losing all of your capital, and past performance is not indicative of future results.
This idea and any attachments are informational/education and does not constitute advice.
No guarantee is made regarding the accuracy or outcome of this trade idea.
If you choose to accept this idea, please do so at your own risk.
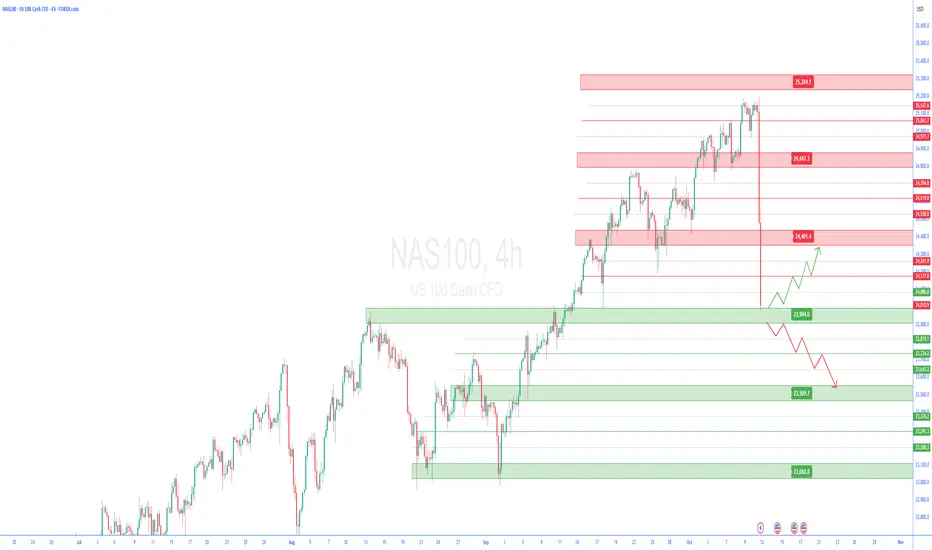
NAS100📊 NAS100USD 4H Analysis – Reversal Zones Identified
The Nasdaq 100 has seen a sharp bearish drop, breaking below recent highs with strong momentum. Price is now approaching a key support region where a short-term rebound could take place if buying pressure emerges.
Potential Reversal Zones:
🔹 24,446.9 – Primary support / first potential reaction area.
🔹 24,818.4 – 24,970.5 – Resistance range; watch for possible rejection if price rebounds.
The market remains under bearish pressure, but short-term corrections toward 24,800–25,000 are possible before any continuation of the downtrend.
If the current bearish momentum continues below 24,400, we could see further downside movement.
📈 Bias: Short-term corrective bounce within a broader bearish structure.
🕓 Timeframe: 4H

NasdaqHello traders! Last Friday, we had a major selloff in the 25,000 region, which quickly sent the Nasdaq crashing by more than 4% in just a few hours. In technical analysis, 24,000 is a price that has been broken previously and is now being tested as weekly support. If we expand this movement, we project a target price of 26,000, continuing the upward movement. The technology sector remains promising with advances in artificial intelligence, and we have no news of a Federal Reserve interest rate hike. Happy trading!

NAS100 4 H🔹 Overall Outlook and Potential Price Movements
In the charts above, we have outlined the overall outlook and possible price movement paths.
As shown, each analysis highlights a key support or resistance zone near the current market price. The market’s reaction to these zones — whether a breakout or rejection — will likely determine the next direction of the price toward the specified levels.
⚠️ Important Note:
The purpose of these trading perspectives is to identify key upcoming price levels and assess potential market reactions. The provided analyses are not trading signals in any way.
✅ Recommendation for Use:
To make effective use of these analyses, it is advised to manually draw the marked zones on your chart. Then, on the 5-minute time frame, monitor the candlestick behavior and look for valid entry triggers before making any trading decisions.
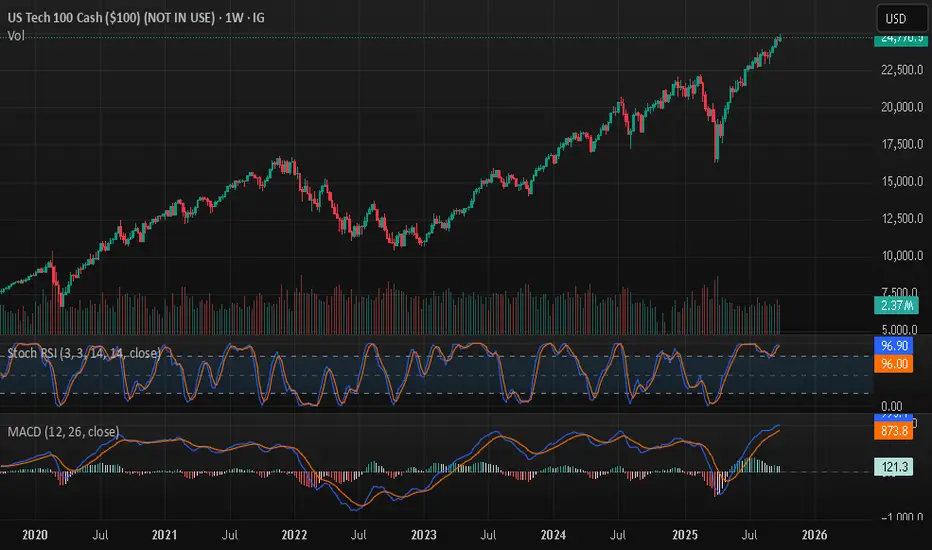
NAS100USD 1M – Tariff Shock After Record HighsThe NAS100 reached a new all-time high earlier this month, extending its recovery from the April 2025 low. However, October has turned into a sharp selloff after Trump’s announcement of a 100% tariff on China starting November 1st, triggering heavy liquidation and breaking multiple support levels. The key focus now is whether the 23,367.28 zone will hold as support or open the way for deeper downside.
Support at: 23,367.28 / 21,800.00 / 16,400.00 / 10,700.00 🔽
Resistance at: 25,249.79 🔼
🔎 Bias:
🔼 Bullish: A monthly close back above 25,249.79 would suggest renewed strength, keeping the long-term uptrend intact.
🔽 Bearish: Failure to hold 23,367.28 confirms October’s selloff continuation, exposing 21,800.00 as the next key downside target.
📛 Disclaimer: This is not financial advice. Trade at your own risk.

NAS100USD 4H – Tariff Shock SelloffAfter maintaining a strong bullish structure, the NAS100 sharply reversed following Trump’s announcement of a 100% tariff on China starting November 1st, triggering a heavy selloff that broke multiple support zones.
Support at: 23,985.8 / 23,700.0 / 23,350.0 🔽
Resistance at: 24,393.3 / 24,583.1 / 24,800.0 / 25,200.0 🔼
🔎 Bias:
🔼 Bullish: Only if price reclaims 24,583.1, confirming a recovery above broken structure.
🔽 Bearish: Continuation expected if candles close below 23,985.8, opening room for a deeper drop toward 23,700.0, 23,350.0, and 23,100.0.
📛 Disclaimer: This is not financial advice. Trade at your own risk.

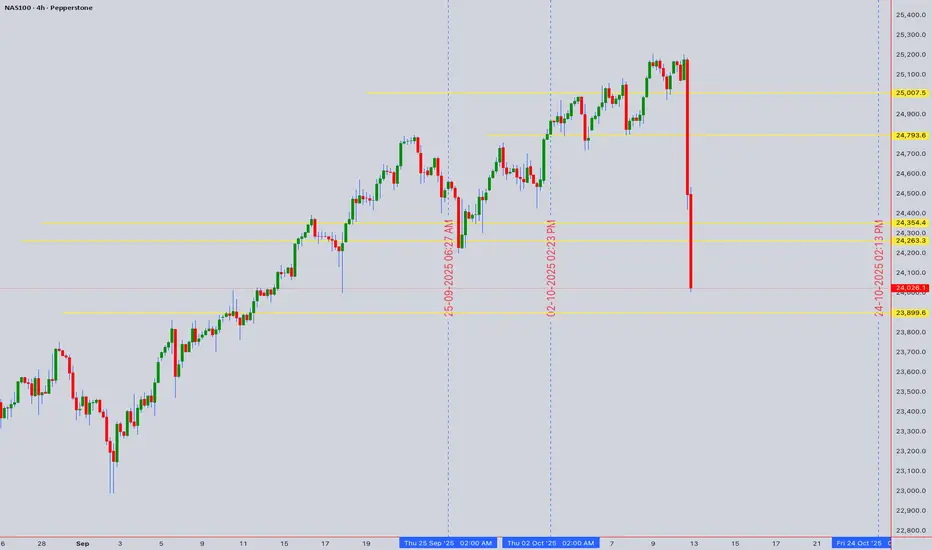
NAS100 Decision Point at All-Time HighsNAS100 Decision Point at All-Time Highs
Asset: NAS100 (NASDAQ 100) 11th Oct 2025 UTC+4
Closing Price: 24,026.1 | Bias: Neutral, awaiting breakout confirmation.
1. Multi-Timeframe Market Structure
Daily Chart Context: The index is in a powerful, sustained uptrend, trading near all-time highs. The recent consolidation suggests a pause within the broader bullish structure.
Critical Resistance: 24,200 - 24,300. A confluence of the recent swing high and a psychological barrier. A decisive daily close above 24,300 is the key bullish trigger.
Key Support Levels:
Immediate: 23,900 (Recent swing low & 4H consolidation base).
Primary: 23,650 - 23,750 (Previous resistance, now key support & 50 EMA area).
Major: 23,400 (Would signal a deeper correction).
2. Chart Pattern & Wyckoff/Elliott Wave Context
Pattern: The price action from the September low exhibits characteristics of a Wyckoff Accumulation phase, followed by a strong markup. The current pause could be a re-accumulation before the next leg up, or a distribution.
Elliott Wave Count: The rally from the ~23,400 low is impulsive. We are likely in a Wave 4 (corrective) consolidation. A break above 24,200 would confirm the start of Wave 5 towards new highs. A break below 23,650 would invalidate this count.
3. Indicator Confluence & Momentum
Ichimoku Cloud (Daily): Price is well above the Senkou Span (Cloud), confirming the strong bullish trend. The cloud itself is thick and rising, providing strong dynamic support.
RSI (14): On the daily, RSI is neutral (~60), not yet overbought, leaving room for further upside.
Bollinger Bands (4H): Price is hugging the upper band, indicating strength. A move to the middle band (~23,950) would be a healthy pullback.
Moving Averages: The 50 EMA (23,850) and 200 EMA (23,500) are bullishly aligned, acting as dynamic support layers.
Actionable Trading Plan
Intraday Trading (Based on 1H/15M Charts)
Bullish Breakout Setup:
Trigger: Sustained price action above 24,150 with rising volume.
Buy Entry: On a pullback to 24,100-24,130, or a break of 24,200.
Stop Loss: Below 24,000.
Targets: 24,300 (TP1), 24,450 (TP2).
Bearish Rejection Setup:
Trigger: Bearish reversal candle (e.g., Shooting Star, Bearish Engulfing) at 24,150-24,200.
Sell Entry: On the confirmation of the rejection.
Stop Loss: Above 24,250.
Targets: 23,950 (TP1), 23,850 (TP2).
Swing Trading (Based on 4H/Daily Charts)
Long Swing Entry:
Condition: Wait for a daily close above 24,300.
Entry: On the next pullback towards 24,200 (new support).
Stop Loss: Below 23,900.
Target: 24,600 - 24,800.
Short Swing Entry (Counter-Trend):
Condition: A clear break and close below 23,900.
Entry: On a retest of 23,900 as resistance.
Stop Loss: Above 24,100.
Target: 23,750, then 23,650.
Risk & Trade Management Note
The current setup is a high-probability bull trap if price fails at the 24,200 resistance. Conversely, a breakout opens significant upside. Do not chase price in the middle of the range. Patience for a confirmed trigger is key. Always use a stop-loss and manage position size accordingly.
failed entrythis was a good trade idea set up our SL was to tight we missed this one on both the HTF and LTF.

NSDQ100 Cautious consolidationNasdaq futures are pointing to a softer open today, as markets lose momentum following a record-breaking run. Investors are growing cautious amid renewed political and geopolitical tensions.
Market backdrop:
Equities pulled back modestly yesterday, with the S&P 500 down -0.28% and Europe’s STOXX 600 off -0.43%, as questions arose about the sustainability of the recent rally. The Nasdaq 100 also eased from record highs, mirroring the risk-off tone seen across regions and asset classes.
Macro drivers:
The US government shutdown—now entering its second week—is weighing on sentiment, especially after Trump vowed deeper spending cuts, raising fears of a prolonged fiscal impasse.
Rising 10yr Treasury yields (+2.1bps to 4.14%) and wider high-yield spreads (+9bps) suggest investors are turning more defensive.
Gold (-1.61%) also reversed sharply, falling below $4,000/oz, signaling some unwinding of safe-haven flows.
Geopolitical factors:
Tensions are rising ahead of the Trump–Xi meeting, with Beijing launching an antitrust probe into Qualcomm’s Autotalks deal, and new US legislation favouring Nvidia and AMD chip supplies for domestic use. The moves underscore potential risks for tech heavyweights with major China exposure.
Meanwhile, the Israel-Gaza hostage deal and Trump’s expected visit add another layer of geopolitical complexity.
Nasdaq 100 outlook:
Tech stocks may see selective pressure today as investors react to the escalating US–China tech dispute and higher yields. However, recent strength in AI and semiconductors could offer some support. Expect consolidation near record levels, with traders awaiting US consumer sentiment data later in the day for confirmation of demand resilience.
Tone: Cautious consolidation — Nasdaq 100 likely to trade sideways to slightly lower as macro and political risks temper recent euphoria.
Key Support and Resistance Levels
Resistance Level 1: 25200
Resistance Level 2: 25300
Resistance Level 3: 25400
Support Level 1: 24870
Support Level 2: 24730
Support Level 3: 24590
This communication is for informational purposes only and should not be viewed as any form of recommendation as to a particular course of action or as investment advice. It is not intended as an offer or solicitation for the purchase or sale of any financial instrument or as an official confirmation of any transaction. Opinions, estimates and assumptions expressed herein are made as of the date of this communication and are subject to change without notice. This communication has been prepared based upon information, including market prices, data and other information, believed to be reliable; however, Trade Nation does not warrant its completeness or accuracy. All market prices and market data contained in or attached to this communication are indicative and subject to change without notice.


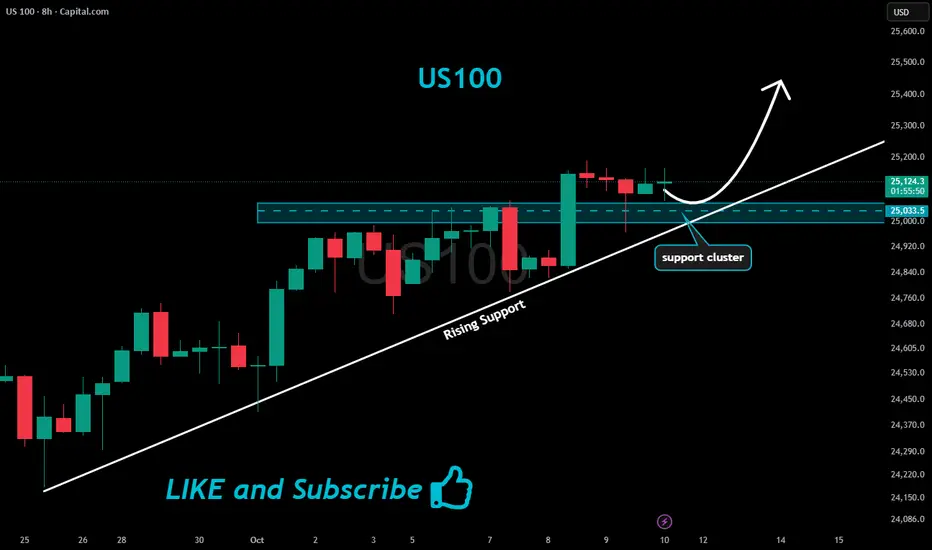
US100 Will Keep Growing!
HI,Traders !
#US100 is trading in an
Uptrend and broke
The key horizontal level
Of 25033.5 and the breakout
Is confirmed so after a potential
Retest of the support cluster
Of the rising and horizontal
Support lines below we will
Be expecting a bullish continuation !
Comment and subscribe to help us grow !
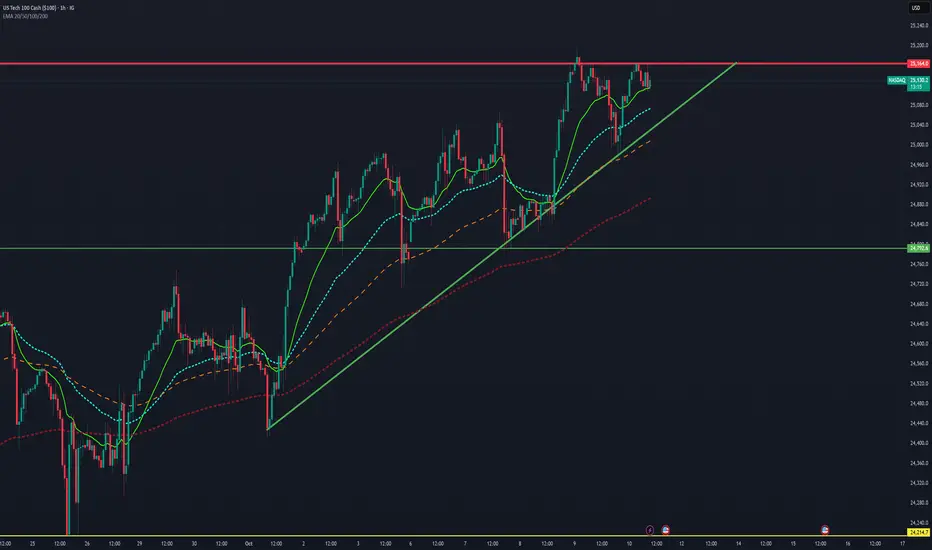
Tech Correction Deepens: NASDAQ Flashes Bearish Signal as YieldsThe market today is exhibiting a bearish bias for the technology-heavy NASDAQ (COMP) driven by a confluence of macroeconomic and technical factors.
Macroeconomic Headwinds: "Higher-For-Longer" Rates
The primary bearish catalyst is the sustained upward trajectory in long-term Treasury yields. High yields pressure growth and technology stocks, which comprise the bulk of the NASDAQ. Higher borrowing costs diminish the value of future earnings (discounted cash flow) for companies that rely on debt for aggressive growth, leading to multiple compression across the tech sector. This underlying fear of sustained high interest rates is keeping institutional capital cautious.
Geopolitical Instability and Risk-Off Sentiment
Escalating geopolitical tensions have introduced significant market uncertainty. While a direct economic impact is hard to quantify immediately, such events typically trigger a "flight to safety," with investors pulling money out of riskier, high-growth assets (like tech stocks) and into traditional safe-haven assets, pressuring the NASDAQ.
Technical Breakdown
Trend and Structure
The index exhibits a clear intraday uptrend , characterized by higher highs and higher lows.
A prominent rising green trendline acts as strong dynamic support, connecting the recent significant low points. The price has respected this trendline repeatedly, indicating bullish momentum.
The overall pattern on the right side of the chart appears to be forming an ascending triangle pattern, a continuation pattern that often resolves to the upside, though a breakout confirmation is required.
Key Price Levels
Resistance: The most critical level is the horizontal red resistance line at approximately 25,160.0. The price is currently challenging this level and has touched it multiple times without a decisive breakout to new highs. A confirmed break above this level would signal a continuation of the rally.
Support:
Dynamic Support: The rising green trendline provides immediate support. A break below this line would be the first sign of a significant shift in intraday momentum.
Key Support Zone: A visible support area is marked by a horizontal green line at approximately 24,790.0, which served as a previous reaction level before the final push higher.
Indicators (Moving Averages)
The chart shows several Moving Averages (MAs), which generally support the current bullish trend, as the price remains above all displayed MAs:
The price is trading well above the short-term MAs (solid light green and light blue lines), suggesting strong current bullish momentum.
The MAs themselves are generally sloping upwards and are in a bullish order (shorter-term MAs above longer-term MAs), which reinforces the current strength. A close below these moving averages, particularly the longer-term dashed ones, would indicate a decline in buying pressure.
Momentum Observation
The price action near the high suggests a slight loss of upside momentum, evidenced by the multiple attempts to break the 25,140.0 resistance without success. This could be interpreted as:
Consolidation before a potential breakout above the resistance.
A possible formation of a double top or exhaustion if the price fails to break resistance and subsequently breaks the rising trendline.
Nas100 money4/1 h range on the left. We had a push down to sweep buyers and a new leg to the upside that broke highs and created the range. Waited for price to retrace sub 702 fib to sweep liquidity, mitigate the last time sellers were in control (last down candle). Once we see that we can then expect that price can continue in its desired direction. 15 min tf gave us clear break to that direction taking profit at the creation of sellers (top of higher tf range). Clean cut same thing over and over. I hope someone can learn from the simplicity of this idea.

Bearish Outlook on NQ📉 Bearish Outlook on NQ
After completing the manipulation phase, NQ has tapped perfectly into the Bearish FVG (1H) zone around 25,366.45 – 25,392.25, sweeping both SSLs in the process. This confirms premium-level distribution, suggesting the market is ready for a downside move.
Scenario 1 – Primary (Bearish Bias):
Price rejects from the Bearish FVG 1H, fails to reclaim 25,366.45, and begins its descent. Liquidity below the BSL at 25,293.65 becomes the first target, followed by a clean run toward 25,264.95, completing a liquidity sweep below recent lows.
Scenario 2 – Rejection & Re-Test:
A short-term push above 25,330.55 (NAS100FT) to re-test the Bearish FVG 1H could offer another entry opportunity before the drop resumes toward 25,293.65 and 25,264.95.
Scenario 3 – Deep Liquidity Grab Before Reversal:
Should price tap deeper into the Bullish FVG 4H, we could see a final liquidity sweep below 25,264.95 before a stronger bullish reaction emerges.
🎯 Overall Bias:
Bearish — targeting liquidity below 25,293.65 and 25,264.95. Manipulation phase complete, distribution underway.
Follow and like for more.
Greetings,
MrYounity

NASDAQ (US100) Analysis:✴️ Overall Trend: Bullish
The NASDAQ index showed strong performance yesterday, reaching 25,190, marking a new all-time high.
A price correction toward the Fibonacci golden zone at 25,000 is expected. If this level is broken, the price may move down to the liquidity zone near 24,820.
📌 Best Buy Zones: Watch for a rebound from 25,000 or 24,820
📍 Best Sell Zone: Upon breaking 25,100
⚠️ Disclaimer:
This analysis is not financial advice. It is recommended to monitor the markets and carefully analyze the data before making any investment decisions.

Nas100 sellsNasdaq is going to sell in the near term, because the price is making continuous lower lowers and it is going to take a very liquidity above and then continue the sell

NasdaqLit it that whole hour from the last post…..
Yum 🤤
Rolling stops, nothings going in the bin this time lol…
💵 💣
Lasssgooo!!!!

NAS shortsNasdaq attempts…
She looking for $25,012.
I’m allow $25,250 here, tag it all up….
Surely!!!
We take L here in leave her alone for a bit lmaooo
LFG light it up 🔥
Allow the next hour…

SILVER BULLET-CENTRAL STANDARD TIMESunday Open around 24,813 level..Market traded back into Sunday's open on 10/7/25 created a Silver bullet @ 1PM CST(2pm NYC)..began to trade to the upside 10/8/25..1:4-1:5 RR

NSDQ100 awaits FOMC minutes and Fed commentaryMarkets saw a cautious tone yesterday, with risk sentiment softening amid political uncertainty in France and ongoing concerns about a US government shutdown. The S&P 500 fell -0.38% from Monday’s record high, while Treasury yields eased, reflecting a mild flight to safety.
Safe-haven demand surged, with spot gold breaking above $4,000/oz for the first time ever, extending a rally of more than 50% this year. Silver is also nearing record highs. The moves highlight growing investor anxiety over the macro backdrop, despite resilience in equities overall.
In tech news, AI-related headlines continued to dominate sentiment. Elon Musk’s xAI is reportedly expanding its funding round to $20 billion, with backing from Nvidia, reinforcing market enthusiasm around the AI theme. Meanwhile, Anthropic announced plans to open its first office in India, underscoring the sector’s global expansion.
For today, Nasdaq 100 traders will watch how the AI rally balances against broader risk aversion, with the FOMC minutes and Fed commentary later in the session likely to drive direction.
Key Support and Resistance Levels
Resistance Level 1: 25090
Resistance Level 2: 25200
Resistance Level 3: 25300
Support Level 1: 24730
Support Level 2: 24590
Support Level 3: 24460
This communication is for informational purposes only and should not be viewed as any form of recommendation as to a particular course of action or as investment advice. It is not intended as an offer or solicitation for the purchase or sale of any financial instrument or as an official confirmation of any transaction. Opinions, estimates and assumptions expressed herein are made as of the date of this communication and are subject to change without notice. This communication has been prepared based upon information, including market prices, data and other information, believed to be reliable; however, Trade Nation does not warrant its completeness or accuracy. All market prices and market data contained in or attached to this communication are indicative and subject to change without notice.

Rising Inflation Expectations Put the Fed’s Credibility to the T
Rising Inflation Expectations Put the Fed in a Tight Corner
The latest release of the U.S. Consumer Inflation Expectations came in hotter than anticipated, rising to 3.4% in September, compared with 3.2% previously and a 3.1% consensus. This seemingly small uptick carries significant weight. It suggests that American households increasingly believe inflation will stay elevated, posing a new challenge for the Federal Reserve, just weeks after its controversial decision to cut rates.
For a central bank whose credibility hinges on anchoring inflation expectations, this is a warning sign. Rising expectations imply that monetary policy may already be too loose relative to price pressures, leaving the Fed with little room to maneuver between supporting growth and restraining inflation.
What It Means for the Fed
The Fed’s recent hawkish cut, a 25-basis-point reduction paired with strong rhetoric on price stability, was designed to balance two mandates: sustaining a slowing labor market and restoring confidence in inflation control. But this new data complicates that message.
A move from 3.2% to 3.4% may seem modest, but it represents an unanchoring risk. Once inflation expectations drift upward, they tend to reinforce real inflation through wage negotiations, spending decisions, and business pricing. Historically, the Fed has treated such shifts as policy alarms, often responding with tighter stances or more cautious forward guidance.
If expectations continue to rise, markets may start questioning whether the Fed’s current stance is adequate. Instead of debating “how soon” the next cut will come, investors may pivot toward “whether the Fed can cut at all” in the near term.
Implications for U.S. Markets
The reaction in financial markets could be twofold:
Read full analysis on my website
darrismanresearch com