NAS 100 SHORT TRADEShort Nas100 on 15M TF. Alligator is pointing downwards with all Jaw, Teeth, Lips opened and aligned. Take 1:1 RR trade.
Trade ideas


US100 Will Go Down!
HI,Traders !
#US100 has made a retest
Of the horizontal resistance
Of 25169.1 and we are already
Seeing a bearish reaction so
We are bearish biased and
Therefore a local bearish
Pullback is to be expected !
Comment and subscribe to help us grow !

US100 To Make New ATH, Breakout From Range Expected on 1HUS100 can make a new All-Time-High if it breaks from this small range formed on 1H timeframe.
Nasdaq is in Bullish Momentum, and it looks like this new ATH is quite possible.
Let's take a 1:1 Buy-Stop trade here.
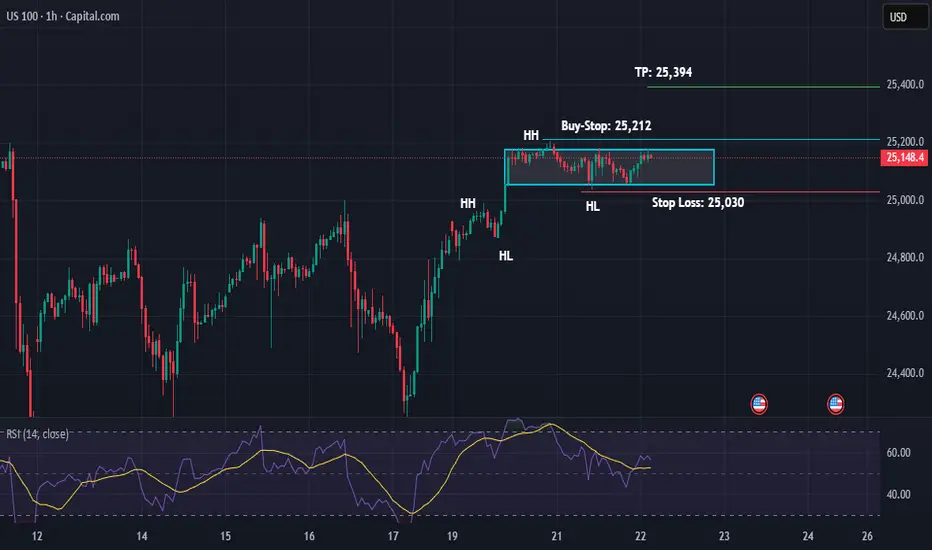
Scenario 2Scenario 2: Sideways 1H LTF, Bullish 4H HTF
Buy stop @ cambist red above (25208.8)
Risk 0.4%
R:R 1:1

US100 - LONG POSSIBILITYPrice is curently at at crucial point since it's sitting on a broke previous resistence zone which have a very high chance of being use as a support zone. This is purely ideas purpose only and should not be used alone to take on a trade. Good profits traders.
US NAS 100Preferably suitable for scalping and accurate as long as you watch carefully the price action with the drawn areas.
With your likes and comments, you give me enough energy to provide the best analysis on an ongoing basis.
And if you needed any analysis that was not on the page, you can ask me with a comment or a personal message.
Enjoy Trading ;)

Nas100 Trade Set Up Oct 22 2025Price has swept PDH and a daily BSL with a closure under leaving lots of SSL levels and daily FVG that i will target for sells after BSL being swept on the 15m

NQ SHORTShorting NQ from h4 ote anticipating wed reversal, no news today, short before the news , D crt third candle.

NSDQ100 Focus today on key tech earnings (Tesla, IBM, SAP)Tech stocks held steady yesterday, with the Nasdaq 100 little changed, as broader markets consolidated near record highs. The S&P 500 (+0.003%) and STOXX 600 (+0.21%) both hovered just below their recent peaks, while the 10yr US Treasury yield slipped to a one-year low of 3.96%, supporting equity valuations.
The session’s standout move came from commodities, where gold (-5.3%) and silver (-7.1%) suffered their sharpest single-day declines in years, despite lower yields that would normally support precious metals. The drop appeared to be a technical correction after gold’s exceptional rally this year (+57% YTD).
On the macro front, sentiment was mixed. The US government shutdown entered its 22nd day, now the second longest in history, with few signs of resolution as President Trump urged Senate Republicans to hold firm. Meanwhile, Trump’s comments on trade offered some optimism — he suggested talks with China’s Xi Jinping could produce a “good deal,” though a meeting remains unconfirmed.
In corporate news, Anthropic and Google are reportedly discussing a multi-billion-dollar cloud computing deal, underscoring ongoing AI infrastructure investment — a potential positive for large-cap tech sentiment. Conversely, Apple faced minor headwinds amid reports that its foldable iPad project has hit development delays.
Overall:
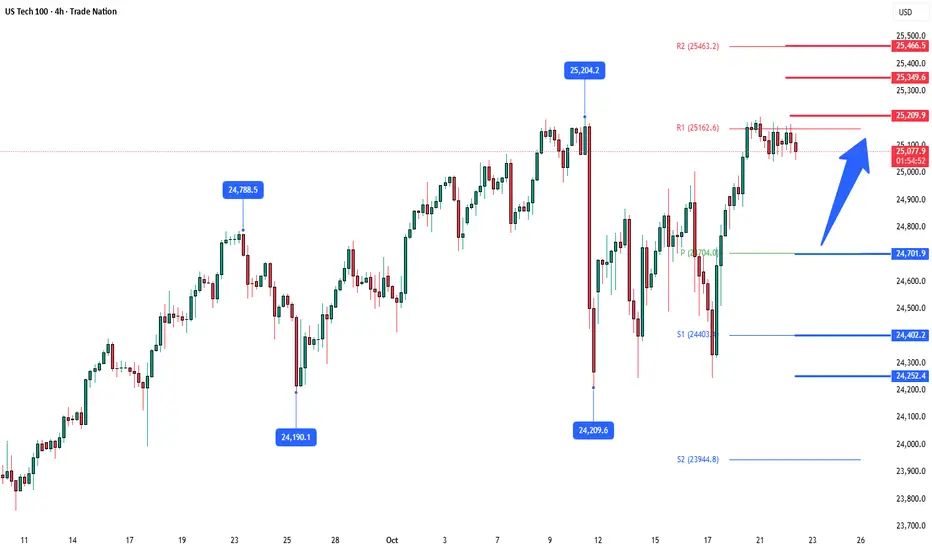
The Nasdaq 100 remained stable as investors balanced easing yields, positive AI-sector momentum, and uncertainty over the government shutdown. Focus today will turn to key tech earnings (Tesla, IBM, SAP) and macro data for directional cues.
Key Support and Resistance Levels
Resistance Level 1: 25200
Resistance Level 2: 25350
Resistance Level 3: 25466
Support Level 1: 24700
Support Level 2: 24400
Support Level 3: 24250
This communication is for informational purposes only and should not be viewed as any form of recommendation as to a particular course of action or as investment advice. It is not intended as an offer or solicitation for the purchase or sale of any financial instrument or as an official confirmation of any transaction. Opinions, estimates and assumptions expressed herein are made as of the date of this communication and are subject to change without notice. This communication has been prepared based upon information, including market prices, data and other information, believed to be reliable; however, Trade Nation does not warrant its completeness or accuracy. All market prices and market data contained in or attached to this communication are indicative and subject to change without notice.
selling offHigh risk low reward entry as price is showing of signs of slowing down it is still bullish. looking at the previous HTF HL areas are target places.

Nasdaq Faces Bearish Correction Below 25,180 After Recent HighsUSNAS100 | Overview
The Nasdaq is showing signs of bearish correction after stabilizing below 25,180, suggesting a potential pullback toward 25,035.
A 1H close below 25,035 would confirm further downside toward 24,960 → 24,860.
On the other hand, stability above 25,035 would support renewed bullish momentum, especially if price breaks 25,230, opening the way toward 25,400 and potentially 25,550.
Pivot Line: 25,180
Support: 25,035 · 24,960 · 24,860
Resistance: 25,300 · 25,400 · 25,550

$NDX Make or BreakNDX is consolidating in a triangle, and is now re-test 25200 strong level.
Inability to break above the triangle should see a break below the triangle and a move down to 24700 first.

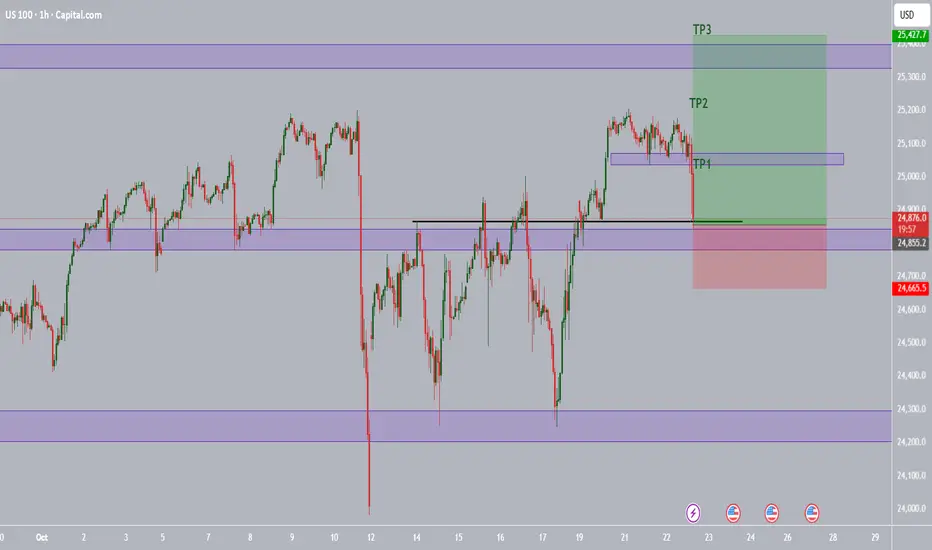
NAS100 Bullish Trend ContinuationOne of two things will happen for Nasdaq today; we will either get our entries for longs in the current support zone or in demand. The latter seems higher probability.
But either way, the uptrend will resume as price continues to claim new All Time Highs.
If the current support continues to hold throughout NYSE, then perhaps wait for resistance to break and some follow-through to get higher probability entries.
NASDAQ Short There is a lot of resistance, as it is at an all-time high and is unable to break this level
There are 2 patterns on M15 and M30 showing a potential reversal zone
This is against the H4 trend; however, it is overbought on H1
RSI is showing strong divergence with a triple top on H1
Stoploss above 21300
First target 24870 or when M15 is oversold

21 OCT 2025: US100 MARKET RECAPNOT A DAY FOR THE FAINT HEARTED
Study through the consolidation!
DISCLAIMER:
The owner of this page is an authorised Representative under supervision of TD MARKETS (PTY) LTD, an authorised Financial Services Provider (FSP No. 49128) licensed by the Financial Sector Conduct Authority (FSCA) under the Financial Advisory and Intermediary Services Act (FAIS).
The FSP is licensed to provide advice and intermediary services in respect of Category I financial products, including but not limited to derivative instruments, long-term deposits, and short-term deposits.
All investment ideas are provided in accordance with the scope of the FSP's license and applicable regulatory requirements. Derivative instruments is a leveraged products that carry high risks and could result in losing all of your capital, and past performance is not indicative of future results.
This idea and any attachments are informational/education and does not constitute a recommendation to buy/sell.
No guarantee is made regarding the accuracy or outcome of this trade idea.
If you choose to accept this idea, please do so at your own risk.

NASDAQ100. HIGH PROBABILITY SETUP SOON!!!🚨 NAS100 HIGH PROBABILITY SELL SETUP 🚨
* Here We Can See Clearly The Next Potential Moves For US100 Coming Hours/Days.
* Keep Your Eyes Close On Your Trading Positions.
* Happy PIP Hunting Traders.
FXKILLA.

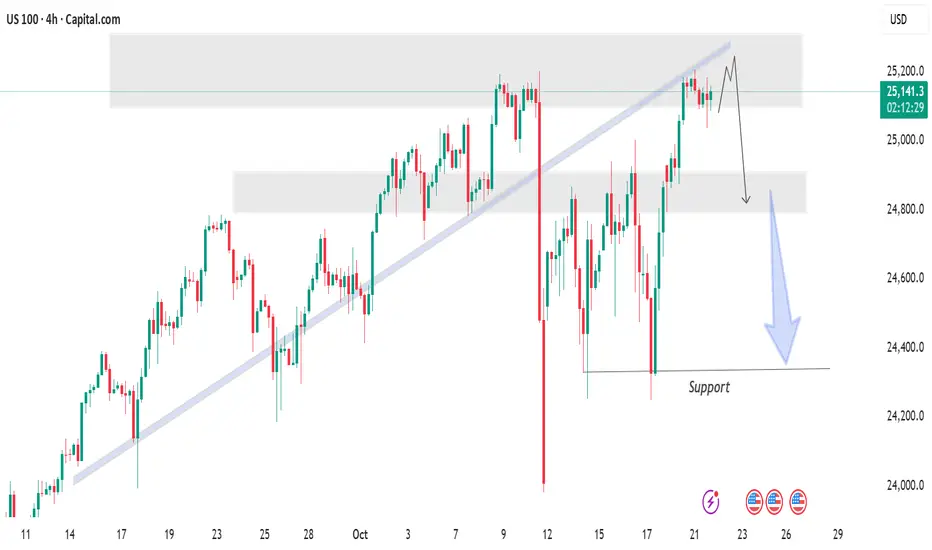
US100 ForecastUS100 highlights a potential bearish setup forming near a key resistance zone. After a strong recovery toward the 25,150–25,200 region, price action shows signs of rejection at the upper resistance area. The chart illustrates a possible pullback scenario, where the index may retest the 24,800 zone, followed by a deeper move toward the 24,400 support level.
The shaded areas mark supply (resistance) and demand (support) zones, while the trendline break suggests weakening bullish momentum. Overall, the setup signals a potential trend reversal if the price fails to hold above the resistance region.
"Thank you for your support! If you found this idea valuable or learned something new, please consider liking and leaving a comment. I’d really appreciate hearing your feedback and thoughts
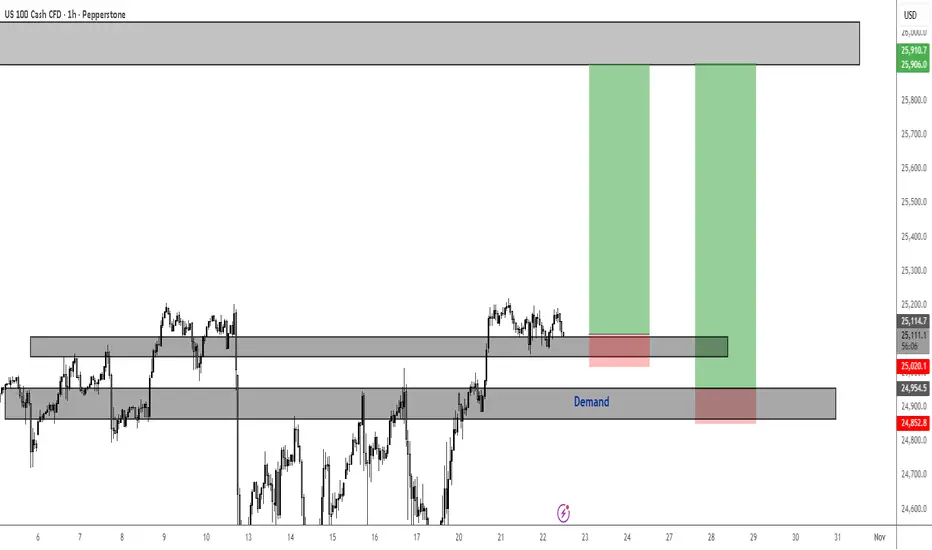
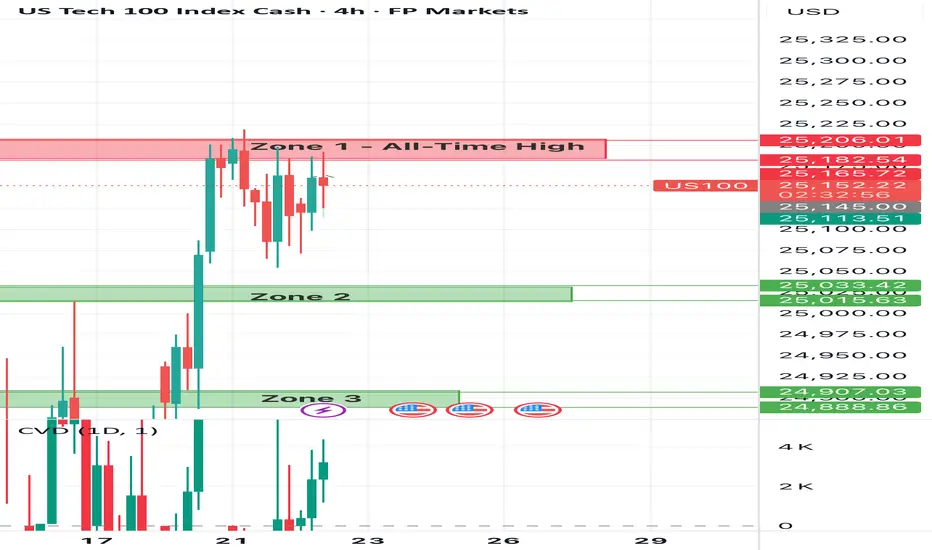
US100 on the Edge – Will Bulls Finally Break the All-Time HighZone 1: All-Time High / Major Supply Zone
This area represents the top of the market structure and the current all-time high region. Price has tested this level multiple times, forming a tight consolidation directly beneath it. This behavior indicates strong buying pressure but also clear absorption from sellers. Until the market shows a decisive breakout with volume confirmation, this zone acts as a heavy supply level. Traders should be cautious — breakouts near all-time highs often trigger fake moves before continuation.
Zone 2: Short-Term Demand / Breakout Retest Zone
Zone 2 marks the first layer of demand formed after the most recent breakout attempt. Buyers have consistently stepped in here to defend structure, suggesting it’s a valid short-term support area. If price remains above this level, the bullish structure remains intact. However, a clean break below Zone 2 would likely open the door for a retracement toward Zone 3.
Zone 3: Strong Demand / Breakout Base
This zone represents the base of the breakout — Monday’s low — where buyers aggressively entered and drove price upward through prior resistance. It’s a key liquidity pocket and the foundation of the current move. As long as the market holds above this zone, the bullish bias remains valid. A break below, however, would signal that momentum has faded and could trigger a deeper correction.
Sentiment
After a strong start to the week, the Nas100 is trading with a tone of cautious optimism. Monday’s momentum carried into Tuesday as easing US–China trade tensions and solid performances from major tech names helped maintain positive sentiment. However, with the index hovering near record highs, investors have turned more selective and defensive.
The broader market tone remains constructive — risk appetite is still present, but confidence is fragile. Many traders are waiting for fresh catalysts from corporate earnings and macro data to confirm whether the recent rally has more room to run. The ongoing US government shutdown continues to cloud visibility, delaying key data releases and adding an element of uncertainty.
Overall, sentiment around the Nas100 is positive but tentative: the market is stable and supported by tech strength and improved trade signals, yet stretched valuations and the lack of new macro clarity keep investors cautious at the top.
20 OCT 2025: US100 MARKET RECAPSTUDY!!
WELCOME TO MY ONLINE JOURNAL
DISCLAIMER:
The owner of this page is an authorised Representative under supervision of TD MARKETS (PTY) LTD, an authorised Financial Services Provider (FSP No. 49128) licensed by the Financial Sector Conduct Authority (FSCA) under the Financial Advisory and Intermediary Services Act (FAIS).
The FSP is licensed to provide advice and intermediary services in respect of Category I financial products, including but not limited to derivative instruments, long-term deposits, and short-term deposits.
All investment ideas are provided in accordance with the scope of the FSP's license and applicable regulatory requirements. Derivative instruments is a leveraged products that carry high risks and could result in losing all of your capital, and past performance is not indicative of future results.
This idea and any attachments are informational/education and does not constitute a recommendation to buy/sell.
No guarantee is made regarding the accuracy or outcome of this trade idea.
If you choose to accept this idea, please do so at your own risk.

NASDAQ 100 MID-WEEK OPINION SHARING by MrPhotonIt still hasn't broken the all-time high level. In line with the latest news, I expect a 2%-2.3% correction in the first stage. If the price breaks the uptrend channel and falls below 24300, it is likely to consolidate IG:NASDAQ .

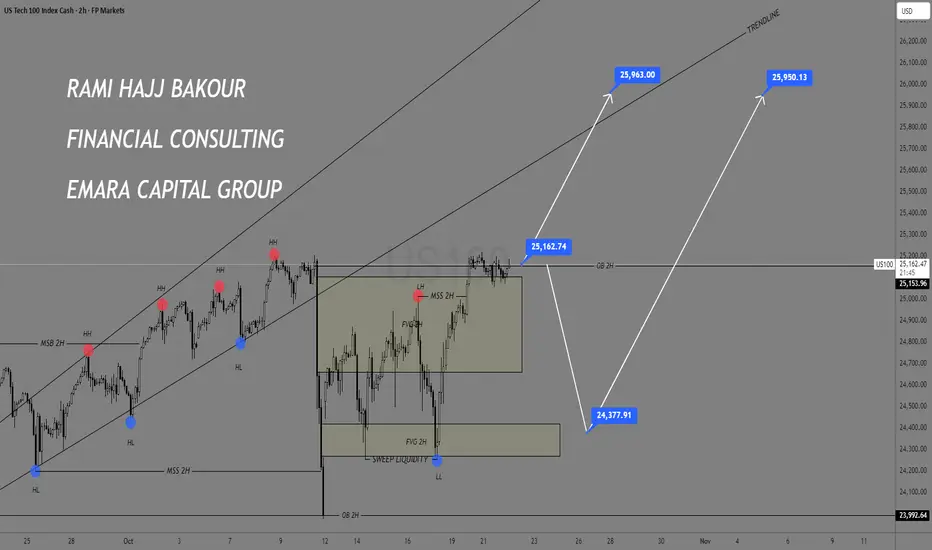
NASDAQ 100 (US100) Technical Analysis
The Nasdaq is moving within a rising channel on the 2H timeframe, after sweeping liquidity from previous lows and rebounding from the FVG 2H demand zone.
The likely scenario is a continuation of the bullish move toward 25,960 – 26,000, aligning with the upper trendline and potential resistance area.
However, a failure to hold above 25,160 may trigger a corrective pullback toward 24,380 before any renewed bullish momentum.
📊 Fundamental Outlook:
The Nasdaq remains supported by stable U.S. bond yields and easing Fed tightening expectations, along with positive earnings from major tech firms.
However, slower growth in parts of the tech sector and upcoming inflation data could temporarily limit further upside momentum.
📅 Short-term Bias: Bullish
🎯 Upside Targets: 25,960 – 26,000
📉 Pullback Target: 24,380
⛔ Invalidation Level: Below 23,990
#US100 #NASDAQ #TechnicalAnalysis #EmaraCapital #Rami_Hajj_Bakour #Trading #Markets
Bearish outlook on nasdaq Price to put the previous engineered liquidity, I would expect to see price fall lower to take out the origin of the move that went to take out the engineered bearish liquidity
