US30 Approaches 47,200 Support as Seasonality Favors Bulls!Hey Traders,
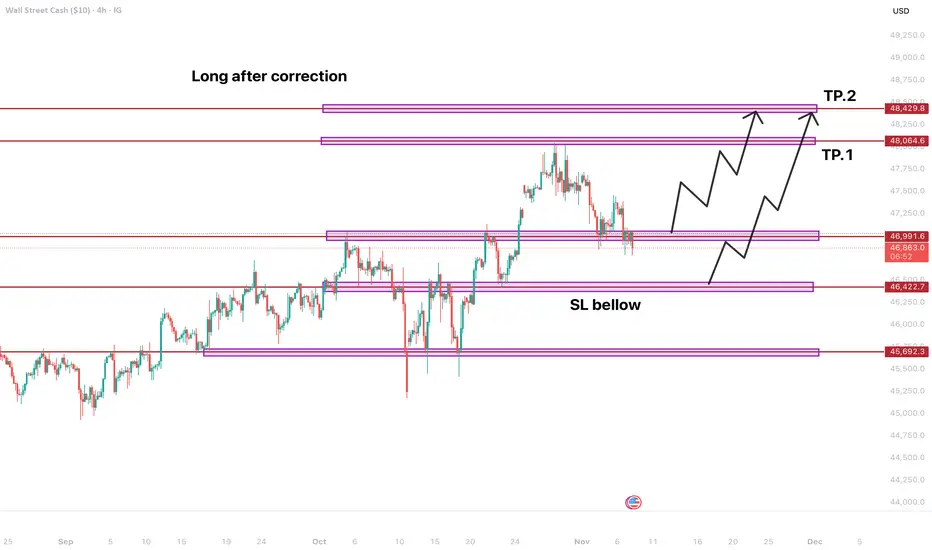
In today’s session, we’re monitoring US30 for a buying opportunity around the 47,200 zone. The Dow Jones remains in a broader uptrend and is currently in a correction phase, approaching a key support and resistance area at 47,200.
We’d also like to highlight the strong seasonal tenden

US 30 should soon to go upafter a healthy correction US 30 should make new highs.
Already according with levels of support we have to be careful when 'Market Makers" will start to buy the dip
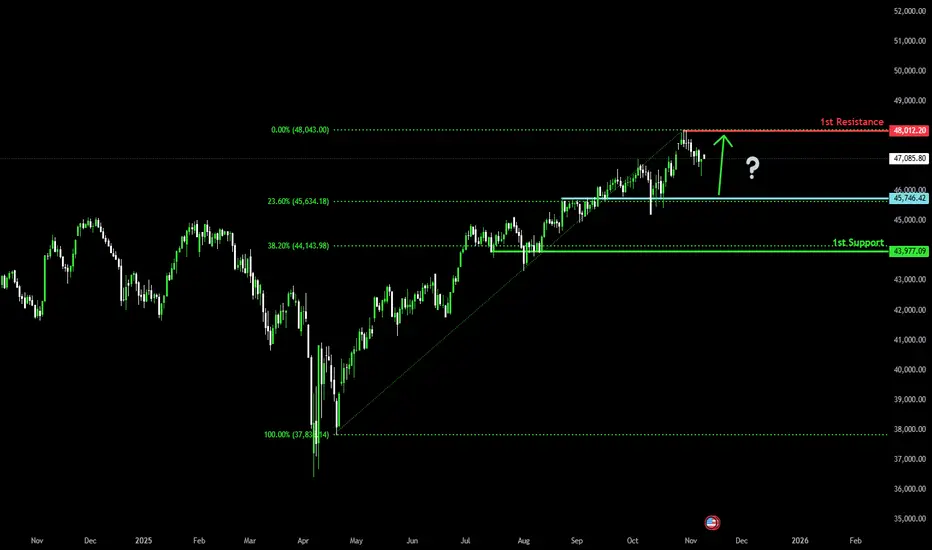
Bullish continuation setup?The Dow Jones (US30) is declining toward the pivot level, which is an overlap support aligned with the 23.6% Fibonacci retracement. A potential rebound toward the recent swing high resistance could occur from this area.
Pivot: 45,746.42
1st Support: 43,977.09
1st Resistance: 48,012.20
Disclaimer
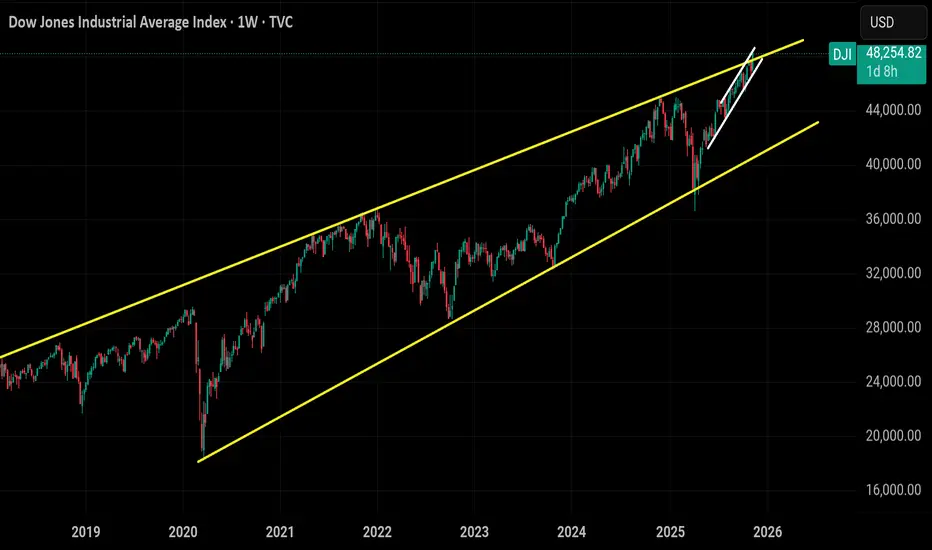
Dow jonesChart is self evident but let me explain.
Top of weekly channel 5yr resistance
(YELLOW)
Top of tariff rebound channel
(WHITE)
Outside weekly and daily bollingerband
Basically we are at extreme resistances really overbought.. imagine trying to break through something while being low on
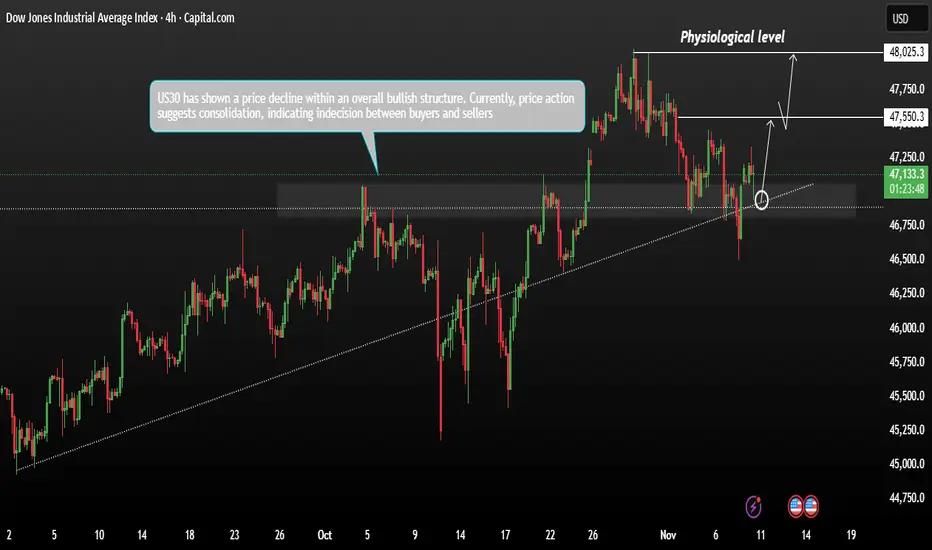
US30 Price decline within an overall bullish structureUS30 has shown a price decline within an overall bullish structure. Currently, price action suggests consolidation, indicating indecision between buyers and sellers. the index has pulled back but remains above key support zones, suggesting the potential for a rebound toward recent swing-high resista
Market correction, filling gaps and money shiftIt is expected and have been waiting for it for few weeks.
the market needs to correct itself by:
- Institutions and large funds (market makers) to exit from high tech AI and overvalued stocks and leave them to bag holders.
- They already shorted the large AI stocks so they will make money anyway.
-

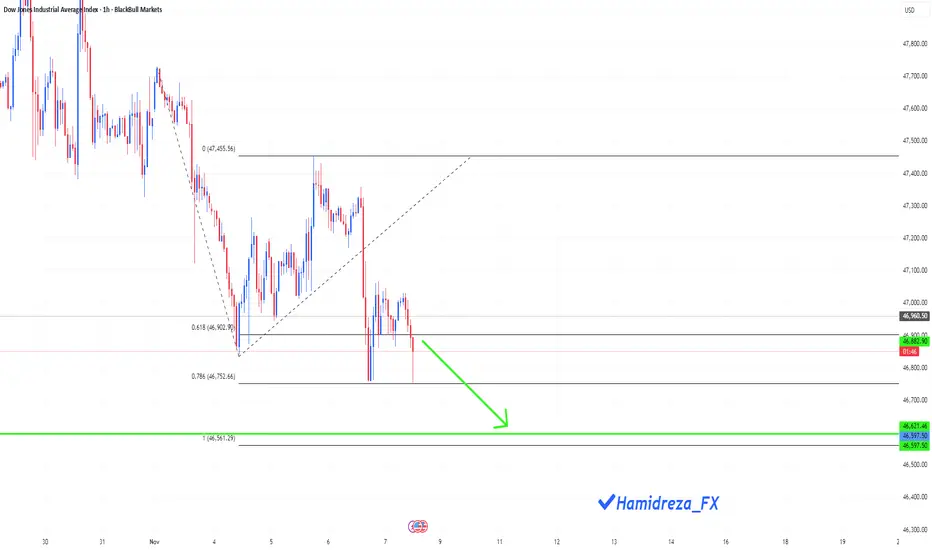
Could the Dow Jones continue to correct?
Hi everyone
I think if the 78.6 Fibonacci level is broken, we will probably reach the 1 Fibonacci level.
Do you think it is possible?
what do you think?
DOW JONES HIGH PROBABILITY SETUPS SOON!!!🚨 DOW30 HIGH PROBABILITY SELL/BUY SETUP 🚨
* Here We Can See Clearly The Next Potential Moves For US30 Coming Hours/Days.
* Keep Your Eyes Close On Your Trading Positions.
* Happy PIP Hunting Traders.
FXKILLA.

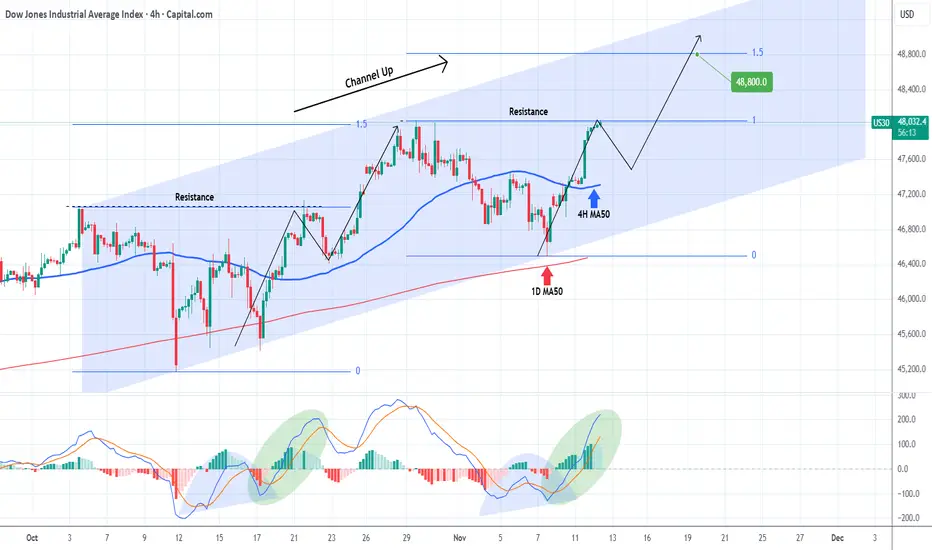
DOW JONES to new All Time Highs and won't stop there!Dow Jones (DJI) has been trading within an aggressive Channel Up since October 03, which made today a new All Time High (ATH). This is its technical Bullish Leg following the Higher Low bottom near the 1D MA50 (red trend-line).
With a 4H MACD sequence identical to the previous Leg, it is possible t
US30 – Buyers Defend Pivot | Holding 47080 Keeps Trend IntactUS30 – MARKET OUTLOOK | Bullish Bias Above 47080
US30 continues to trade with a bullish tone while holding above 47080, supported by stronger sentiment across U.S. equities.
Above 47080: Bullish continuation toward 47300 → 47460 → 47760.
Below 47080: Bearish correction possible toward 46910 → 4

See all ideas
Displays a symbol's price movements over previous years to identify recurring trends.
Frequently Asked Questions
Dow Jones Industrial Average Index reached its highest quote on Oct 29, 2025 — 48,045.45 USD. See more data on the Dow Jones Industrial Average Index chart.
The lowest ever quote of Dow Jones Industrial Average Index is 18,197.60 USD. It was reached on Mar 22, 2020. See more data on the Dow Jones Industrial Average Index chart.
Dow Jones Industrial Average Index is just a number that lets you track performance of the instruments comprising the index, so you can't invest in it directly. But you can buy Dow Jones Industrial Average Index futures or funds or invest in its components.