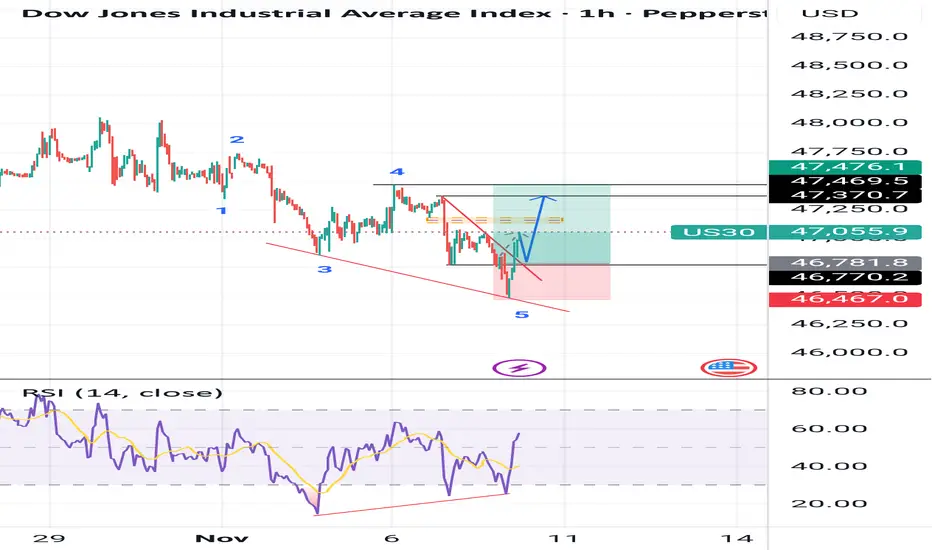
US 30Preferably suitable for scalping and accurate as long as you watch carefully the price action with the drawn areas.
With your likes and comments, you give me enough energy to provide the best analysis on an ongoing basis.
And if you needed any analysis that was not on the page, you can ask me with a comment or a personal message.
Enjoy Trading ;)
Trade ideas

US30 LONG SETUP Price is trading on a downward channel which makes this trade a high risk trade. Find entries on 47.5... or lower

DOW JONES INDUSTRIAL HIGH PROBABILITY SETUP SOON!!!🚨 DOW30 HIGH PROBABILITY BUY SETUP 🚨
* Here We Can See Clearly The Next Potential Moves For US30 Coming Hours/Days.
* Keep Your Eyes Close On Your Trading Positions.
* Happy PIP Hunting Traders.
FXKILLA.

US30 Risky Short!
HI,Traders !
#US30 is growing now
But a horizontal resistance
Level of 47513.8 from where
We will be expecting a local
Pullback and a local move down !
Comment and subscribe to help us grow !

US30 H4 | Bullish Bounce Off OBUS30 is having a temporary correction towards the downside. However, there is a Fair Value Gap and Order Block present, which could cause price to bounce from that area.
Our buy entry is in between the FVG and OB, at 46,883, which also aligns with the 75% FIbonacci retracement level.
The stop loss is at 46,509, which is at the swing low support level, while the take profit is at 47,460, which is at the pullback resistance level.
Stratos Markets Limited (tradu.com/uk ):
CFDs are complex instruments and come with a high risk of losing money rapidly due to leverage. 68% of retail investor accounts lose money when trading CFDs with this provider. You should consider whether you understand how CFDs work and whether you can afford to take the high risk of losing your money.
Stratos Europe Ltd (tradu.com/eu ):
CFDs are complex instruments and come with a high risk of losing money rapidly due to leverage. 70% of retail investor accounts lose money when trading CFDs with this provider. You should consider whether you understand how CFDs work and whether you can afford to take the high risk of losing your money.

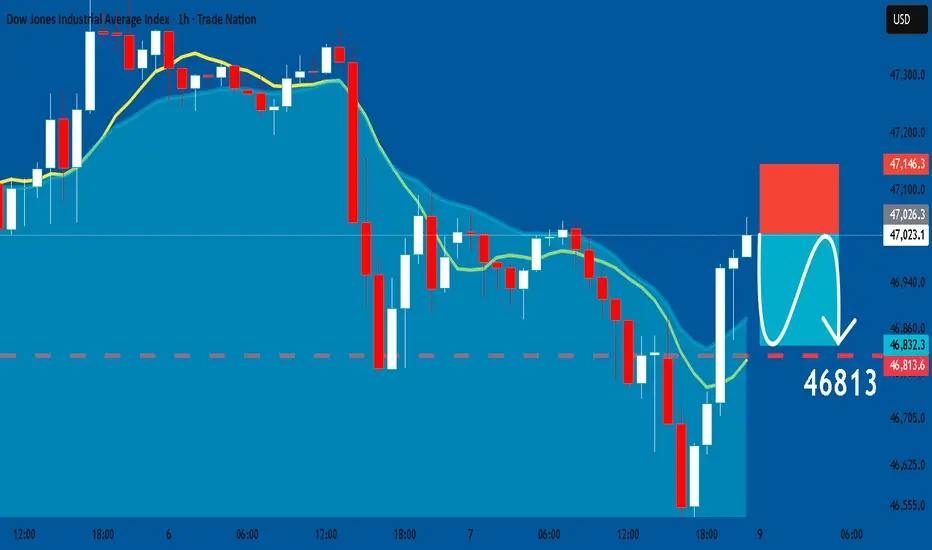
US30: Short Signal Explained
US30
- Classic bearish pattern
- Our team expects retracement
SUGGESTED TRADE:
Swing Trade
Sell US30
Entry - 47023
Stop - 47146
Take - 46813
Our Risk - 1%
Start protection of your profits from lower levels
Disclosure: I am part of Trade Nation's Influencer program and receive a monthly fee for using their TradingView charts in my analysis.
❤️ Please, support our work with like & comment! ❤️
DJI : Starting from ZEROIt has been some time since I published the last DJI idea.
Anyway, price now is at the extreme and it is quite RARE that I have to start from ZERO - the beginning of EVERYTHING.
If this is the case, when I can clearly see the BEGINNING, then surely I can also see the END, with a DOUBLE 'D'.
It might just follow the previous drop of 38.2%
The probability is very good.
Good luck.

US30 : Bulls Regaining Control!After a clean correction, US30 (Dow Jones) looks set for another push upward. If structure holds, we could see momentum building toward new highs before the next potential pullback. Stay alert for confirmation around 47,400–47,600 levels!
Disclosure: We are part of Trade Nation's Influencer program and receive a monthly fee for using their TradingView charts in our analysis.

US30 Technical Breakdown – 11/04/2025📍 US30 Technical Breakdown – 11/04/2025
US30 faced heavy selling pressure after rejecting the 48,000 psychological resistance 🚫 The index has been in a steady decline since, currently sitting near 46,950, testing the mid-range structure support 👀
📊 Market Behavior:
🔹 Clean rejection from 48,000 → clear short-term shift in sentiment
🔹 Price trading below both EMAs → momentum favoring sellers
🔹 47,000 area acting as temporary support — watch for a bounce or breakdown
📌 Key Levels:
🔹 Resistance Zones:
47,400 → intraday EMA resistance
47,700 → lower high zone
48,000 → key breakout barrier
🔹 Support Zones:
46,900 → current structure support
46,520 → major demand area
46,000 → deeper correction level
🧠 Bias:
Short-term bearish ⚠️
➡️ Below 46,900 → sellers in control
⬆️ Break above 47,400 → potential reversal zone
US30 Eyes 47,200 for Potential BounceHey Traders, in today’s trading session we’re monitoring US30 for a potential buying opportunity around the 47,200 zone.
The Dow Jones continues to trade in a broader uptrend, and price action is currently in a correction phase, approaching the 47,200 support and resistance confluence area — a key zone where buyers may look to step back in.
Watching for a bullish reaction at this level to confirm continuation of the prevailing trend.
Share your view below — do you think US30 holds this zone or breaks lower?
Trade safe,
Joe.

us30Dow Jones on the 4H timeframe is moving in a downtrend in my view. Based on the data on the chart, it’s time for a correction. The price may rise to the highlighted area 1 hour timeframe before continuing the corrective targets shown on the chart, or it may complete the correction around the 50% Fibonacci retracement level. It’s unlikely to rise beyond that level."

US30 Technical Breakdown – 11/06/2025📍 US30 Technical Breakdown – 11/06/2025
US30 is showing some early signs of stabilization after yesterday’s dip 🔄 Buyers stepped in near 47,000 to defend key support, pushing price slightly above EMAs — hinting at a potential short-term recovery.
📊 Market Behavior:
🔹 Rejection from 48,000 still holding strong
🔹 Bounce from 47,000 → short-term higher low forming
🔹 EMAs flattening → indecision phase before next move
📌 Key Levels:
🔹 Resistance:
47,400 → intraday EMA cap
47,650 → minor supply zone
47,900–48,000 → key psychological resistance
🔹 Support:
47,000 → major short-term demand
46,520 → strong structure level
45,550 → key swing low zone
🧠 Bias:
Neutral to mildly bullish ⚖️
⬆️ Above 47,400 → potential push toward 47,650–47,900
⬇️ Below 47,000 → momentum shifts back to bears
US30 Trade Set Up Nov 4 2025Price pushed down hard during Asia and London and is making bearish structure so i will be looking for sells either after a sweep of BSL and tap into 4h FVG or if we invert this 15m FVG with a retest i will take sells down to SSL/London lows and lower 4h FVG

US30 BUY WITH LIMIT ORDER!!!!!US30 made a strong rejections off the order block zone am going to be positioning for a buy entry on the pull back in the inside bar candle on the buy zone i marked....

DOW JONES HIGH PROBABILITY SETUPS SOON!!!🚨 DOW30 HIGH PROBABILITY SELL/BUY SETUP 🚨
* Here We Can See Clearly The Next Potential Moves For US30 Coming Hours/Days.
* Keep Your Eyes Close On Your Trading Positions.
* Happy PIP Hunting Traders.
FXKILLA.

US30 LONG SETUP Price is looking to test 48.000 again after a strong correction that pushed it back to 47. region. Healthy support around 47 has been met on point with the 50% fib level. Strong push back to 48 is promising.
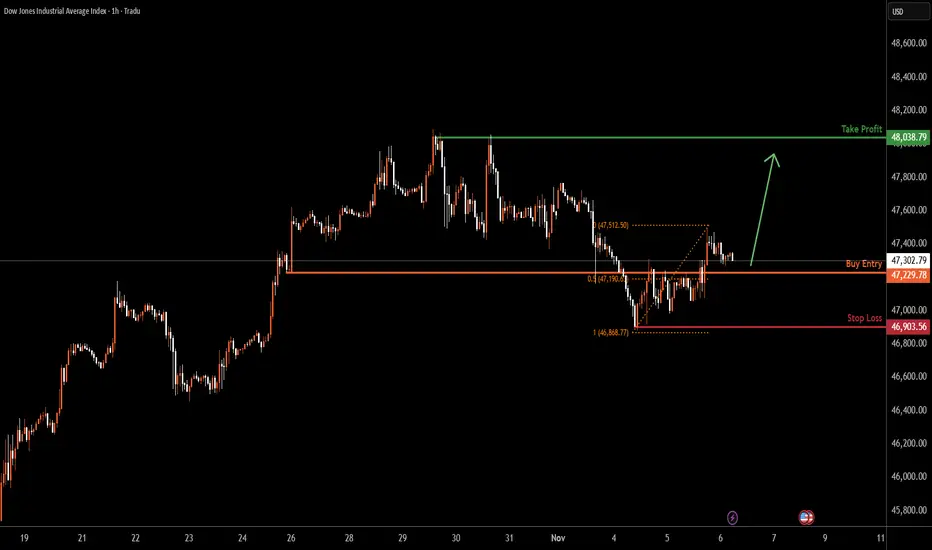
US30 H1 | Bullish Bounce Off 50% Fibonacci SupportUS30 is falling towards the buy entry at 47,229.78, whichis an overlap support that aligns witht he 50% Fibonacci retracement and could bounce from this level to the upside.
Stop loss is at 46,903.56, which is a swing low support.
Take profit is at 48,038.79, which is a multi swing high resistance.
Stratos Markets Limited (tradu.com ):
CFDs are complex instruments and come with a high risk of losing money rapidly due to leverage. 68% of retail investor accounts lose money when trading CFDs with this provider. You should consider whether you understand how CFDs work and whether you can afford to take the high risk of losing your money.
Stratos Europe Ltd (tradu.com ):
CFDs are complex instruments and come with a high risk of losing money rapidly due to leverage. 70% of retail investor accounts lose money when trading CFDs with this provider. You should consider whether you understand how CFDs work and whether you can afford to take the high risk of losing your money.
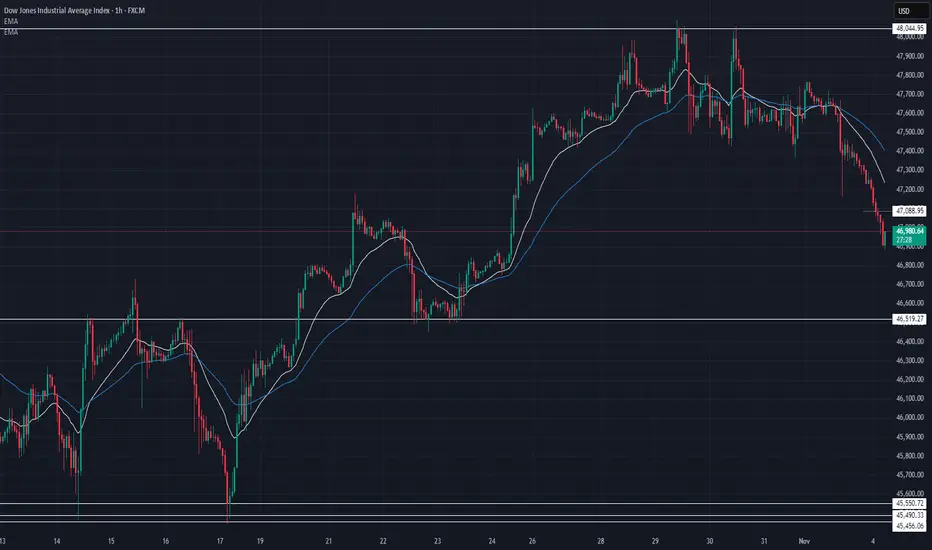
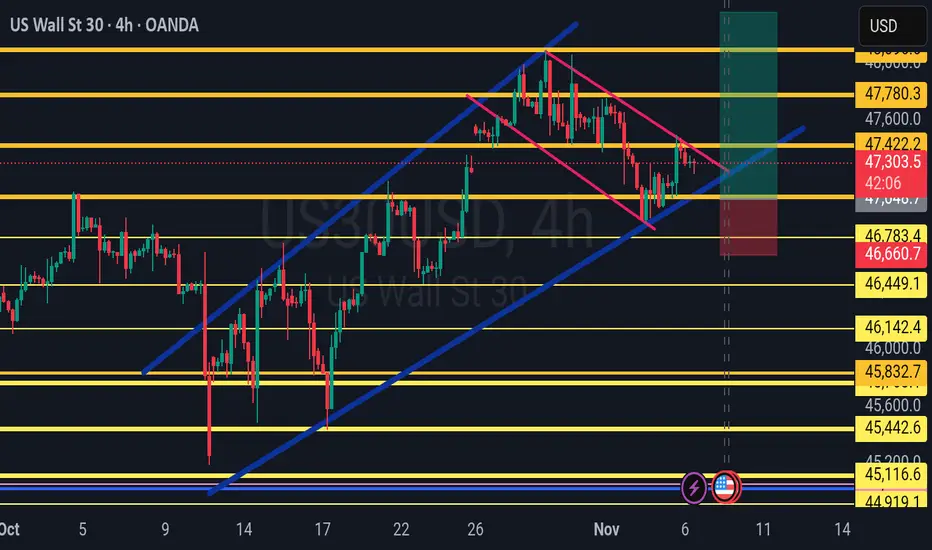
DowJones - Pullback or Reversal?Key Support and Resistance Levels
Resistance Level 1: 47433
Resistance Level 2: 47534
Resistance Level 3: 47636
Support Level 1: 46807
Support Level 2: 46690
Support Level 3: 46545
This communication is for informational purposes only and should not be viewed as any form of recommendation as to a particular course of action or as investment advice. It is not intended as an offer or solicitation for the purchase or sale of any financial instrument or as an official confirmation of any transaction. Opinions, estimates and assumptions expressed herein are made as of the date of this communication and are subject to change without notice. This communication has been prepared based upon information, including market prices, data and other information, believed to be reliable; however, Trade Nation does not warrant its completeness or accuracy. All market prices and market data contained in or attached to this communication are indicative and subject to change without notice.
Dow Jones Indus (US30)Price has completed a clean sweep of sell-side liquidity and is now showing strong displacement toward the upside. The recent break in structure confirms short-term bullish intent.
If price returns to the fair value gap or discount zone, I’ll look for confirmation to enter in alignment with the intraday bullish flow.
My first target remains the internal liquidity zone, and the potential extended target is the previous day’s high where buy-side liquidity rests.

BUY NOW US30!!!!!US30 made a strong price rejections off my poi after a wild moves in the market yesterday am looking forward to see price made a strong pull back up to 48k trend is still bullish we just closed a gap without taking out our internal structure lows....

$DJIDJI is showing signs of weakness we may be entering a correction phase.
With the government searching for capital to “keep America great,” it’s coming at a big cost.
We could see a sell-off of weaker assets to clear the path for the next bullish wave in 2026. 📉➡️📈

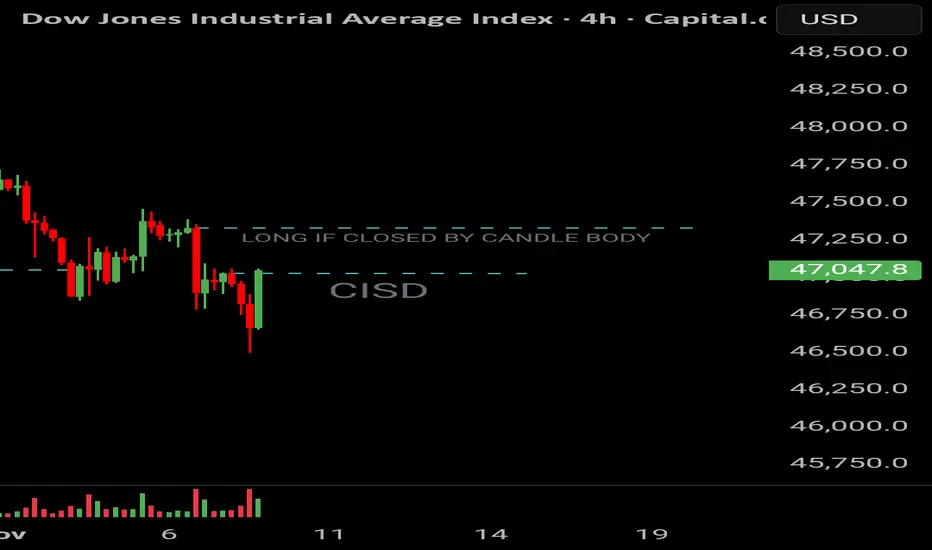
Possible entryWe can see that the price may go up if closed with the body in that upper line ( by my strategy).