AUDCHF- Sell SetupKey Support Zone: 0.52102 – 0.52077
Entry: Break below the support zone
Take Profit 1: 0.520
Take Profit 2: 0.517
NOTE:Waiting for price to break key support with confirmation before selling.
Trade ideas

AUDCHF Selling?AUFCHF is consolidating as of now, it can break down side and give a trend continuation move towards low!!

Sell AUDCHFAUDCHF sell idea. This Tuesday, AUDCHF presents a bearish flag pattern. Price still hovers at the resistance, great time to enter as it reduces the stop loss margin.

SHORTS on AUDCHFLooking for downside pressure. Rejecting of the 61.8 with a break of a Counter Trendline. 5R trade.
**NOT A SIGNAL**

AUDCHF (SWING) - BEARISH TRADE IDEAHi there,
I'm of the opinion that Q3 would print a bearish candlestick as the momentum has been bearish.
As annotated on the chart, I expect the Accumulation, Manipulation and Distribution (AMD) to play out. If that happens, we'd see August print a bearish outside candle.
However, I'd only take a trade if I see my setup in my zone of interest.
Do have a wonderful trading week.
Cheers,
Jabari

AUD/CHF BEARS WILL DOMINATE THE MARKET|SHORT
Hello, Friends!
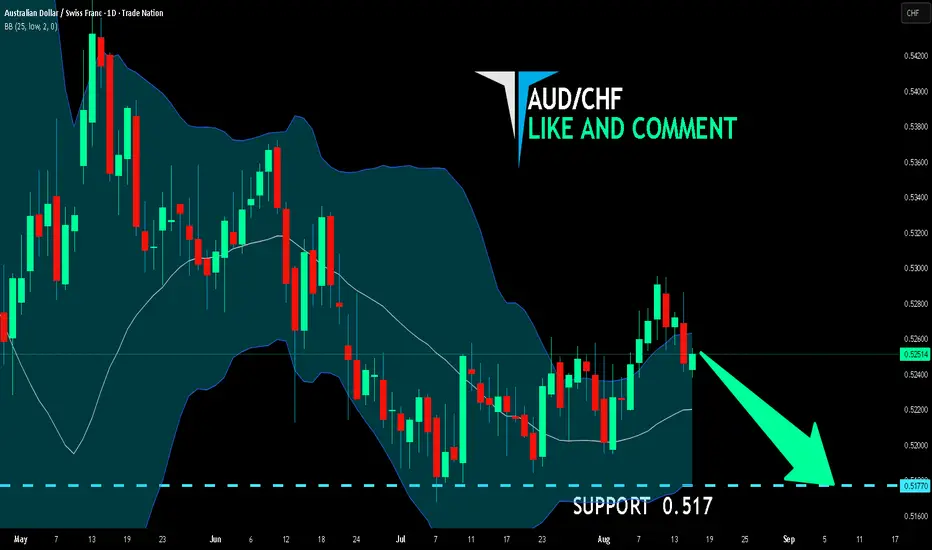
We are targeting the 0.515 level area with our short trade on AUD/CHF which is based on the fact that the pair is overbought on the BB band scale and is also approaching a resistance line above thus going us a good entry option.
Disclosure: I am part of Trade Nation's Influencer program and receive a monthly fee for using their TradingView charts in my analysis.
✅LIKE AND COMMENT MY IDEAS✅

AUDCHF BUY LIMIT This occurs across all pairs, but patience is required as the setup develops.
1. Daily liquidity sweep
2. Change of Character (CHoCH) on the H1 timeframe; can also align with H4–M15, D1–H1, or W–H4
3. Zone of Interest (from master class concepts)
4. Target: the next liquidity level

AUDCHF--Head and Shoulder--yearly ,monthly,weekly bearish
--entry zone and tp levels are as shown on chart

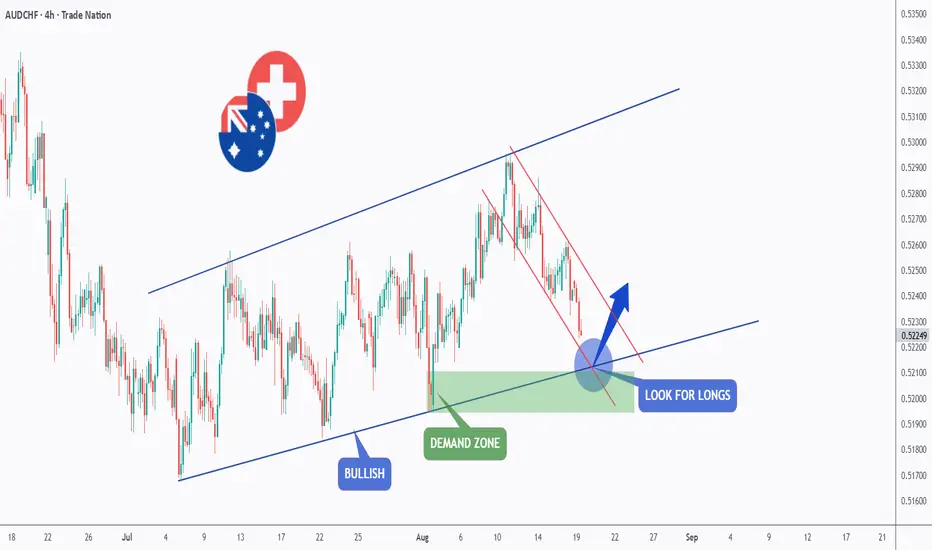
AUDCHF – Bulls Preparing for a Comeback?AUDCHF has been trading inside a broad ascending channel, showing a clear bullish structure. Recently, price pulled back within a corrective descending channel and is now approaching a key demand zone aligned with the lower bound of the channel.
🔎 If buyers step in here, we could see a potential reversal and continuation of the overall bullish trend.
👉 Plan: Look for long opportunities as price reacts around the demand zone and channel support.
📚 Always follow your trading plan regarding entry, risk management, and trade management.
Good luck!
All Strategies Are Good; If Managed Properly!
~Rich
Disclosure: I am part of Trade Nation's Influencer program and receive a monthly fee for using their TradingView charts in my analysis.
AUD/CHF BEST PLACE TO SELL FROM|SHORT
Hello, Friends!
AUD/CHF is making a bullish rebound on the 1D TF and is nearing the resistance line above while we are generally bearish biased on the pair due to our previous 1W candle analysis, thus making a trend-following short a good option for us with the target being the 0.517 level.
Disclosure: I am part of Trade Nation's Influencer program and receive a monthly fee for using their TradingView charts in my analysis.
✅LIKE AND COMMENT MY IDEAS✅

Indicators Galore!!!Super easy to understand. Follow curser and copy the indicators in your chart.
Good luck


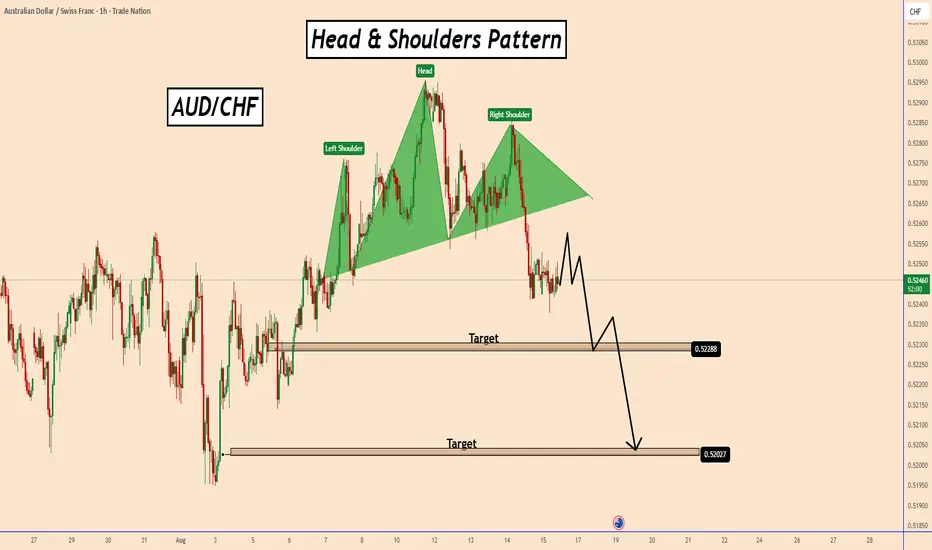
AUDCHF: Head & Shoulders Pattern Signals Bearish PotentialAUDCHF: Head & Shoulders Pattern Signals Bearish Potential
AUDCHF has completed a well-defined Head & Shoulders pattern, suggesting a potential bearish continuation. The neckline breakout reinforces the likelihood of downward momentum.
Volume remains low today.
With the European markets closed, directional conviction is likely to be muted until later in the U.S. trading session.
Key Levels to Watch:
If bearish pressure resumes, 0.5225 and 0.5200 are the next downside targets.
These levels may be reached during the U.S. session or in the coming days, depending on volume pickup and risk sentiment.
You may find more details in the chart!
Thank you and Good Luck!
PS: Please support with a like or comment if you find this analysis useful for your trading day
Disclosure: I am part of Trade Nation's Influencer program and receive a monthly fee for using their TradingView charts in my analysis.
IS AUDCHF IN BULLISH MOOD?Falling Wedge Pattern (Bullish Reversal):
** The price recently broke out of a falling wedge (highlighted in the gray zone), which is a bullish reversal pattern.
** This breakout is confirmed with a decent bullish candle.
Bullish Divergence (RSI):
** The RSI at the bottom shows a bullish divergence (price made lower lows, but RSI made higher lows).
This supports the bullish idea.
Support and Resistance Zones:
** Price found strong support around 0.52435 (horizontal blue line).
** The next resistance is around 0.52730–0.52800 zone (gray box above current price), which is the potential target.
Momentum Indicators:
** RSI is currently around 58 — not overbought, which gives room for price to move up.

AUDCHF - Head and ShouldersHello Traders!
The AUDCHF price formed a head and shoulders pattern.
Currently, the neckline is broken!
So, i expect a bearish move📉
____________
TARGET: 0.52050🎯

AUDCHF: Breaks Below Ascending TrendlineMy observations across the Daily (D1) and Hourly (H1) timeframes.
D1 timeframe:
My EMA20 is below the EMA 60. Price has ranged a bit longer than I anticipated, but we are now getting the indication that the downtrend is continuing.
Price is also below EMA20, which helps to signal momentum is picking up.
H1 Timeframe:
After price crossed below the daily ascending trendline, it stalled and then pulled back up. To some, this is a fakeout. To others, this is a liquidity trap.
I remained patient and found an opportunity to enter on the longer bearish bar, which shows price is pushing below prior lows after this breakout lower.

AUD/CHF sitting at 1 month support lineAUD/CHF has bounced off this same diagonal support line 3 times in the last month and a half and has come back down to retest it for a 4th time. Looking for a long position with a SL set below the diagonal support line.
SL: set below support line.
TP1: 0.5227
TP2: 0.5238
TP3: 0.5251
TP4: 0.5276
Good Luck Traders!!!

AUDCHF Short From ResistanceHello Traders
In This Chart AUDCHF 4 HOURLY Forex Forecast By FOREX PLANET
today AUDCHF analysis 👆
🟢This Chart includes AUDCHF market update)
🟢What is The Next Opportunity on AUDCHF Market
🟢how to Enter to the Valid Entry With Assurance Profit
This CHART is For Trader's that Want to Improve Their Technical Analysis Skills and Their Trading By Understanding How To Analyze The Market Using Multiple Timeframes and Understanding The Bigger Picture on the Charts

AUD/CHF – Textbook Head & Shoulders (VMS in Action)Yesterday, AUD/CHF gave us a perfect setup:
Clear Head & Shoulders pattern
Pullback right to the neckline
Volume & Momentum fully aligned (VMS ✅)
The engulfing candle was too large for an entry, so I set a limit order instead. We got filled in the afternoon, and the market dropped almost straight down overnight and into this morning.
👉 This is why patience + rules matter. No chasing, just letting the setup come to you.
📌 Marked-up chart above for clarity.
#forex #AUDCHF #headandshoulders #tradingstrategy #VMS

AUDCHF - BEARISHThe AUDCHF currency pair has experienced a steady bearish action for the past few years, and after reaching into it's mid 2023 supply zone at 0.60900, the currency had successfully made consecutive break of structures to the down side reaching a low at 0.50000 before making a retracement to 0.54500 and continuing downwards to 0.51947 from where an intermediate uptrend can be noticed sequel to the Market Structure shift observed at 0.52311 and the two break of structures noticed at 0.52575 and 0.52611 respectively.
Traders may be interested in taking their BUY positions at 0.51950 if the market sweeps the internal liquidity resting at the 0.52087 level and reaches back into the failed order block observed at the 0.51950 - 0.51825 zone. Thereby placing their STOP LOSS slightly below 0.51790 and TAKE PROFIT at 0.52950 . Having a Risk/Reward Ratio of 6.0

AUDCHF - Looking To Sell Pullbacks In The Short TermH1 - Strong bearish move.
No opposite signs.
Expecting bearish continuation until the two Fibonacci resistance zones hold.
If you enjoy this idea, don’t forget to LIKE 👍, FOLLOW ✅, SHARE 🙌, and COMMENT ✍! Drop your thoughts and charts below to keep the discussion going. Your support helps keep this content free and reach more people! 🚀

AUDCHF Is Going Up! Long!
Please, check our technical outlook for AUDCHF.
Time Frame: 2h
Current Trend: Bullish
Sentiment: Oversold (based on 7-period RSI)
Forecast: Bullish
The market is approaching a significant support area 0.522.
The underlined horizontal cluster clearly indicates a highly probable bullish movement with target 0.524 level.
P.S
The term oversold refers to a condition where an asset has traded lower in price and has the potential for a price bounce.
Overbought refers to market scenarios where the instrument is traded considerably higher than its fair value. Overvaluation is caused by market sentiments when there is positive news.
Disclosure: I am part of Trade Nation's Influencer program and receive a monthly fee for using their TradingView charts in my analysis.
Like and subscribe and comment my ideas if you enjoy them!
