FTSE 100Watch FTSE if it fails to break above key resistance from the 9 and 18 days M/A..If we fail to break this, then a DT can be seen...Already FTSE has corrected down to its first 23.6 Fib...
Just be careful with long positions...If short profit taking should occur..You can always go back into the mark

FTSE 100 Perfect Channel Up buy opportunity.FTSE 100 (UK100) has been trading within a 5-month Channel Up and right now finds itself within its 4H MA50 (red trend-line) and 1D MA50 (blue trend-line). The 1D MA50 has been intact as a Support since May 02 and initiated its previous Bullish Leg on June 25.
We expect a similar rally towards the

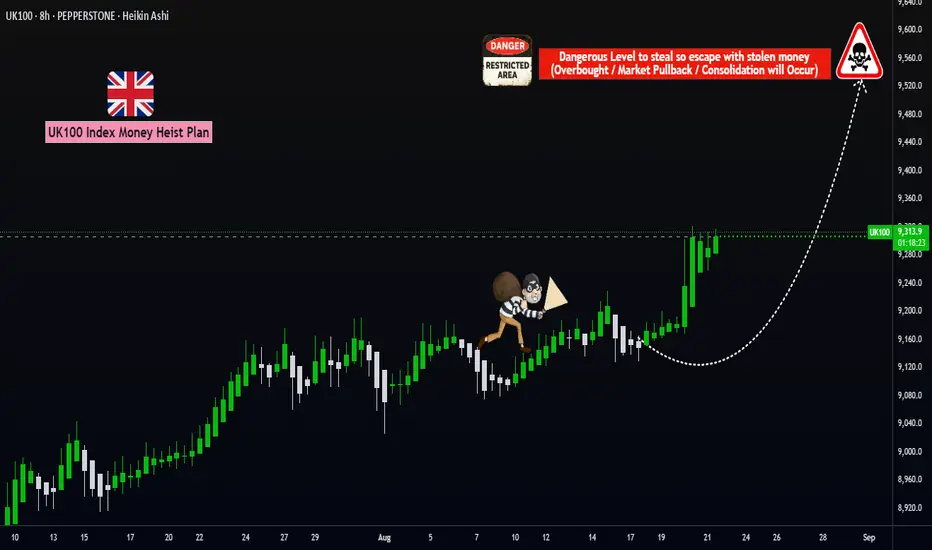
UK100 Strategy Map: SMA Pullback Meets Heikin Ashi Signal🚀 UK100 Index Market Wealth Strategy Map (Swing/Day Trade)
📊 Plan
🔹 Bias: Bullish trend confirmed
🔹 Method: Simple Moving Average (SMA-382) pullback + bullish Heikin Ashi candle confirmation + Double bottom pullback detected.
🔹 Style: Thief layering strategy (multiple limit orders to build position)

UK100 H4 | Bullish bounceBased on the H4 chart analysis, we could see the price fall to the buy entry of 9,236.24, whichis an overlap support that is slightly above the 50% Fibonacci retracement and could bounce from this level to the upside.
Stop loss is at 9,178.92, whichis a pullback support that is slightly below the 1

Heading into 38.2% Fibonacci resistance?UK100 is rising towards the pivot which acts as an overlap resistance that lines up with the 38.2% Fibonacci retracement and could reverse to the multi swing low support.
Pivot: 9,240.23
1st Support: 9,128.22
1st Resistance: 9,327.92
Disclaimer:
The above opinions given constitute general market

FTSE100 important support retest at 9190The FTSE remains in a bullish trend, with recent price action showing signs of a corrective pullback within the broader uptrend.
Support Zone: 9190 – a key level from previous consolidation. Price is currently testing or approaching this level.
A bullish rebound from 9190 would confirm ongoing ups

UK100 Bullish Heist: Ready to Loot the Upside?🎯 TRADE PLAN: UK100 BULLISH ROBBERY HEIST! 🎯
Asset: UK100 "FTSE 100 Index Cash" | Type: Indices CFD | Style: Swing & Scalping Larceny
Dearest Fellow Thieves & Money Bandits! 🤑💸🤵♂️👩💼
The vault doors to the UK100 are creaking open! Our intel confirms a BULLISH HEIST is in play. The big money is si
FTSE having problems breakig through the 9 and 18 day M/AI would suggest all short postions covered...At this point I would only go long if above 9248 which is the 18 day M/A

FTSE 100 uptrend remains intactThe FTSE 100 continues to trade above its multi-month rising trendline. The price has extended its recovery from the 9100 September low, rising above to a peak of 9340 last week, just shy of the 9360 record high.
Buyers will need to extend gains above 9360 to head towards fresh record highs. 9500 is

Rise and dip as bear Tuesday kicks in later30-Minute Chart Observations
Price is currently moving sideways around 9,274–9,278 (pivot level).
Very tight consolidation overnight with small candles (low volatility).
EMA cluster (10, 25, 200) is flat and converging — this often signals a larger directional move is coming.
Pivot points:

See all ideas
Displays a symbol's price movements over previous years to identify recurring trends.
Frequently Asked Questions
UK 100 CFD reached its highest quote on Aug 22, 2025 — 9,360.6 GBP. See more data on the UK 100 CFD chart.
The lowest ever quote of UK 100 CFD is 4,785.5 GBP. It was reached on Mar 23, 2020. See more data on the UK 100 CFD chart.
UK 100 CFD is just a number that lets you track performance of the instruments comprising the index, so you can't invest in it directly. But you can buy UK 100 CFD futures or funds or invest in its components.