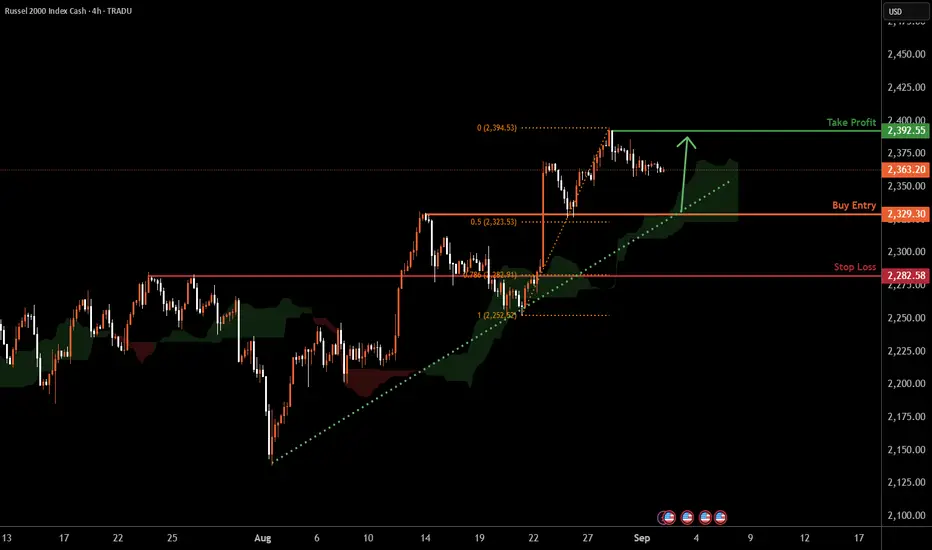
US2000 H4 | Bullish momentum to extendBased on the H4 chart analysis, we could see the price fall to the buy entry at 2,329.30, which is an overlap support that is slightly above the 50% FIbonacci retracement and could bounce from this levle to the upside.
Stop loss is at 2,282.58, which is a pullback support that aligns with the 78.6% Fibonacci retracement.
Take profit is at 2,392.55, which acts as a swing high reisstance.
High Risk Investment Warning
Trading Forex/CFDs on margin carries a high level of risk and may not be suitable for all investors. Leverage can work against you.
Stratos Markets Limited (tradu.com ):
CFDs are complex instruments and come with a high risk of losing money rapidly due to leverage. 65% of retail investor accounts lose money when trading CFDs with this provider. You should consider whether you understand how CFDs work and whether you can afford to take the high risk of losing your money.
Stratos Europe Ltd (tradu.com ):
CFDs are complex instruments and come with a high risk of losing money rapidly due to leverage. 66% of retail investor accounts lose money when trading CFDs with this provider. You should consider whether you understand how CFDs work and whether you can afford to take the high risk of losing your money.
Stratos Global LLC (tradu.com ):
Losses can exceed deposits.
Please be advised that the information presented on TradingView is provided to Tradu (‘Company’, ‘we’) by a third-party provider (‘TFA Global Pte Ltd’). Please be reminded that you are solely responsible for the trading decisions on your account. There is a very high degree of risk involved in trading. Any information and/or content is intended entirely for research, educational and informational purposes only and does not constitute investment or consultation advice or investment strategy. The information is not tailored to the investment needs of any specific person and therefore does not involve a consideration of any of the investment objectives, financial situation or needs of any viewer that may receive it. Kindly also note that past performance is not a reliable indicator of future results. Actual results may differ materially from those anticipated in forward-looking or past performance statements. We assume no liability as to the accuracy or completeness of any of the information and/or content provided herein and the Company cannot be held responsible for any omission, mistake nor for any loss or damage including without limitation to any loss of profit which may arise from reliance on any information supplied by TFA Global Pte Ltd.
The speaker(s) is neither an employee, agent nor representative of Tradu and is therefore acting independently. The opinions given are their own, constitute general market commentary, and do not constitute the opinion or advice of Tradu or any form of personal or investment advice. Tradu neither endorses nor guarantees offerings of third-party speakers, nor is Tradu responsible for the content, veracity or opinions of third-party speakers, presenters or participants.
USSMALLCAP2000CFD trade ideas
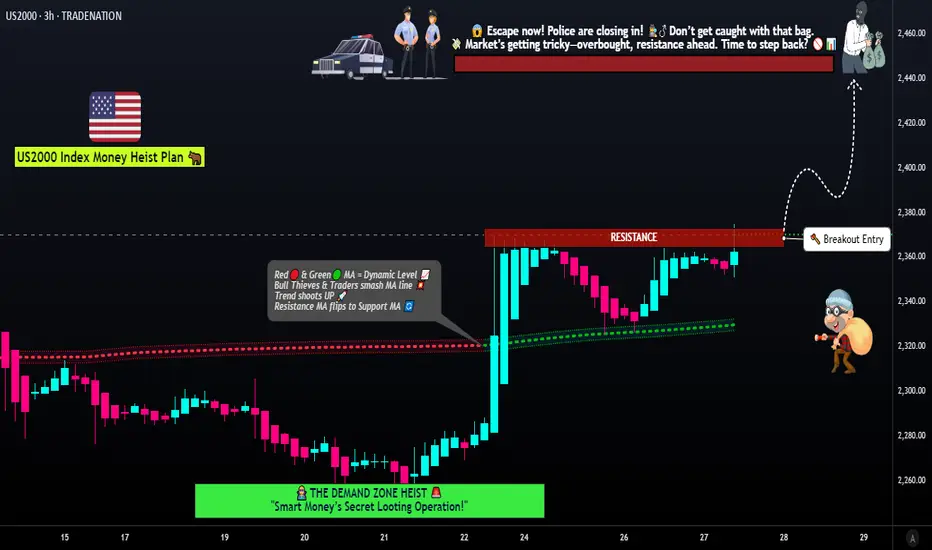
US2000 Bullish Breakout Strategy! Layer Entries and Escape Plan🚨💰 US2000 / RUSSELL2000 Index Market Robbery Plan 🏦💸 (Swing/Scalping Trade)
🌟Hi! Hola! Ola! Bonjour! Hallo! Marhaba!🌟
Dear Money Makers & Robbers, 🤑💰💸✈️
Based on 🔥 Thief Trading Strategy 🔥 here is our heist plan to rob the US2000 / RUSSELL2000 Index Bank Vault. Stick to the strategy outlined below – this is a layered entry plan, designed to outsmart market police 🚓.
🎯 Entry Plan (Breakout + Layered Thief Style)
📌 Breakout Entry @ 2370.00 ⚡ → Robbery starts here!
📌 Layered Buy Limit Orders: (2370.00) – (2360.00) – (2350.00) – (2340.00)
👉 Add more layers if you want, but only activate after breakout confirmation!
📌 Set Alarm in TradingView ⏰ to know the exact breakout moment.
(Thief Rule: Using multiple entries = more bags of cash 💰. Don’t be lazy – set layers smartly!)
🛑 Stop Loss (SL) – Thief Protection Line
📍 Thief SL @2300.00 (place AFTER breakout)
📍 Adjust based on your risk, lot size, and how many layers you’ve stacked.
👉 Remember: Stop loss is the alarm system – place it wisely or police will catch you 🚨.
🏴☠️ Target 🎯 – Escape Point
🚀 2440.00 = Police Barricade!
Escape with stolen profit bags before they lock down the road 🛑.
👉 You can take profit earlier if you see police headlights flashing 👮♂️.
🧲 Scalpers Note 👀
⚡ Rob fast, rob clean – only scalp long side.
If you’re rich 💎 – straight breakout entry.
If you’re patient thief – layer it like an OG.
📢 News & Risk Management Alert ⚠️
📰 Big news = extra police patrols 🚔.
👉 Avoid new trades during red news events.
👉 Use trailing SL to lock profits – don’t get caught after a good robbery.
💖 Support our robbery gang 💥Hit the Boost Button💥 on TradingView and power up the Thief Trading Squad 🏆🤝❤️🚀.
Stay tuned, more heist plans are on the way… 🤑🐱👤💸
#ThiefTrader #Russell2000 #US2000 #SwingTrade #Scalping #BreakoutTrading #LayerStrategy #BullishPlan #IndexTrading #HeistPlan #TradingView
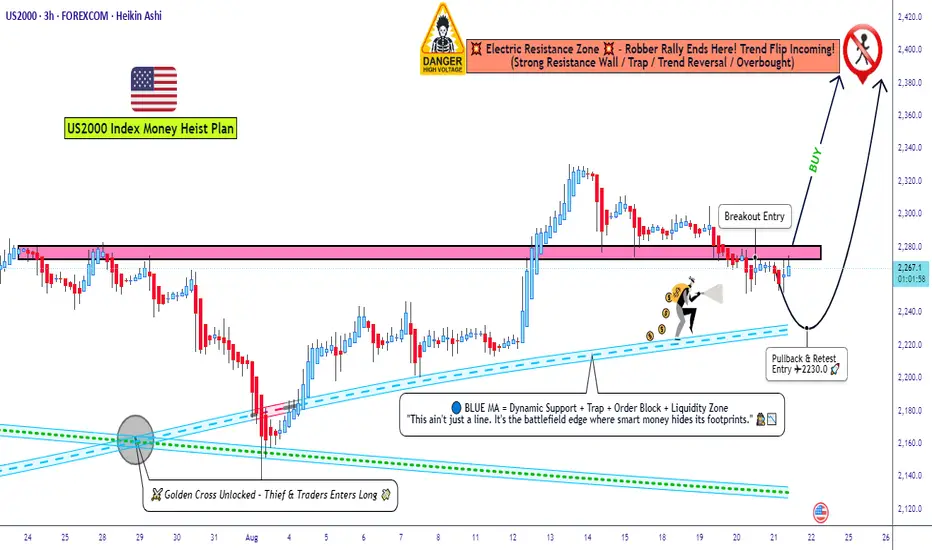
Russell 2000 Heist Plan – Breakout or Pullback Entry Layers?🔥Thief Trader's US2000/Russell 2000 Bullish Heist Plan 🚨💰
🌟 Dear Thief OG's, Ladies & Gentlemen of the Market Robbery Crew! 🌟Get ready to pull off a slick bullish heist on the US2000/Russell 2000 Index using the infamous Thief Trader Layering Strategy! 🤑💸 This is a Swing/Scalping Trade with a high-voltage plan to steal profits and escape before the market cops show up! 🚓⚡
📈 Heist Blueprint: Bullish Robbery Plan
Asset: US2000/Russell 2000 Index 📊
Market Direction: Bullish Breakout 🚀
Thief Strategy: Layered Limit Orders for maximum loot! 💰
🔑 Entry Plan: Crack the Vault! 🏦
Breakout Entry: Swipe the loot at 2280.0 ⚡
Pullback Entry: Ambush at 2230.0 for a sneaky grab 📉
Layered Limit Orders: Set multiple buy limit orders to stack your entries like a pro thief! 🕵️♂️
Buy Limit 1: 173.000 💸
Buy Limit 2: 172.700 💸
Buy Limit 3: 172.500 💸
Buy Limit 4: 172.300 💸
Pro Tip: Add more layers based on your risk appetite, but confirm entries with the breakout at 2280.0! 📡
🛑 Stop Loss: Cover Your Tracks! 🚨
Pullback Entry SL: 2200.0 🛡️
Breakout Entry SL: 2240.0 🛡️
Thief OG Advice: Adjust SL based on your risk tolerance, lot size, and number of layered orders. Stay sharp! 🔍
🎯 Target: Escape with the Loot! 💼
Profit Target: 2400.0 – High-voltage resistance zone! ⚡ Escape with your stolen profits before the market fights back! 🏃♂️
Scalpers: Quick in, quick out! Use trailing SL to lock in gains. 💨
Swing Traders: Hold steady and ride the bullish wave to the target. 🌊
📰 Market Intel: Why This Heist?
Bullish Drivers: Strong macro trends, positive sentiment, and technical breakout signals. 📈
Research: Check COT reports, geopolitical updates, and intermarket analysis for confirmation. 🌎🗞️
Volatility Warning: News releases can spike volatility. Avoid new trades during high-impact news, and use trailing SL to protect your loot! 🚫📡
💥 Thief Trader Tips for a Clean Getaway
Layering Strategy: Multiple limit orders reduce risk and maximize entries. Stack ‘em like a master thief! 🏦
Risk Management: Adjust SL and lot sizes to match your style. Don’t get greedy! 😎
Boost the Plan: Hit the Boost Button to supercharge our robbery crew’s strength! 🚀💪
Stay Alert: Set price alerts on your chart to catch the breakout or pullback. 📳
🏆 Let’s Rob the Market!
This is your chance to execute the Thief Trader Heist with precision and swagger. 💼 Stay tuned for the next big plan, and let’s keep stealing profits like the slickest market bandits! 🐱👤💰
Happy Heisting, Thief OG’s! 🤝🎉
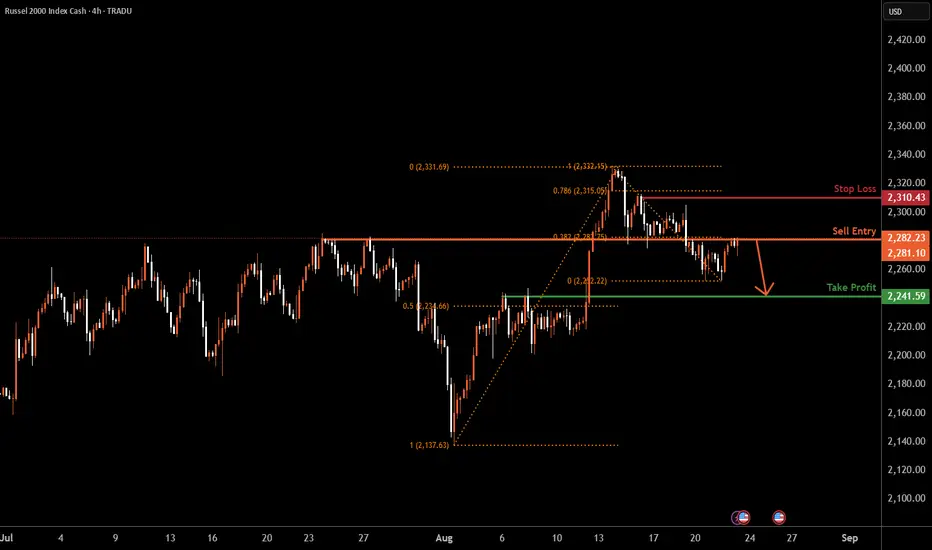
US2000 H4 | Bearish dropUS2000 is reacting off the sell entry at 2,281.28, which is an overlap resistance that aligns with the 38.2% Fibonacci retracement and could drop from this level to the downside.
Stop loss is at 2,310.43, which is an overlap resistance that lines up with the 38.2% Fibonacci retracement.
Take profit is at 2,241.59, which is a pullback support that is slightly above the 50% Fibonacci retracement.
High Risk Investment Warning
Trading Forex/CFDs on margin carries a high level of risk and may not be suitable for all investors. Leverage can work against you.
Stratos Markets Limited (tradu.com ):
CFDs are complex instruments and come with a high risk of losing money rapidly due to leverage. 65% of retail investor accounts lose money when trading CFDs with this provider. You should consider whether you understand how CFDs work and whether you can afford to take the high risk of losing your money.
Stratos Europe Ltd (tradu.com ):
CFDs are complex instruments and come with a high risk of losing money rapidly due to leverage. 66% of retail investor accounts lose money when trading CFDs with this provider. You should consider whether you understand how CFDs work and whether you can afford to take the high risk of losing your money.
Stratos Global LLC (tradu.com ):
Losses can exceed deposits.
Please be advised that the information presented on TradingView is provided to Tradu (‘Company’, ‘we’) by a third-party provider (‘TFA Global Pte Ltd’). Please be reminded that you are solely responsible for the trading decisions on your account. There is a very high degree of risk involved in trading. Any information and/or content is intended entirely for research, educational and informational purposes only and does not constitute investment or consultation advice or investment strategy. The information is not tailored to the investment needs of any specific person and therefore does not involve a consideration of any of the investment objectives, financial situation or needs of any viewer that may receive it. Kindly also note that past performance is not a reliable indicator of future results. Actual results may differ materially from those anticipated in forward-looking or past performance statements. We assume no liability as to the accuracy or completeness of any of the information and/or content provided herein and the Company cannot be held responsible for any omission, mistake nor for any loss or damage including without limitation to any loss of profit which may arise from reliance on any information supplied by TFA Global Pte Ltd.
The speaker(s) is neither an employee, agent nor representative of Tradu and is therefore acting independently. The opinions given are their own, constitute general market commentary, and do not constitute the opinion or advice of Tradu or any form of personal or investment advice. Tradu neither endorses nor guarantees offerings of third-party speakers, nor is Tradu responsible for the content, veracity or opinions of third-party speakers, presenters or participants.
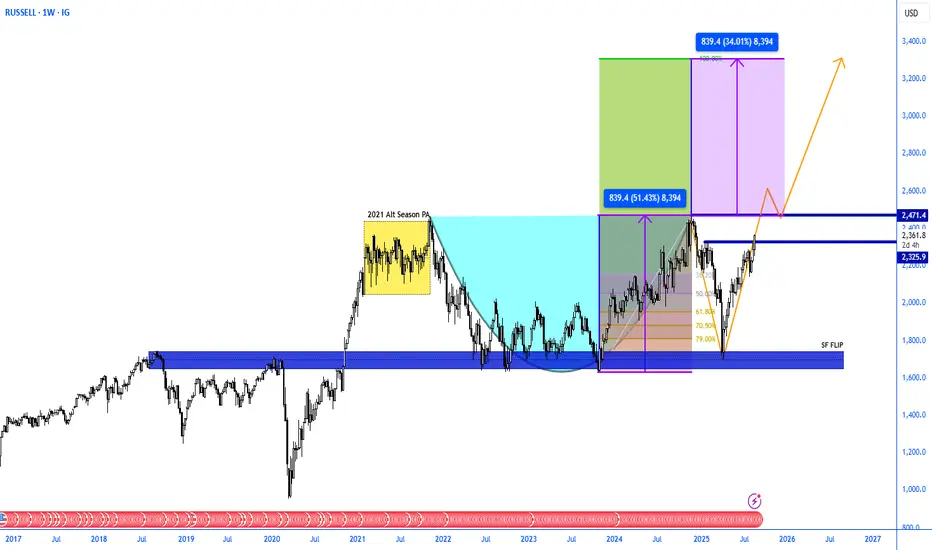
RUSSELL Generational Bullish Cup & Handle pattern Russell has created a generational sized bullish cup and handel pattern, with the crypto alt season heating up along side, i have highlighted the 2021 alt coin season to show that alts moed hundreds of percent where Russell made a strong impulsive move upwards but then consoldated, i believe this will be dwarfed on the alt coin charts with a huge breakout on Russell pending.
Target for Rusell 3300, target for alt coins Moon.
Pay close attention to the Russell 2000/S&P 500 ratio!1) The Russell 2000 is the US small-cap stock market index
The Russell 2000 is a stock market index comprising some 2,000 US small caps, making it the main barometer of small-cap performance in the USA. The S&P 500, on the other hand, is made up of 500 large US companies, representative of large caps, which are generally more diversified and internationally oriented. The Russell 2000 is characterized by higher volatility, as small caps are more sensitive to domestic economic conditions, interest rates and credit cycles, while the S&P 500 reflects the underlying trend of US tech stars.
2) The Russell 2000/S&P 500 ratio is a major barometer of risk appetite in the stock market, and will enter a bullish rebound if and only if the FED makes a real pivot in the last quarter of 2025
A notable difference lies in profitability: a significant proportion of Russell 2000 companies are not yet profitable, whereas most S&P 500 companies are mature, benefiting from solid margins and more robust balance sheets.
For this reason, the Russell 2000 index is ultra-sensitive to the FED's monetary policy. Consequently, if the FED opts for a real pivot at the end of the year (several consecutive rate cuts), this will improve credit conditions and support small-cap stocks. On the other hand, if the FED opts for no pivot at all, or just a technical pivot, this will not be favorable for the Russell 2000.
This is why the Russell 2000/S&P 500 ratio can be considered an excellent risk barometer. For the moment, this ratio is following a downward trend, but major support is approaching, as is the start of divergence. The day this ratio turns upwards, it will be a strong signal in favor of risk appetite and the outperformance of small-cap stocks. That day hasn't yet come, but you should keep a close eye on this ratio between US small caps and the S&P500.
3) While the S&P 500 is as expensive as it was at the end of 2021 in terms of valuation, the Russell 2000 is cheap and still a long way from its all-time high
While the S&P 500 is back to its valuation level of the end of 2021, the Russell 2000's corporate valuations are still far behind and far from a zone of historical excess.
In terms of technical analysis, major support has been identified at 2135 points, and as long as the index holds above this support, it may be in a position to reach its all-time high.
The chart below shows daily Japanese candlesticks on the Russell 2000 index
DISCLAIMER:
This content is intended for individuals who are familiar with financial markets and instruments and is for information purposes only. The presented idea (including market commentary, market data and observations) is not a work product of any research department of Swissquote or its affiliates. This material is intended to highlight market action and does not constitute investment, legal or tax advice. If you are a retail investor or lack experience in trading complex financial products, it is advisable to seek professional advice from licensed advisor before making any financial decisions.
This content is not intended to manipulate the market or encourage any specific financial behavior.
Swissquote makes no representation or warranty as to the quality, completeness, accuracy, comprehensiveness or non-infringement of such content. The views expressed are those of the consultant and are provided for educational purposes only. Any information provided relating to a product or market should not be construed as recommending an investment strategy or transaction. Past performance is not a guarantee of future results.
Swissquote and its employees and representatives shall in no event be held liable for any damages or losses arising directly or indirectly from decisions made on the basis of this content.
The use of any third-party brands or trademarks is for information only and does not imply endorsement by Swissquote, or that the trademark owner has authorised Swissquote to promote its products or services.
Swissquote is the marketing brand for the activities of Swissquote Bank Ltd (Switzerland) regulated by FINMA, Swissquote Capital Markets Limited regulated by CySEC (Cyprus), Swissquote Bank Europe SA (Luxembourg) regulated by the CSSF, Swissquote Ltd (UK) regulated by the FCA, Swissquote Financial Services (Malta) Ltd regulated by the Malta Financial Services Authority, Swissquote MEA Ltd. (UAE) regulated by the Dubai Financial Services Authority, Swissquote Pte Ltd (Singapore) regulated by the Monetary Authority of Singapore, Swissquote Asia Limited (Hong Kong) licensed by the Hong Kong Securities and Futures Commission (SFC) and Swissquote South Africa (Pty) Ltd supervised by the FSCA.
Products and services of Swissquote are only intended for those permitted to receive them under local law.
All investments carry a degree of risk. The risk of loss in trading or holding financial instruments can be substantial. The value of financial instruments, including but not limited to stocks, bonds, cryptocurrencies, and other assets, can fluctuate both upwards and downwards. There is a significant risk of financial loss when buying, selling, holding, staking, or investing in these instruments. SQBE makes no recommendations regarding any specific investment, transaction, or the use of any particular investment strategy.
CFDs are complex instruments and come with a high risk of losing money rapidly due to leverage. The vast majority of retail client accounts suffer capital losses when trading in CFDs. You should consider whether you understand how CFDs work and whether you can afford to take the high risk of losing your money.
Digital Assets are unregulated in most countries and consumer protection rules may not apply. As highly volatile speculative investments, Digital Assets are not suitable for investors without a high-risk tolerance. Make sure you understand each Digital Asset before you trade.
Cryptocurrencies are not considered legal tender in some jurisdictions and are subject to regulatory uncertainties.
The use of Internet-based systems can involve high risks, including, but not limited to, fraud, cyber-attacks, network and communication failures, as well as identity theft and phishing attacks related to crypto-assets.

Russel 2000 | H4 Head and Shoulders | GTradingMethodHello Traders.
Welcome to today's trade idea by GTradingMethod.
🧐 Market Overview:
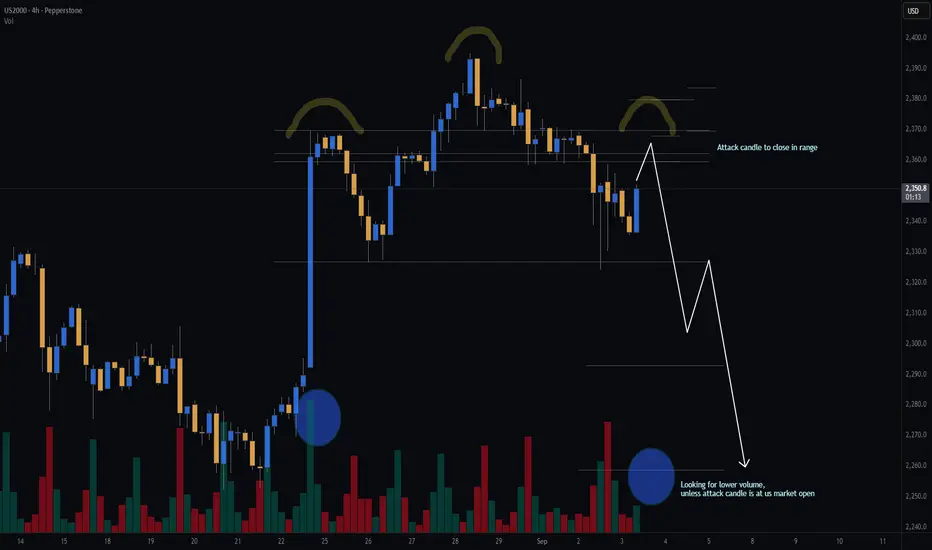
Since April 2025, this rally has been powering higher, leaving little room for pullbacks. But momentum is starting to show cracks — indicators are flashing signs of exhaustion. This doesn’t mean a sharp drop is guaranteed; markets often pause and drift sideways to shake off overbought pressure.
What I’m watching closely now is whether a head and shoulders pattern takes shape. If price steps into and closes in my entry zone, it could mark the start of a deeper pullback, but confirmation is key before jumping in.
📊 Trade Plan:
Risk/Reward: 3.9
Entry: 2,359.6
Stop Loss: 2,379.7
Take Profit 1 (50%): 2,292.9
Take Profit 2 (50%): 2,258.7
💡 GTradingMethod Tip:
Patience is a trading edge. Waiting for confirmation keeps you aligned with probability and protects you from unnecessary losses.
🙏 Thanks for checking out my post!
Make sure to follow me to catch the next idea and please share your thoughts - I would like to hear them.
📌 Please note:
This is not financial advice. This content is to track my trading journey and for educational purposes only.
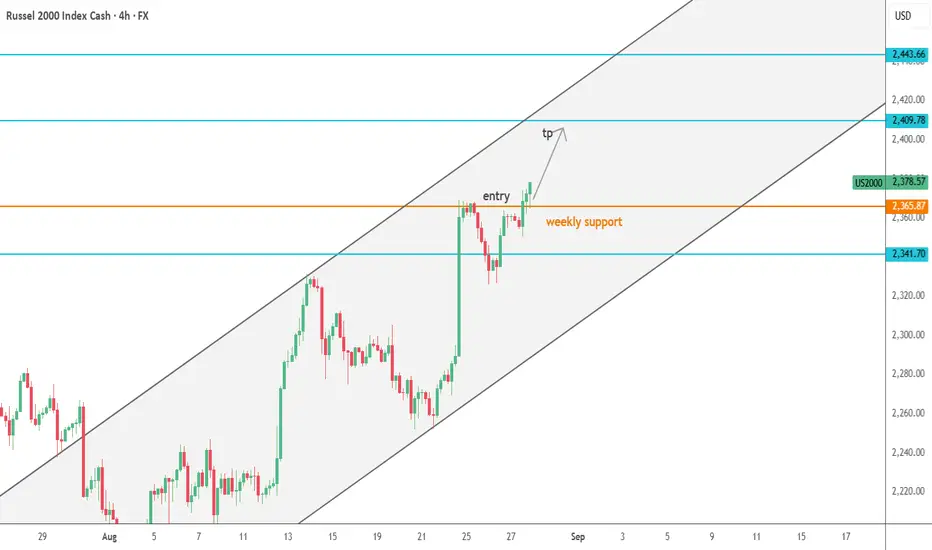
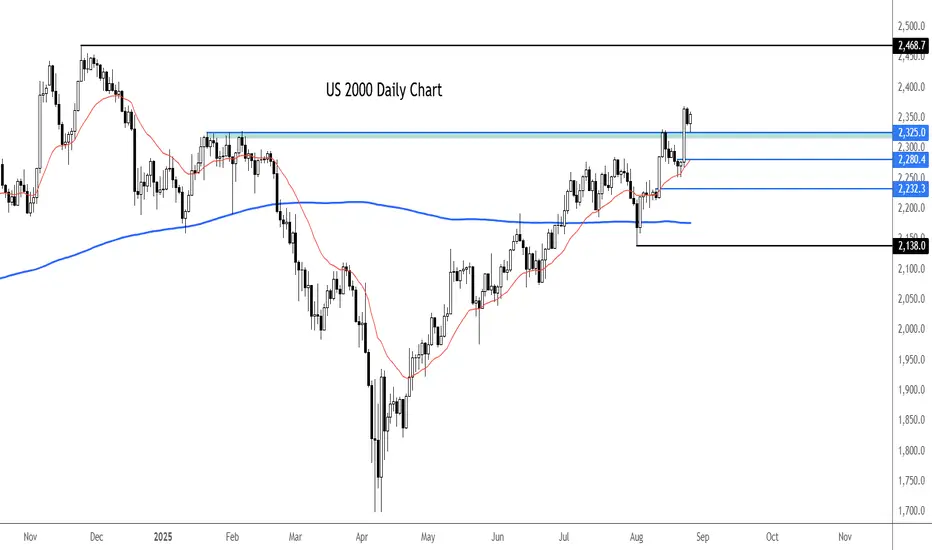
Russell continues to paint bullish PA for small capsSmall caps have surged higher in recent days as investors warm towards companies most exposed to the domestic US economy, in part thanks to rising expectations for interest rate cuts.
The Russell is also showing clean price action from a bullish point of view: breaking key levels and defending them. Once such level was around 2325 which it took out on Friday in response to a dovish Powell. That level has turned into support today after Monday's slight pullback. Though it is possible we could see a break below this level and for the index to test longer term levels, that wouldn't necessarily be the end of the bullish run. Below this level, the next support to watch is around 2280 followed by 2232.
Resistance is now seen around round handles like 2,400 and the previous high of 2468. That could be the target for the bulls from here.
By Fawad Razaqzada, market analyst with FOREX.com
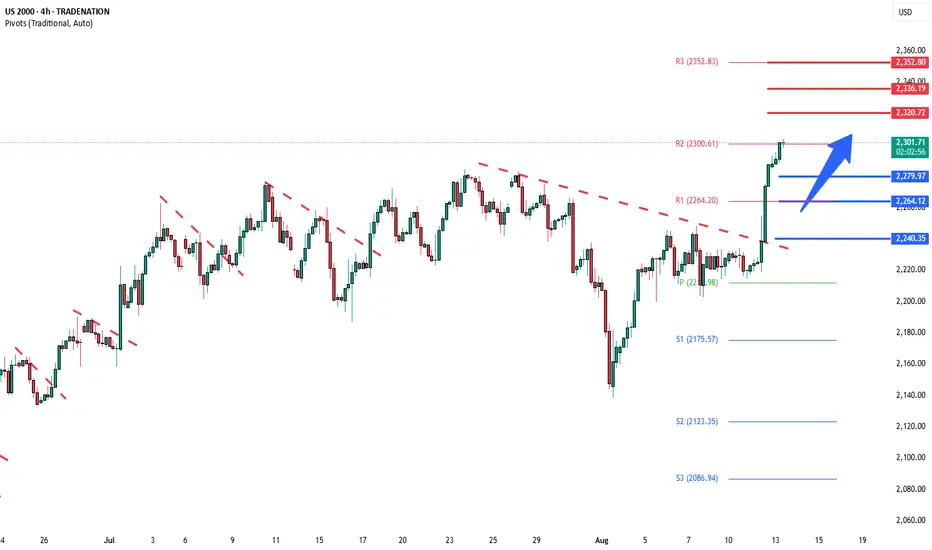
Russell2000 key trading levels Key Support and Resistance Levels
Resistance Level 1: 2320.70
Resistance Level 2: 2336.20
Resistance Level 3: 2352.80
Support Level 1: 2280.00
Support Level 2: 2264.10
Support Level 3: 2240.35
This communication is for informational purposes only and should not be viewed as any form of recommendation as to a particular course of action or as investment advice. It is not intended as an offer or solicitation for the purchase or sale of any financial instrument or as an official confirmation of any transaction. Opinions, estimates and assumptions expressed herein are made as of the date of this communication and are subject to change without notice. This communication has been prepared based upon information, including market prices, data and other information, believed to be reliable; however, Trade Nation does not warrant its completeness or accuracy. All market prices and market data contained in or attached to this communication are indicative and subject to change without notice.
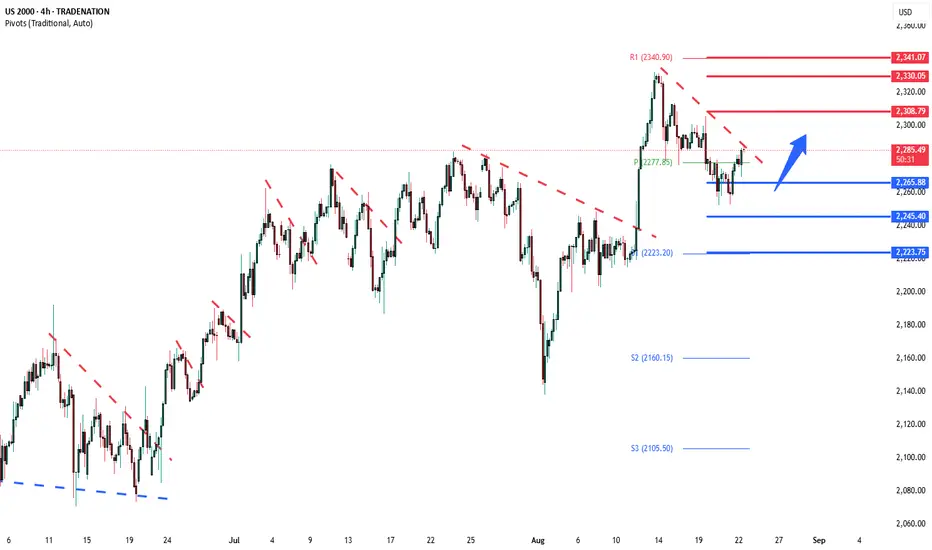
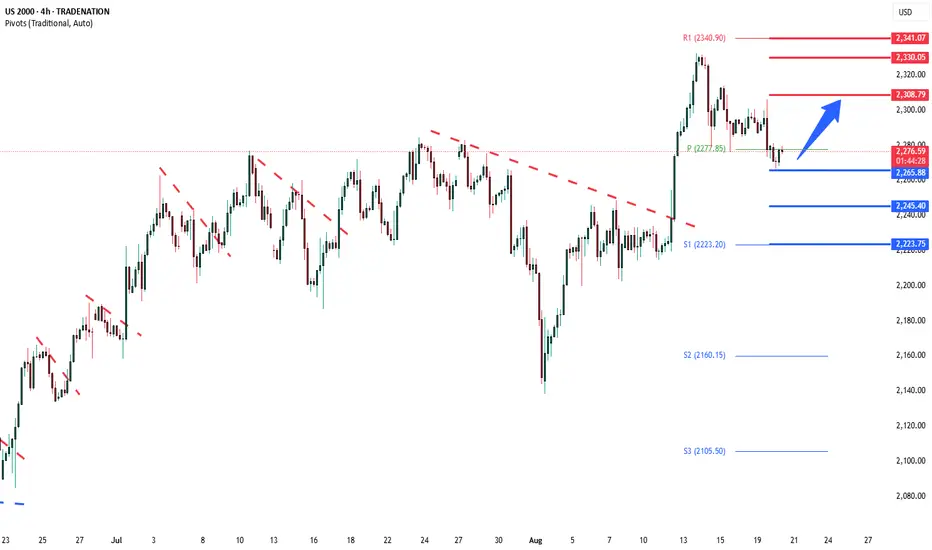
Russell2000 key trading levelsKey Support and Resistance Levels
Resistance Level 1: 2,308
Resistance Level 2: 2,330
Resistance Level 3: 2,341
Support Level 1: 2,265
Support Level 2: 2,245
Support Level 3: 2,223
This communication is for informational purposes only and should not be viewed as any form of recommendation as to a particular course of action or as investment advice. It is not intended as an offer or solicitation for the purchase or sale of any financial instrument or as an official confirmation of any transaction. Opinions, estimates and assumptions expressed herein are made as of the date of this communication and are subject to change without notice. This communication has been prepared based upon information, including market prices, data and other information, believed to be reliable; however, Trade Nation does not warrant its completeness or accuracy. All market prices and market data contained in or attached to this communication are indicative and subject to change without notice.
RTY Russel 2000 expansion:bullish targetsTargets and thesis on chart
Expecting to see price action move towards the 2700-2900 region
Confluence with regular fib extension 2.618 non-log arithmetic chart
Trend based fib
EWT channel measured from wave 1 (2-4 transposed to 1)
Fractal
Expecting this move to align with the rest of the markets and peak around november 2024

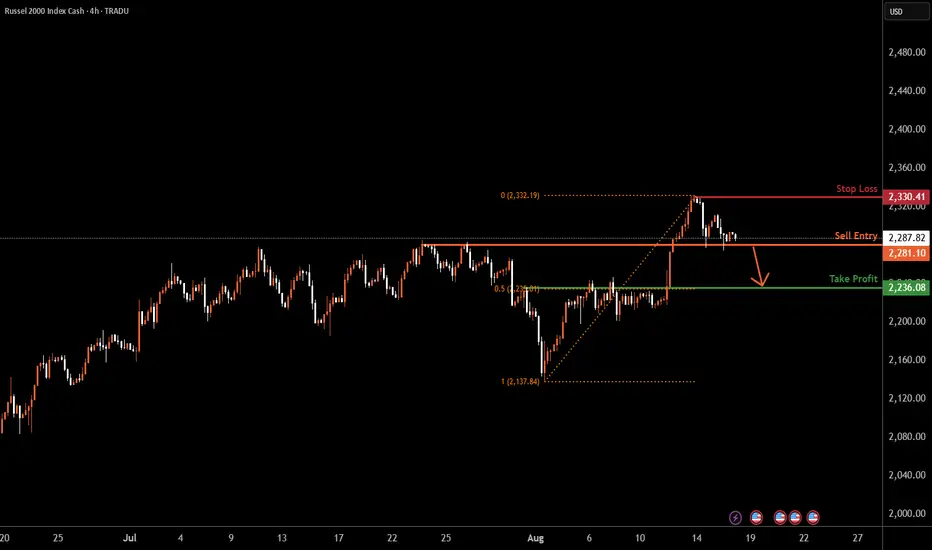
US2000 H4 | Bearish breakoutUS2000 is falling towards the buy entry, which is a pullback suppor,t and a breakout off this level could lead the price to drop to the take profit.
Sell entry is at 2,281.10, which is a pullback support.
Stop loss is at 2,330.41, which is a swing high resistance.
Take profit is at 2,236.08, which is a pullback support that lines up with the 50% Fibonacci retracement.
High Risk Investment Warning
Trading Forex/CFDs on margin carries a high level of risk and may not be suitable for all investors. Leverage can work against you.
Stratos Markets Limited (tradu.com ):
CFDs are complex instruments and come with a high risk of losing money rapidly due to leverage. 65% of retail investor accounts lose money when trading CFDs with this provider. You should consider whether you understand how CFDs work and whether you can afford to take the high risk of losing your money.
Stratos Europe Ltd (tradu.com ):
CFDs are complex instruments and come with a high risk of losing money rapidly due to leverage. 66% of retail investor accounts lose money when trading CFDs with this provider. You should consider whether you understand how CFDs work and whether you can afford to take the high risk of losing your money.
Stratos Global LLC (tradu.com ):
Losses can exceed deposits.
Please be advised that the information presented on TradingView is provided to Tradu (‘Company’, ‘we’) by a third-party provider (‘TFA Global Pte Ltd’). Please be reminded that you are solely responsible for the trading decisions on your account. There is a very high degree of risk involved in trading. Any information and/or content is intended entirely for research, educational and informational purposes only and does not constitute investment or consultation advice or investment strategy. The information is not tailored to the investment needs of any specific person and therefore does not involve a consideration of any of the investment objectives, financial situation or needs of any viewer that may receive it. Kindly also note that past performance is not a reliable indicator of future results. Actual results may differ materially from those anticipated in forward-looking or past performance statements. We assume no liability as to the accuracy or completeness of any of the information and/or content provided herein and the Company cannot be held responsible for any omission, mistake nor for any loss or damage including without limitation to any loss of profit which may arise from reliance on any information supplied by TFA Global Pte Ltd.
The speaker(s) is neither an employee, agent nor representative of Tradu and is therefore acting independently. The opinions given are their own, constitute general market commentary, and do not constitute the opinion or advice of Tradu or any form of personal or investment advice. Tradu neither endorses nor guarantees offerings of third-party speakers, nor is Tradu responsible for the content, veracity or opinions of third-party speakers, presenters or participants.
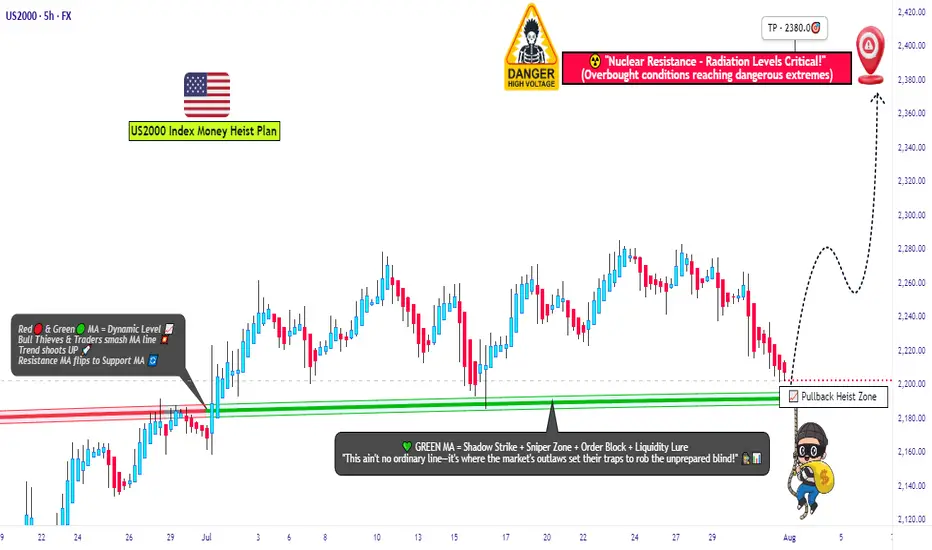
"US2000 THIEF TRADE: SWIPE & ESCAPE BEFORE BEARS!"🚨Russell 2000 Robbery: Pullback to Power Play⚡️💰
🌟Hi! Hola! Ola! Bonjour! Hallo! Marhaba!🌟
Dear Market Robbers & Money Makers, 🤑💰💸✈️
This is a full-blown heist plan on the US2000 (Russell 2000) index using the Thief Trading Style™, a perfect combo of real-time technicals + macro heat.
Get ready to swipe the bull run right after a tactical pullback — let’s rob the market clean and vanish at the high-voltage resistance level ⚡️🚨📊
📈 Entry Plan – The Vault Opens @ 2190.00
Watch for a clean pullback to the zone around 2190.00.
Place buy limit orders after confirmation from 15m or 30m candles – preferably near recent swing lows.
Smart move: Set alerts so you don’t miss the breakout trigger.
🛑 Stop Loss – Escape Hatch @ 2140.00
Use the nearest 4H candle wick or swing low as your SL level.
Thieves scale their lot size & SL based on position stacking and trade confidence.
🎯 Target – 2380.00 (Or Jump Before the Heat Gets Real)
Take profit near the heavy resistance zone. Don’t overstay — market traps ahead! Electric reversals & institutional bears wait there to flip the game ⚡🐻
👀 Scalpers’ Secret:
Only long scalps! 💣
No funds? Follow the swing robbers.
Trail your SL and let the bulls push your bags up.
🧠 What’s Fueling This Bullish Ride?
US2000 is surging with:
• Risk appetite from macro sentiment
• COT data aligning bullish
• Intermarket signals syncing up
• Rotational flows into small-cap strength
⚠️ Thief Trading Alerts – News Impact Zone Incoming!
• Don’t enter fresh trades during red news.
• Use trailing SLs to guard floating profits.
Market spikes are good — if you’re prepared.
💣💥This isn’t just a trade – it’s a mission.
Rob smart, trail hard, and cash out sharp.
📦💼Every move is calculated. Every entry is a chance.
🚀Stay sharp, robbers – next heist plan drops soon! 💼🔐📈
🏆Trade like a thief, win like a boss.
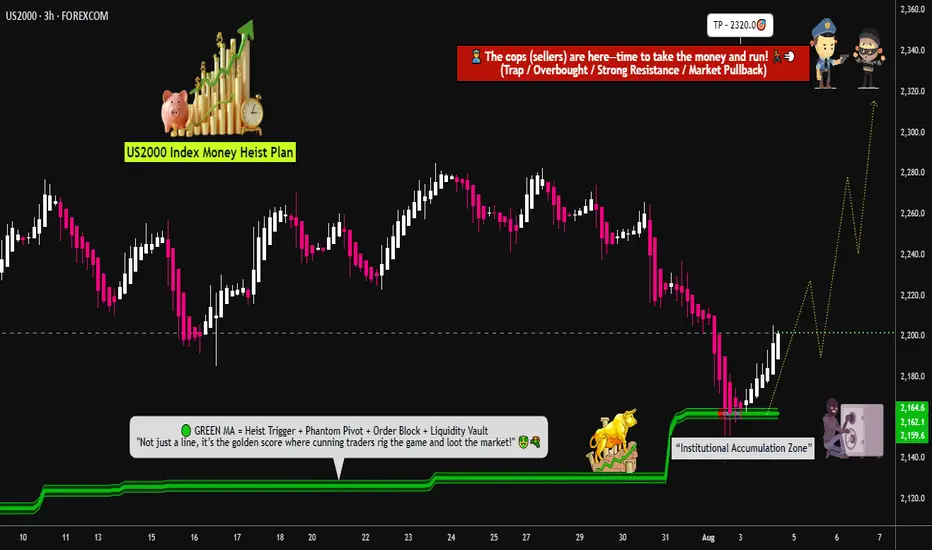
Russell 2000 Bullish Attack – Vault Break-In Loading🚨US2000 / Russell 2000 Heist Plan – Bullish Loot Incoming!🚨
🤑 Dear Robbers of the Market Vault,
The Russell 2000 is showing cracks in the bear walls—time for a bold bullish break-in! 🔓📈
The Thief has eyes everywhere, and right now, the loot sits between 2140.0 & 2320.0. Let's steal it!
📌 Asset: US2000 / Russell 2000
📍 Plan: Bullish (Heist Mode: ON)
🧲 Method: Layering entries like a smooth criminal 🎯💣
💵 Entry: Any price – the vault door’s open, rob at your timing!
🛡️ Stop Loss: 2140.0 (Guarded exit in case the heat gets too strong)
🎯 Target: 2320.0 (The gold bars are stacked here)
🧠 Robbery Blueprint (Strategy Notes):
Use multiple buy limit orders 🔄
Structure entries near swing lows in 15m/30m charts
Wait for dips, snatch the momentum—we rob during weakness!
Always place alerts to spot intraday cracks in the defense lines 📳📊
Don’t chase; we trap the trap!
💥Risk Alert & Protection Plan:
News events = 🔥 volatility bombs.
❌ No fresh trades during high-impact news
✅ Use trailing SL to lock in the loot
🔐 Protect your gains like the vault guards protect gold!
⚔️ Scalpers & Swing Thieves Note:
Scalp only on the long side
💸 Small capital = DCA entry + trail
💰 Big pockets = Straight breakout sniper shot
Stay light, stay fast, stay rich!
📢 Final Words from the Mastermind:
Boost this heist if you love the thrill of the steal 💥
Trade with precision, exit with profits, and never let the market catch you!
The next robbery plan drops soon... be ready, robbers 🐱👤🚨📈
Russell 2000 uptrend support at 2280.00Key Support and Resistance Levels
Resistance Level 1: 2320.70
Resistance Level 2: 2336.20
Resistance Level 3: 2352.80
Support Level 1: 2280.00
Support Level 2: 2264.10
Support Level 3: 2240.35
This communication is for informational purposes only and should not be viewed as any form of recommendation as to a particular course of action or as investment advice. It is not intended as an offer or solicitation for the purchase or sale of any financial instrument or as an official confirmation of any transaction. Opinions, estimates and assumptions expressed herein are made as of the date of this communication and are subject to change without notice. This communication has been prepared based upon information, including market prices, data and other information, believed to be reliable; however, Trade Nation does not warrant its completeness or accuracy. All market prices and market data contained in or attached to this communication are indicative and subject to change without notice.

Russell2000 Key Trading LevelsKey Support and Resistance Levels
Resistance Level 1: 2320.70
Resistance Level 2: 2336.20
Resistance Level 3: 2352.80
Support Level 1: 2280.00
Support Level 2: 2264.10
Support Level 3: 2240.35
This communication is for informational purposes only and should not be viewed as any form of recommendation as to a particular course of action or as investment advice. It is not intended as an offer or solicitation for the purchase or sale of any financial instrument or as an official confirmation of any transaction. Opinions, estimates and assumptions expressed herein are made as of the date of this communication and are subject to change without notice. This communication has been prepared based upon information, including market prices, data and other information, believed to be reliable; however, Trade Nation does not warrant its completeness or accuracy. All market prices and market data contained in or attached to this communication are indicative and subject to change without notice.
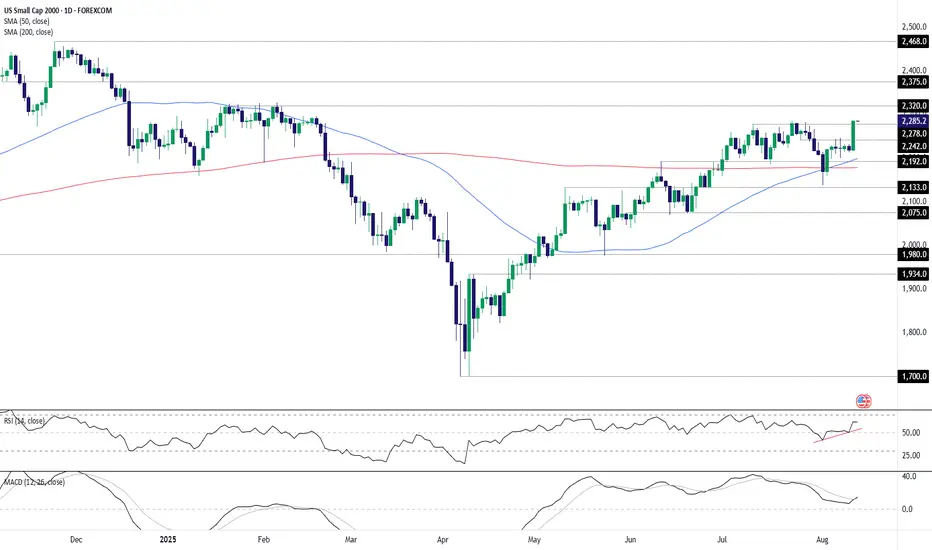
Breakout or Fakeout as Small Caps Hit 6-Month High
U.S. small cap equities motored higher following the release of the July inflation report, with the Russell 2000 closing at its highest level since February. While I have serious reservations about the scale of rate cuts markets have priced in from the Federal Reserve over the next year given persistent strength in services inflation, the readthrough suggests economic activity is nowhere near as weak as the July jobs report would have you believe. That’s a bullish sign for small cap earnings, even though it may eventually lead to markets paring rate cut pricing in the period ahead. I suspect traders would take fewer rate cuts if it meant a stronger economy.
The latest surge saw the Russell close above 2278 resistance, providing a level for traders to work with depending on whether the breakout sticks. With RSI 14 trending higher and MACD having just crossed the signal line from below in positive territory, the momentum signals are entirely bullish, favouring a similar directional bias.
If the price can hold 2278, longs could be established above the level with a stop beneath for protection. Targets include 2320, 2375 and 2468, depending on desired risk-reward.
Alternatively, if the break fails, the setup could be flipped with shorts established beneath 2278 with a stop above for protection. 2242, the 50-day moving average, 2192, and the 200-day moving average are all options for targets. Given price and momentum signals, this setup looks a lower probability play relative to being long small caps.
Good luck!
DS
US2000 Bearish Alert: Institutional Shorts Spike 300%, TechnicalInstitutional Sentiment Shift
Net short interest exploded from –30K in early July to –90K by early August—a 300% jump in bearish conviction.
Daily Chart:
On August 1, US2000 closed below key support, carving a lower low—the first technical indication of a bearish reversal.
Weekly Chart:
A clear bearish engulfing candlestick reinforces the likelihood of further downside.
Macro & Market Backdrop:
• The Fed remains hawkish, quashing near-term rate cut expectations.
Reuters
• Small-caps continue to underperform—Russell trades rich but offers less structural strength compared to large-caps.
MarketWatch
• With stagflation risks rising, small/mid-cap companies could face underperformance and tighter financing conditions.
MarketWatch
Bottom Line:
With institutional short positioning intensifying, market structure turning bearish, and macroeconomic challenges mounting, the US2000 is poised for further pressure. Traders—watch for follow-through declines.

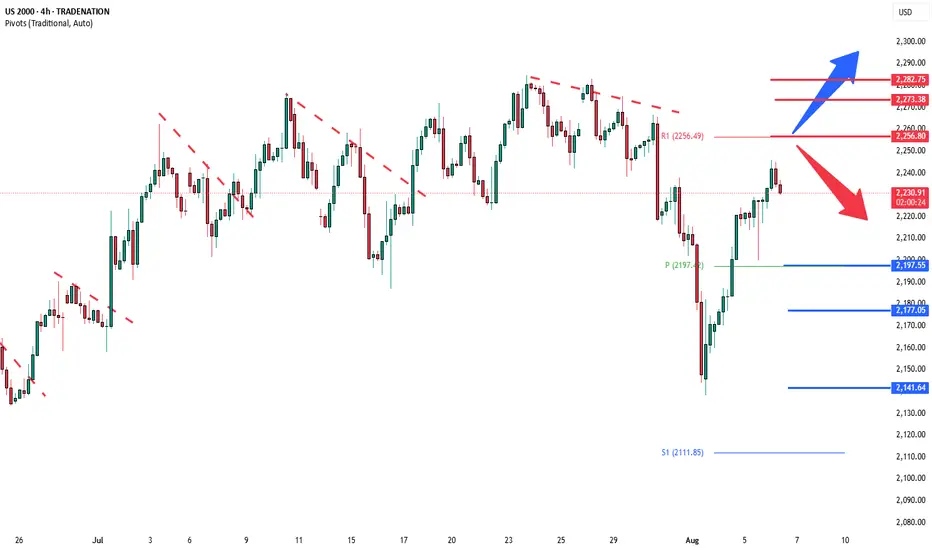
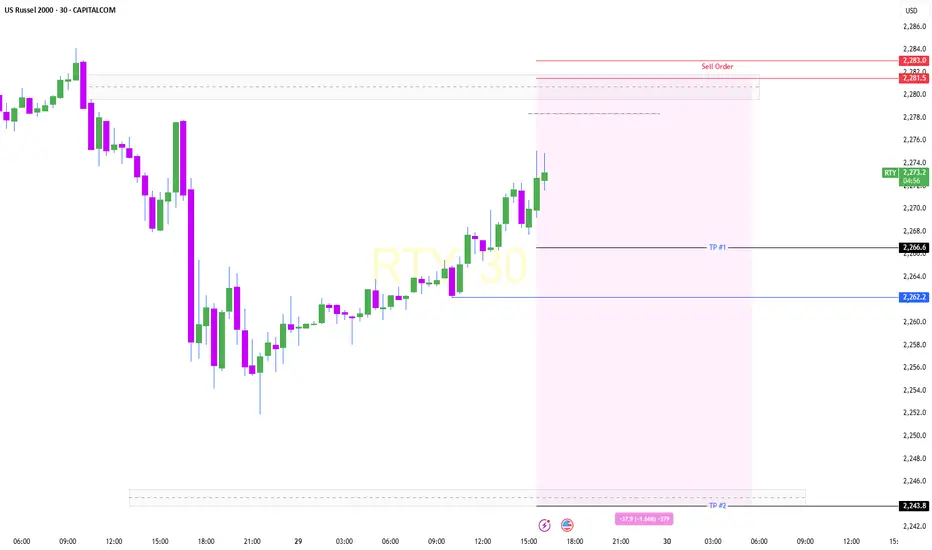
Russell2000 bullish sideways consolidationKey Support and Resistance Levels
Resistance Level 1: 2256
Resistance Level 2: 2273
Resistance Level 3: 2282
Support Level 1: 2197
Support Level 2: 2177
Support Level 3: 2141
This communication is for informational purposes only and should not be viewed as any form of recommendation as to a particular course of action or as investment advice. It is not intended as an offer or solicitation for the purchase or sale of any financial instrument or as an official confirmation of any transaction. Opinions, estimates and assumptions expressed herein are made as of the date of this communication and are subject to change without notice. This communication has been prepared based upon information, including market prices, data and other information, believed to be reliable; however, Trade Nation does not warrant its completeness or accuracy. All market prices and market data contained in or attached to this communication are indicative and subject to change without notice.

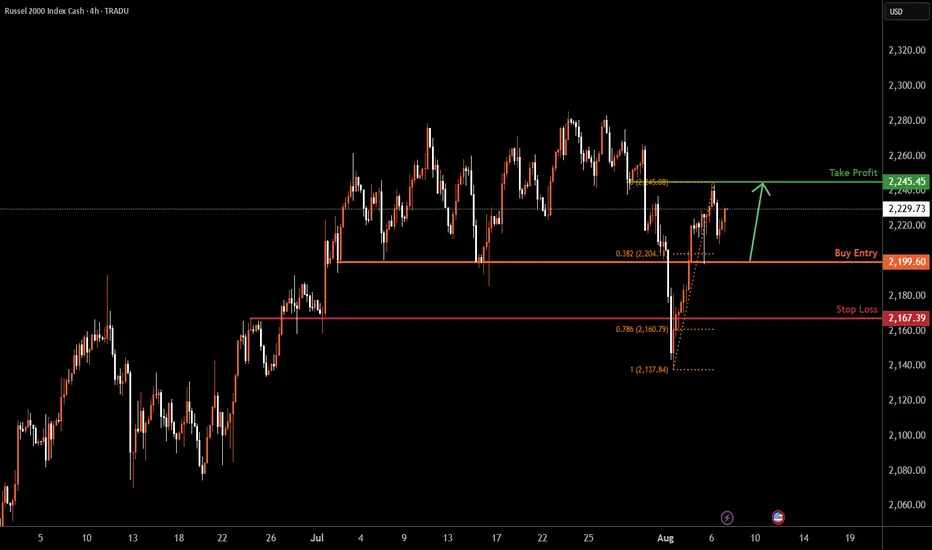
US2000 H4 | Bullish bounce offBased on the H4 chart analysis, we could see the price fall towards the buy entry which is a pullback support and could bounce to the take profit.
Buy entry is at 2,199.60, which is a pullback support that is slightly below the 38.2% Fibonacci retracement.
Stop loss is at 2,167.39, which is a pullback support that is slightly above the 78.6% Fibonacci retracement.
Take profit is at 2,245.45, which is a pullback resistance.
High Risk Investment Warning
Trading Forex/CFDs on margin carries a high level of risk and may not be suitable for all investors. Leverage can work against you.
Stratos Markets Limited (tradu.com ):
CFDs are complex instruments and come with a high risk of losing money rapidly due to leverage. 65% of retail investor accounts lose money when trading CFDs with this provider. You should consider whether you understand how CFDs work and whether you can afford to take the high risk of losing your money.
Stratos Europe Ltd (tradu.com ):
CFDs are complex instruments and come with a high risk of losing money rapidly due to leverage. 66% of retail investor accounts lose money when trading CFDs with this provider. You should consider whether you understand how CFDs work and whether you can afford to take the high risk of losing your money.
Stratos Global LLC (tradu.com ):
Losses can exceed deposits.
Please be advised that the information presented on TradingView is provided to Tradu (‘Company’, ‘we’) by a third-party provider (‘TFA Global Pte Ltd’). Please be reminded that you are solely responsible for the trading decisions on your account. There is a very high degree of risk involved in trading. Any information and/or content is intended entirely for research, educational and informational purposes only and does not constitute investment or consultation advice or investment strategy. The information is not tailored to the investment needs of any specific person and therefore does not involve a consideration of any of the investment objectives, financial situation or needs of any viewer that may receive it. Kindly also note that past performance is not a reliable indicator of future results. Actual results may differ materially from those anticipated in forward-looking or past performance statements. We assume no liability as to the accuracy or completeness of any of the information and/or content provided herein and the Company cannot be held responsible for any omission, mistake nor for any loss or damage including without limitation to any loss of profit which may arise from reliance on any information supplied by TFA Global Pte Ltd.
The speaker(s) is neither an employee, agent nor representative of Tradu and is therefore acting independently. The opinions given are their own, constitute general market commentary, and do not constitute the opinion or advice of Tradu or any form of personal or investment advice. Tradu neither endorses nor guarantees offerings of third-party speakers, nor is Tradu responsible for the content, veracity or opinions of third-party speakers, presenters or participants.
Russell2000 Key Trading LevelsKey Support and Resistance Levels
Resistance Level 1: 2256
Resistance Level 2: 2273
Resistance Level 3: 2282
Support Level 1: 2200
Support Level 2: 2177
Support Level 3: 2140
This communication is for informational purposes only and should not be viewed as any form of recommendation as to a particular course of action or as investment advice. It is not intended as an offer or solicitation for the purchase or sale of any financial instrument or as an official confirmation of any transaction. Opinions, estimates and assumptions expressed herein are made as of the date of this communication and are subject to change without notice. This communication has been prepared based upon information, including market prices, data and other information, believed to be reliable; however, Trade Nation does not warrant its completeness or accuracy. All market prices and market data contained in or attached to this communication are indicative and subject to change without notice.