USTECH100CFD trade ideas

Nasdaq correction trendThe overall trend of the Nasdaq is bullish, but at the moment we can expect a bearish reaction by reacting to the MPL supply ranges until the price reaches good demand ranges.

NAS100 4H🔹 Overall Outlook and Potential Price Movements
In the charts above, we have outlined the overall outlook and possible price movement paths.
As shown, each analysis highlights a key support or resistance zone near the current market price. The market’s reaction to these zones — whether a breakout or rejection — will likely determine the next direction of the price toward the specified levels.
⚠️ Important Note:
The purpose of these trading perspectives is to identify key upcoming price levels and assess potential market reactions. The provided analyses are not trading signals in any way.
✅ Recommendation for Use:
To make effective use of these analyses, it is advised to manually draw the marked zones on your chart. Then, on the 15-minute time frame, monitor the candlestick behavior and look for valid entry triggers before making any trading decisions.

Your childhood goes everything against TRADING!🌱 Growing up vs. Trading
As kids, life drilled one thing into us: WIN, WIN, WIN.
Walk and talk fast – WIN
Get top grades – WIN
Buy the best cars & houses – WIN
Land the dream job & make big money – WIN
👉 Losing? Not even on the table.
But then comes TRADING… and the rules flip.
Here, you actually need to LOSE to WIN.
Small losses = stepping stones to bigger gains.
Consistency + persistence = long-term success.
🔥 The New Rule of Trading
Accept losses – they’re part of the game.
Cut them quick – protect your capital.
Learn from each one – losses = tuition fees for success.
Think of it like a board game…
Every time you “lose a turn,” you’re not failing – you’re moving closer to the BIG win.
Sounds backwards? That’s the paradox that makes trading magical.
⚡ We Weren’t Raised to Take Risks
As kids: “Play it safe!”
As traders: “Embrace risk – but make it calculated.”
Here’s the secret sauce:
Know your risk tolerance – maybe 0.5%–2% per trade.
Diversify – never stack all your eggs in one basket.
Use stop losses – cut risk, lock in gains, stay alive in the game.
🧠 Trading = A Whole New Mindset
Not about avoiding losses but managing them.
Not about avoiding risks but embracing calculated ones.
Not about ego but strategy, patience, and persistence.
💡 Final Word
Trading humbles us.
We shed the ego.
We lose battles but win wars.
We stay consistent.
We accept the small hits… because they’re the price we pay for the BIG victories.
👉 Love your losses. Respect them.
Because every small “L” is one step closer to your biggest “W.”
Disclosure: I am part of Trade Nation's Influencer program and receive a monthly fee for using their TradingView charts in my analysis.

Nas100 Trading ZonesZone 1 – Shallow Overhead Supply
This area has acted as resistance, but with limited data at all-time highs, its reliability is questionable. Sellers may step in here, yet it should be treated as a soft reference point rather than a strong supply zone. Any breakout could easily invalidate it.
Zone 2 – Fragile Support / Momentum Pivot
This level has shown price reactions, but lacks the characteristics of a strong buy zone. It’s better viewed as a short-term pivot area. If broken, it could attract further selling pressure, but traders should avoid relying on it as solid support.
Zone 3 – Yesterday’s Low / Liquidity Pocket
Yesterday’s low provides a natural liquidity zone where buyers may attempt to step in. Still, the strength of this level is limited. Reactions may be sharp but unstable, and a clean break lower could fuel further downside momentum.
The sharp pullback in the Nas100 yesterday looks to be driven by profit-taking after the Fed’s rate cut, combined with Powell’s cautious tone on inflation and growth. With the index trading at record highs, volatility was elevated and many traders used the news as an opportunity to lock in gains. For now, the move appears more like a healthy correction within an uptrend, but key support zones will need to hold to prevent a deeper reversal.

NasdaqToday's price action can tell us a lot about the trend and future movements. After the drop to 24200, an uptrend line formed and resistance at 24470. If this trend continues, we can expect a breakout of this resistance and the key 24500 level. After confirmation, the Nasdaq could reach its highs again. Remember that on the daily chart, we are still in a strong bullish trend. Happy trading!

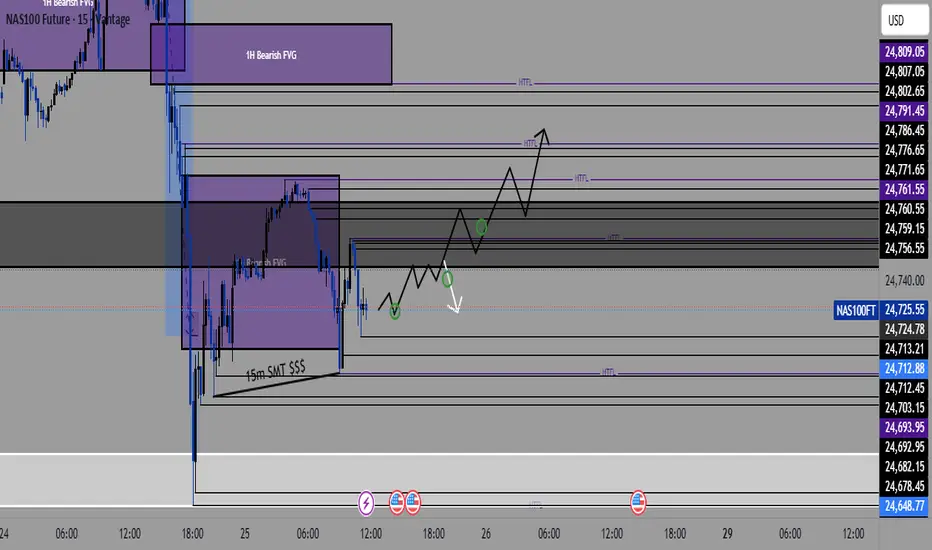
NAS100 (15-Minute Timeframe)🔍 Key Levels to Watch:
Bullish Setup 👇: After a dip in price, we've seen potential accumulation at the 15-minute FVG (Fair Value Gap), setting up for a possible bounce. 🟢
Bearish Resistance ⬆️: Price is currently interacting with a 1-hour Bearish FVG, with potential for further downside if resistance holds. ⛔️
🔵 Potential Trade Plan:
Look for a Pullback: Price could retrace to the higher time-frame resistance zones around 24,791.45 (HTFL) or 24,786.45.
Key Entry Points: Focus on price action near the 15-minute FVG, which may give us a clearer bullish confirmation. 🟢
Target Zones: Aiming for 24,791.45 and higher based on overall momentum.
🔥 Stay alert and trade wisely! Always use proper risk management.
Greetings,
MrYounity
RR=2.5 Sell ideaBearish butterfly pattern + RSI divergence + PRice bounced back on resistance
: Expecting the price to correct , potential target 61.8% fib retracement
PS : never risk more than 2% of your capital per trade


Nas100 Trade Set Up Sep 24 2025I will want to see price sweep SSL followed by a 1m IFVG/CISD to take higher to 4h FVG/Supply
www.tradingview.com

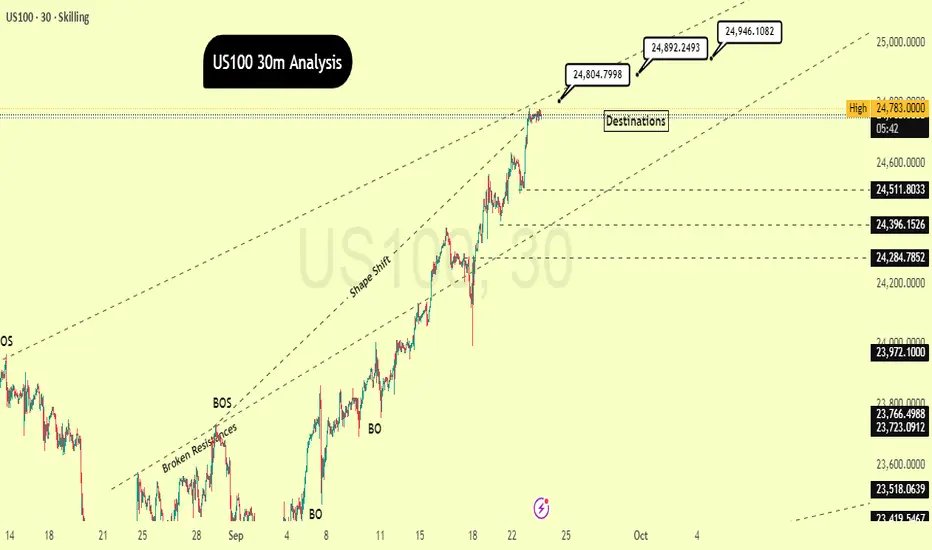
"Reaching Our First Target: What's the Next Step?"By scrutinizing the US100 chart on the30-minutes timeframe, it's evident that the price has initiated a powerful uptrend after surmounting several resistance zones. This is substantiated by the explicit "BOS" (Break of Structure) points, signaling that the market is consistently forging new, higher peaks. The "Shape Shift" noted on the chart indicates a transformation in market character, transitioning from a period of consolidation or a downtrend into a fresh, vigorous bullish impulse.
The price is currently nearing a pivotal resistance point around 24,783.0000. Should the price manage to breach and maintain a position above this threshold, we can anticipate a continuation of the upward trajectory. The prospective targets, labeled as "Destinations," are, 24804.7998, 24,892.2493 and , with an additional high-level objective at 24,946.1082.
I'd appreciate it if you could show your support through likes and comments to encourage me to share more analysis with you, and please share your perspective on the potential direction of this chart with me!
With Respect:
SimarEdgeTrading

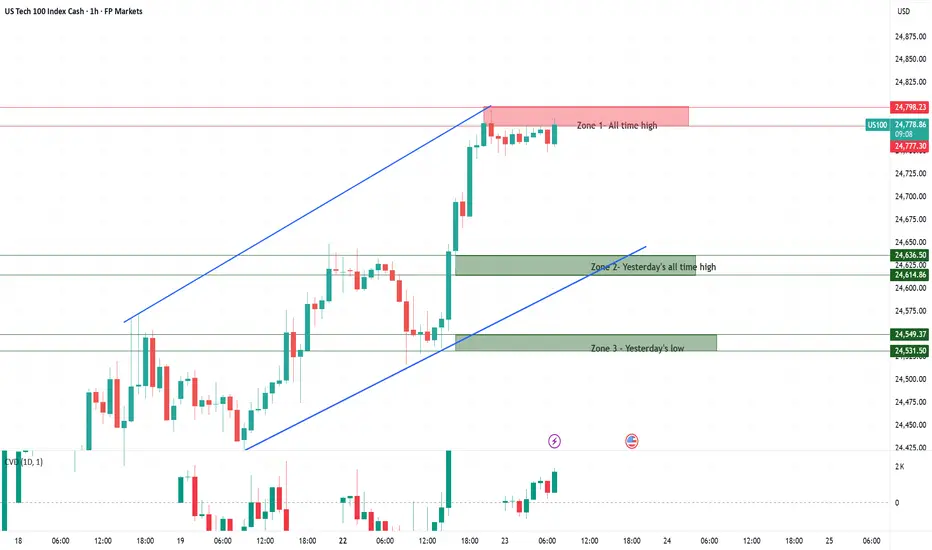
Trading Nas100 at Record Highs The Nasdaq-100 is currently trading at fresh all-time highs, which naturally makes it more difficult to identify strong, well-tested support and resistance levels. With limited historical price action to lean on, these zones should be viewed as guidelines rather than exact buy or sell levels. Traders should remain cautious and flexible in their execution.
Zone 1 – All-time high & yesterday’s high:
This area represents the current record high and the most immediate point of resistance. Price action here is uncharted territory, so reactions can be volatile. A breakout above this zone would confirm continued strength, while rejection could trigger short-term pullbacks.
Zone 2 – Yesterday’s all-time high:
This former high now acts as a potential reference support. If tested, it may attract buyers looking to defend the trend, but given the lack of historical confirmation, reliability remains limited.
Zone 3 – Yesterday’s low:
This marks the lower boundary of recent price action and serves as the next potential support area. If broken decisively, it could indicate fading momentum and open the door for a deeper retracement.
Nas100 is trading near record highs with strong momentum driven by the tech sector, especially AI leaders like Nvidia. The overall sentiment remains bullish, but traders should watch for potential consolidation as the index approaches resistance and technical indicators signal overbought conditions. Regulatory headlines and Fed rate-cut expectations could act as key catalysts for volatility.

Nas100: Trading Zones at Record HighsKey Zones in Focus
Zone 1 – All-time high area:
This zone marks the current all-time high and therefore acts as immediate resistance. Price has already tested this area, and sellers may attempt to defend it, leading to potential rejection or short-term pullbacks. A clean breakout and sustained hold above this level would confirm bullish continuation into uncharted territory, opening the door for further upside momentum.
Zone 2 – Demand zone:
This zone represents a recent consolidation cluster where both buyers and sellers were actively positioning. As the breakout unfolded, this area shifted from resistance to support. Short-term buyers are likely to step in here to defend the trend. A decisive break back below this zone, however, would weaken bullish conviction and could trigger a deeper retracement toward lower levels.
The sentiment around the US100 has turned more optimistic following last week’s Federal Reserve meeting, where the central bank cut interest rates by 25 basis points — the first rate cut since December 2024. This concrete policy move has reinforced investor confidence that monetary conditions are shifting toward a more supportive stance. At the same time, strong momentum in the technology sector, highlighted by new AI-focused partnerships and improving trade signals between the U.S. and China, has further boosted risk appetite. While some caution remains regarding the pace of future cuts and macroeconomic headwinds, the overall market tone is positive, with traders viewing the recent policy shift as a catalyst for continued strength in the Nasdaq-100.

NASQAD Weekly NASQAD 📊 Weekly Market Outlook
On this pair, we see a strong confluence forming on the Weekly timeframe:
✔️ Weekly Fair Value Gap (FVG)
✔️ Strong Weekly Order Block
✔️ Fibonacci retracement alignment
This zone is a high-probability area to watch. If price taps into this level, we’ll look for confirmation on lower timeframes before executing a buy setup.
Smart traders wait for price action to confirm before entering patience here can make all the difference.

Nasdaq-100 (NDX) Weekly Chart 2025 Chart Context
This weekly timeframe analysis of the Nasdaq-100 Index (NDX) forms a key pillar in our 2025 macro analysis series. Following the breakout structure seen in TOTAL, TOTAL2, BTC.D, and US10Y, this chart utilizes 2 Fibonacci tools (1 trend-based extensions and 1 retracement) to project potential corrective and expansion scenarios.
Fibonacci Tools Used:
Fibonacci Retracement : Applies to the recent smaller swing to determine micro retracement zones and cluster supports.
0=20674 and 100=10504
Trend-Based Fibonacci Extension: Drawn using a three-leg structure (point A= 3993 to B=16724 to C10504) to forecast upside targets beyond ATH.
All take-profit (TP) levels: TP1 (~23,400), TP2 (~26,700), and TP3 (~30,344.49)—are located at confluence zones where Fibonacci levels from different tools align, reinforcing their validity and strength.
There is a 4TP above all the Visible TPs
Key price references:
0% retracement: ~20,674.71
Next Resistance ~23,400 (confluence of extensions and psychological resistance)
Projected TPs:
1TP=~23,400,
2TP=~26,700,
3TP=~30,344.49,
4TP=44000
Support/Resistance:
Red zone: ~16,700–18,300 (historical S/R and correction target and Fib Confluences)
Resistance zone: ~23,000–23,400 ,
22000(ATH area)
Key Technical Observations:
Fibonacci Retracement from ~20674 to ~15732 marks the initial corrective range.
Trend-Based Extensions forecast:
TP1 (~23,400): First breakout resistance
TP2 (~26,700): Medium-term expansion zone
TP3 (~30,344): Long-term target if macro tailwinds persist
Scenario Pathways:
Bullish Continuation: Breaks above ATH to reach TP2/TP3
Healthy Correction: Pullback to ~20,600 or deeper ~18,300 before resumption
Deep Correction: Revisits ~16,700 zone if macro environment deteriorates
Fundamental Context:
Tech Stocks & Economic Sentiment: NDX is often the first to move during liquidity expansions. Its performance signals risk-on behavior across global equity markets.
Rate Cuts in 2025: With anticipated Fed rate cuts, tech stocks are primed for inflows. Forward earnings valuations rise, justifying extended upside in high-beta tech.
AI Boom & Earnings Growth: Nasdaq is heavily weighted toward AI, cloud, and semiconductors—sectors expected to lead earnings surprises.
NDX Influence on Gold and Crypto
When NDX rallies:
Crypto: Risk appetite improves. Capital rotation flows into altcoins and layer-1 assets.
Bitcoin: Often sees parallel inflows, especially during strong tech rallies (e.g., 2020).
TOTAL & TOTAL3: Begin breakout patterns if NDX continues to surge.
Gold: May stall or correct as investors favor risk assets. However, gold still holds due to macro hedging and real yield pressures.
When NDX corrects:
Crypto: Volatility spikes. Altcoins bleed faster.
Bitcoin: Short-term dip but may decouple if viewed as digital gold.
Gold: Benefits from flight-to-safety behavior.
US10Y: Often reacts inversely to NDX moves—used for confirmation.
Search Highlights (2024–2025):
Institutions view NDX correction as signal to rotate into commodities (incl. gold).
Cross-market correlations show NDX peaks often precede crypto mini-rallies.
De-risking from NDX often triggers gold strength, especially in geopolitical or inflationary backdrops.
Bias & Strategy Implication
Primary Bias: Bullish
Expecting upside continuation to 26,700–30,000 zone
Multiple correction opportunities are present even during rally
Strategic Actions:
Monitor for correction to yellow/red zones for accumulation
Use NDX behavior as leading macro signal for crypto rotations
Watch resistance at 23,400 closely; breakout confirms trend extension
Time Horizon
Short-Term (1–2 months): Watch for breakout or correction to ~20,600–18,300
Mid-Term (3–6 months): Probable test of ~26,700
Long-Term (6–12 months): Potential expansion to ~30,344.49

Who find this 3monthly candle trend line fascinating?short term 26665 long term 30030
26665 Oct 2025 if not 27958 Jan 2026 if not then April 2026
s3.tradingview.com

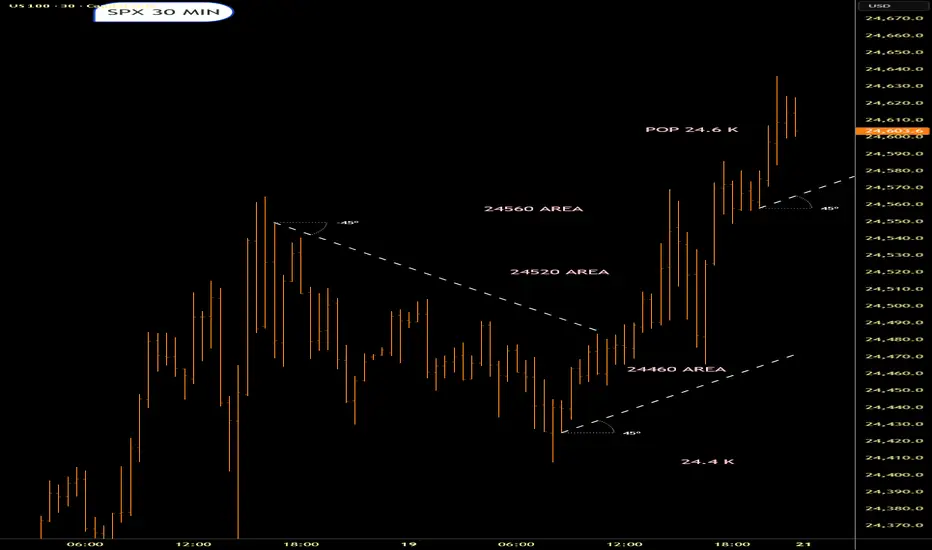
Naz 100 into the new weekWe either pop 24.6K or test those lower poss supp areas.Lets see what happens

nas100 4hTrading Perspectives for the Upcoming Week
In this series of analyses, we have reviewed short-term trading perspectives and outlooks.
As can be seen, in each analysis there is a significant support/resistance zone near the current asset price. The market’s reaction to or break of this level will determine the future price trend up to the next specified levels.
Important Note: The purpose of these trading perspectives is to examine key price levels and the market’s potential reactions to them. The analyses provided are by no means trading signals!

Buy Opportunity Nas100Nas100 is bullish, therefore, this coming week we still looking for buys.
A lot of buyers will step into the market on the 3rd touch of the trend line, but the market will take those buyers out because there is a demand zone and liquidity below the trend line.
I believe the market will break the trend line, go towards the demand zone, and grab liquidity below that demand zone before continuing in its bullish momentum. It might even go towards the daily key level at 23900 before continuing up. Therefore, once we reach the demand zone, it is important that we drop to lower time frames and look for buying opportunities, being mindful of the liquidity zone. Do not take an aggressive entry, look for change of character on lower time frames before taking a buy position.
