17.09.2025 US100 H1 Long
Good morning, everyone,
U100 H1 Long
Only tradable on HTF in my opinion. BP, why waste time and energy on small counter trades when it can be so easy?
Yes, it can go wrong, of course... but the trend is your friend.
Today's news is therefore only tradable in my opinion; everything else is too risky for me.
USTECH100CFD trade ideas

Again, with short term NAS 100 idea.Risk Reward ratio is one of the most important things in trading, never forget to apply safety measures to every trading plan you have.

NAS100 H4 | Bullish continuation in playUS100 has bounced off the buy entry at 23,984.23, which is a pullback support and could rise from this level to the upside.
Stop loss is at 23,721.86, which is an overlap support.
Take profit is at 24,853.60, which aligns with the 61.8% Fibonacci projection.
High Risk Investment Warning
Trading Forex/CFDs on margin carries a high level of risk and may not be suitable for all investors. Leverage can work against you.
Stratos Markets Limited (tradu.com ):
CFDs are complex instruments and come with a high risk of losing money rapidly due to leverage. 65% of retail investor accounts lose money when trading CFDs with this provider. You should consider whether you understand how CFDs work and whether you can afford to take the high risk of losing your money.
Stratos Europe Ltd (tradu.com ):
CFDs are complex instruments and come with a high risk of losing money rapidly due to leverage. 66% of retail investor accounts lose money when trading CFDs with this provider. You should consider whether you understand how CFDs work and whether you can afford to take the high risk of losing your money.
Stratos Global LLC (tradu.com ):
Losses can exceed deposits.
Please be advised that the information presented on TradingView is provided to Tradu (‘Company’, ‘we’) by a third-party provider (‘TFA Global Pte Ltd’). Please be reminded that you are solely responsible for the trading decisions on your account. There is a very high degree of risk involved in trading. Any information and/or content is intended entirely for research, educational and informational purposes only and does not constitute investment or consultation advice or investment strategy. The information is not tailored to the investment needs of any specific person and therefore does not involve a consideration of any of the investment objectives, financial situation or needs of any viewer that may receive it. Kindly also note that past performance is not a reliable indicator of future results. Actual results may differ materially from those anticipated in forward-looking or past performance statements. We assume no liability as to the accuracy or completeness of any of the information and/or content provided herein and the Company cannot be held responsible for any omission, mistake nor for any loss or damage including without limitation to any loss of profit which may arise from reliance on any information supplied by TFA Global Pte Ltd.
The speaker(s) is neither an employee, agent nor representative of Tradu and is therefore acting independently. The opinions given are their own, constitute general market commentary, and do not constitute the opinion or advice of Tradu or any form of personal or investment advice. Tradu neither endorses nor guarantees offerings of third-party speakers, nor is Tradu responsible for the content, veracity or opinions of third-party speakers, presenters or participants.

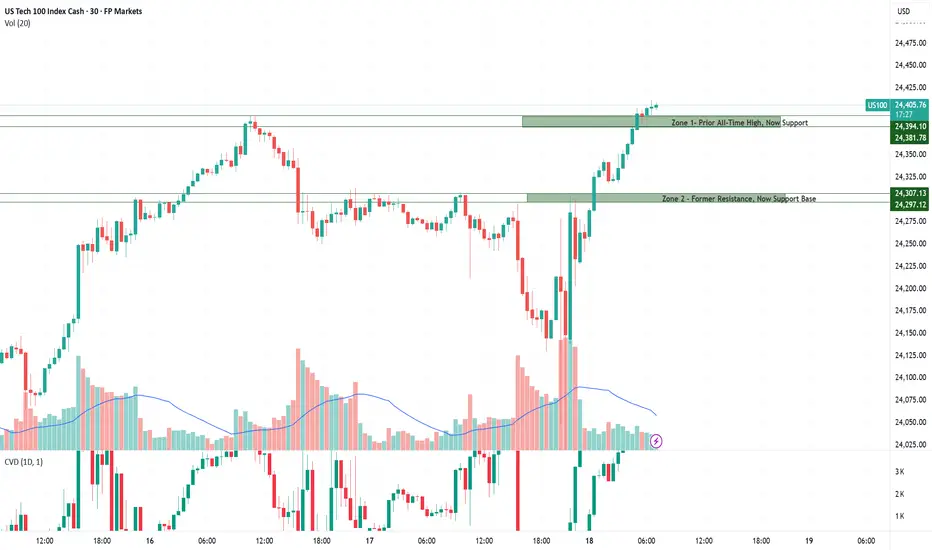
Nas100 - Trading zones at all time highWith price pushing into fresh all-time highs, reliable technical zones become harder to define due to the lack of historical data. This increases uncertainty and makes it essential to treat the zones as guidance rather than fixed buy or sell levels. Volatility tends to rise around record territory, so traders should remain cautious.
Zone 1 – Prior All-Time High, Now Support:
Yesterday’s all-time high has now turned into a support zone after being broken to the upside. This level may hold as a launchpad for further bullish continuation, but traders should remain cautious — if price drops back below, it could trigger a sharp reversal.
Zone 2 – Former Resistance, Now Support Base:
This area has been tested multiple times, making it a high-activity zone. Yesterday it acted as resistance, but after being broken, it now serves as support. Buyers may defend this area on a retest, but if it fails, momentum could shift quickly to the downside.
This area has been tested multiple times, making it a high-activity zone. Yesterday it acted as resistance, but after being broken, it now serves as support. Buyers may defend this area on a retest, but if it fails, momentum could shift quickly to the downside.
Market sentiment turned cautiously optimistic after the Fed delivered its first 25bp rate cut of the year, lowering the policy rate to 4.00–4.25%. Hopes for further easing later in 2025 are supportive for growth stocks and the Nasdaq-100, yet Powell’s remarks highlighted lingering risks from both inflation and a cooling labor market. As a result, volatility remains elevated, and while the bias is tilted higher, confidence in sustained momentum is still fragile.
Nas100 Trade Set Up Sep 17 2025www.tradingview.com
Price swept PDL already and has come up but there is a 1h FVG that it will need to invert to go any higher to PDH or price will push lower, target SSL before possibly coming back up

NSDQ100 awaits Fed rate decision supported at 23940Nasdaq 100 Trading Takeaways
Fed in focus: Markets expect a 25bp cut today, though risks of larger/smaller moves exist with potential dissents on both dovish and hawkish sides. Trump’s newly sworn-in appointee Miran may push for 50bp, while Schmid could dissent hawkishly. This adds event risk and volatility for tech stocks.
Macro backdrop: Trump state visit to the UK highlights investment pledges and a potential US-UK tech partnership, which could support sentiment in large-cap tech.
Market moves:
S&P 500 (-0.13%) pulled back from record highs.
Nasdaq leadership held firm: Magnificent 7 (+0.55%) hit a new record, showing resilience even as breadth weakened.
Broader weakness evident – third straight day of more decliners than advancers.
Sector divergence: Energy (+1.73%) outperformed on higher Brent crude (+1.53%), but tech still provided upside leadership.
Implication for Nasdaq 100:
Short-term: Expect heightened sensitivity to Fed outcome – dovish signals/50bp risk would boost mega-cap tech, while hawkish dissent could trigger profit-taking.
Medium-term: Tech remains the relative outperformer, with new highs in the Magnificent 7 signaling continued defensive growth positioning despite weaker breadth.
Key Support and Resistance Levels
Resistance Level 1: 24470
Resistance Level 2: 24600
Resistance Level 3: 24800
Support Level 1: 23940
Support Level 2: 23760
Support Level 3: 23430
This communication is for informational purposes only and should not be viewed as any form of recommendation as to a particular course of action or as investment advice. It is not intended as an offer or solicitation for the purchase or sale of any financial instrument or as an official confirmation of any transaction. Opinions, estimates and assumptions expressed herein are made as of the date of this communication and are subject to change without notice. This communication has been prepared based upon information, including market prices, data and other information, believed to be reliable; however, Trade Nation does not warrant its completeness or accuracy. All market prices and market data contained in or attached to this communication are indicative and subject to change without notice.

Naz 100 .Bulls are there.Rez is loomingTrend is up.No sign of a turn as yet.Could quite easily pop higher

Nas100 – Today's Trading Zones Analysis 17 sep.Trading Zones
As price trades around all-time highs, the amount of historical data to build strong zones is limited. This makes the current levels less reliable, and traders should approach them primarily as guidance rather than decisive turning points.
Zone 1 – All-Time High / Yesterday’s High:
This area marks the recent record peak. While it can act as resistance in the short term, its strength is uncertain due to limited data. Price reactions here may be volatile and driven more by sentiment than structure.
Zone 2 – Yesterday’s Low:
A lighter support level that can provide intraday reactions but lacks deep structural confirmation. Best used as a reference point rather than a major decision area.
Zone 3 – Strong Support / High Profitability for Momentum:
This is the most significant zone on the chart, where strong buyers have previously stepped in. It carries a higher probability of triggering a strong reaction. That reaction could unfold as a bounce higher if demand holds, or as a sharp move lower if the zone breaks decisively.
All eyes are on today’s Fed meeting , where markets widely expect a 25bp rate cut. While the move is largely priced in, the real focus will be on Powell’s tone and the updated dot plot, which will guide expectations for the pace of easing ahead. Sentiment in the US100 remains cautiously optimistic, supported by strong tech momentum and softer inflation data, but with price trading at record highs, volatility is likely to spike if the Fed delivers any surprises.

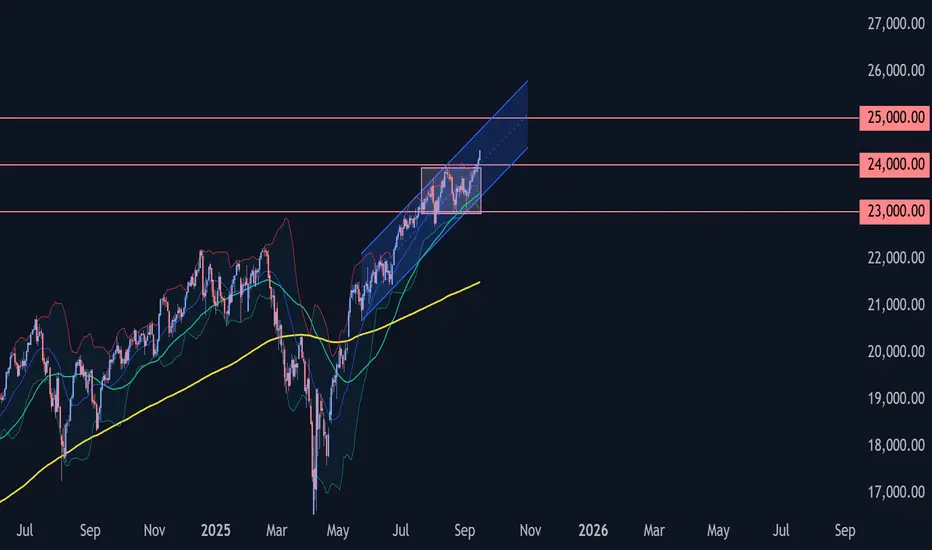
What Could Derail the Nasdaq 100 Uptrend?The chart shows the US100 (Nasdaq 100, daily timeframe) extending its bullish momentum within a rising channel. Here’s the breakdown:
Trend & Structure:
The index has been in a steady uptrend since rebounding from its April lows, with price action respecting the boundaries of the ascending channel. It remains above both the 50-day SMA (23,416) and the 200-day SMA (21,481), confirming strong bullish structure.
Support Levels:
The lower channel boundary around 23,500 is immediate dynamic support.
The 50-day SMA provides further backing below that.
A key horizontal support is at 21,150, near the 200-day SMA, which marks the broader trendline base.
Resistance Levels:
The upper channel boundary near 24,500 is the immediate resistance.
A breakout above this region could extend gains toward 25,000, the next psychological target.
Momentum Indicators:
MACD remains positive, confirming upward momentum.
RSI (68.7) is approaching overbought levels but still has room before signaling exhaustion.
Outlook:
The Nasdaq 100 remains firmly bullish, with higher highs and higher lows supporting the trend. While the RSI hints at stretched conditions, momentum remains strong, and as long as price holds above 23,500, the path of least resistance points toward 24,500–25,000.
-MW


Volume YepA repeating pattern whereby the Swing occurs bearish this time, but instead of a single eye, e wait for either a retracement to the gap that will form after the current 4H candle and continue bearish, or we wait to see what happens on a great bullish candle that we have that led to our setup failing, because that is where in this case Volume is.

Of course. Here is the English translation of the US100 (Nasdaq Of course. Here is the English translation of the US100 (Nasdaq 100 Index) analysis:
The US100 Nasdaq 100 Index, which aggregates the world's top technology and non-essential consumer giants, is a core benchmark for gauging growth stocks and market risk appetite. Its trajectory is highly correlated with U.S. Federal Reserve monetary policy and is exceptionally sensitive to interest rate expectations; any clue about rate cuts can trigger significant volatility. The index's weight is heavily concentrated in the "Magnificent Seven," making their individual earnings reports and progress in the field of AI decisive driving forces for the index.
Currently, the index shows strong momentum after reaching new historical highs, but technical indicators are already showing signs of being overbought, with the 18,000 point level becoming a key psychological and technical resistance. High valuations make it more vulnerable to negative news shocks. Looking ahead, the US100 will be locked in a fierce battle between the narrative of AI innovation and the pressure of high interest rates. Whether the upward trend can continue depends on whether the giants' profits meet expectations and whether the Fed successfully executes a policy pivot. Investors should be wary of pullback risks amid high valuations and closely monitor the earnings of leading companies and inflation data.

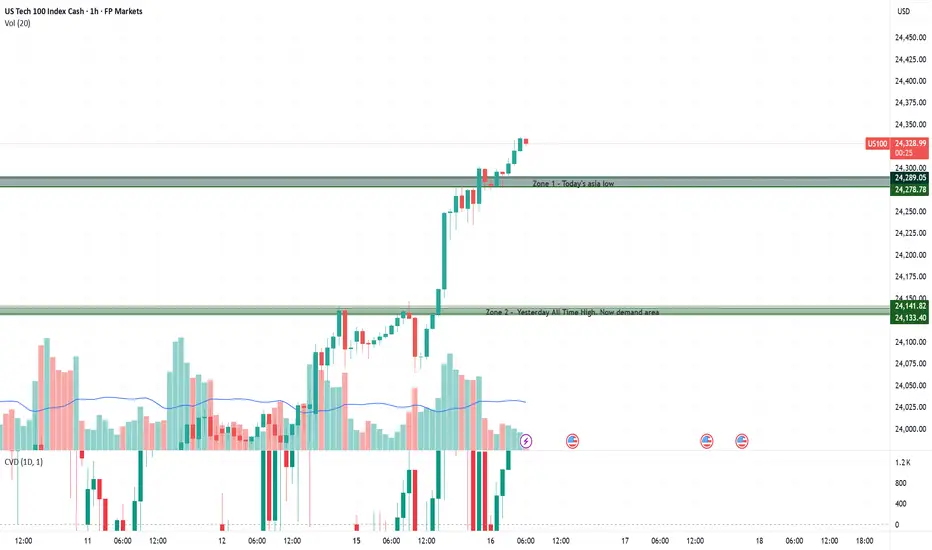
NAS100 Trading Zones – Navigating All-Time HighsThe Nasdaq is trading at all-time highs, which means there are no established sell zones above. In this environment, price is in full discovery mode. Every new tick higher sets fresh records, and volatility often picks up as traders probe for tops. That makes it difficult to fade strength, shifting the focus toward demand zones below as key areas for potential pullbacks.
🔹 Zone 1 – Today’s Asia Low (24,278–24,289)
This zone marks the intraday low from the Asian session and serves as the nearest short-term demand. A revisit here could attract buyers for a bounce, while a decisive break lower would signal loss of momentum and invite deeper retracement.
🔹 Zone 2 – Yesterday’s All-Time High, Now Demand (24,133–24,141)
Yesterday’s record high has flipped into a demand zone. As long as price holds above this level, the bullish structure stays intact. A strong rejection here favors continuation higher, but failure to hold could open the door to sharper downside.
Sentiment in the US100 remains cautiously optimistic. Softer labor data and easing producer prices have strengthened expectations of Fed rate cuts, while strong momentum in select tech names, including Oracle’s upbeat cloud outlook, continues to drive the index higher. Still, with price trading near all-time highs, volatility is elevated and the backdrop fragile, leaving traders mindful that optimism rests heavily on the Fed delivering on dovish expectations.
Nasdaq-100 Wave Analysis – 15 September 2025
- Nasdaq-100 broke key resistance level 24000.00
- Likely to rise to resistance level 25000.00
Nasdaq-100 index recently broke above the key resistance level 24000.00 (upper border of the narrow sideways price range inside which the index has been trading from July).
The breakout of the resistance level 24000.00 accelerated the active impulse wave v of the higher order impulse wave 5 from June.
Given the clear daily uptrend, Nasdaq-100 index can be expected to rise to the next resistance level 25000.00, target for the completion of the active impulse wave v.
NDX SHORT 1HHarmonic Bearish Divergence at D Point.
Expeting it will break its HL and make start printing few LL LH

UntaggedWe were not tagged because the market did not draw to the zone, went just for the Gap, we move on!

2000 vs 2008 vs 2022 - Are we yellow?Where do you think we are? Red? Or Green?
Are we at a bottom before we see a blow-off top coming?
Or are we in recessionary beginnings like 2008?

Nas100 Trade Set Up Sep 15 2025www.tradingview.com
Price broke PDH and has made a ATH so i will wait for a pull back in to the zone before looking for a continuation higher

NAS100 - Stock market awaits Federal Reserve meeting!The indicator is above the EMA200 and EMA50 on the one-hour timeframe and is in its long-term ascending channel. If the drawn upward trajectory is maintained, I can expect the future to continue as it has in the past. In case of a valid breakdown, its downward path is to the specified range, which can be approached with a reward for buying.
Last week’s economic data painted a mixed picture of the U.S. economy. On the one hand, new jobless claims rose to 263,000, above the market forecast of 235,000, signaling labor market weakness. On the other hand, the August inflation report came in hotter than expected, though most of the increase stemmed from housing costs rather than tariff pressures. Rents rose 0.34%, marking the fastest gain since December 2024, while shelter costs climbed 0.39%, the sharpest jump since January 2025. Still, real-time housing indicators suggest that prices are adjusting, which will likely be reflected in official data in the coming months.
Meanwhile, the yield on the U.S. 10-year Treasury fell below 4% for the first time since April—a sign that markets are reacting more to labor market weakness and the prospect of Fed rate cuts than to inflation concerns.
CIBC, analyzing the August Consumer Price Index (CPI) report, stated that while the data came in slightly above expectations, it was not strong enough to dissuade the Federal Open Market Committee (FOMC) from delivering a 25-basis-point cut next week. Ali Jafari, an economist at the bank, wrote: “There was little in the report to prevent a September rate cut. More importantly, the labor market needs support, and a weaker jobs market implies softer demand-side inflationary pressures ahead.”
On a yearly basis, core inflation held steady at 3.1%, while headline inflation rose two-tenths to 2.9%, both in line with forecasts. More troubling, however, are signs that price increases are spreading into new sectors. The report noted: “Tariff pass-through effects intensified this month, with core goods prices rising at the fastest pace since broad tariffs were imposed. Today’s report also showed the first notable increase in new car prices, suggesting that tariff impacts may now be extending to higher-ticket items, though overall car price gains remain modest.”
CIBC expects the Fed to cut rates in September and October, pause afterward, and then deliver two additional cuts in the first half of next year. The bank added: “The overall U.S. inflation picture remains notably above target, but the Fed is willing to tolerate this for now, given growing concerns about a weakening economy and a labor market showing signs of fatigue.”
Separately, U.S. President Donald Trump once again criticized the Fed in an interview with Fox News, saying the central bank “always acts late on interest rates.” He added: “We have the best stock market in history. Inflation has come down, equities are climbing, so rates should be lower.”
These comments come as the Fed is widely expected to cut rates at Wednesday’s meeting. While such a move could reduce borrowing costs in the short term, analysts caution that lower short-term rates do not necessarily translate into lower long-term yields.
Morgan Stanley now projects that the Fed will cut rates by 25 basis points at each of the three remaining meetings this year—an upgrade from earlier forecasts of only September and December cuts. The bank also expects three additional 25-basis-point cuts in January, April, and July of 2026.
At the same time, Standard Chartered has revised its outlook and now anticipates a 50-basis-point cut in September—double its previous forecast. The shift followed weak August jobs data showing employment growth had slowed sharply and unemployment rose to 4.3%, the highest since late 2020. The bank described labor market conditions as “dramatic,” noting that in just six weeks the market shifted from “strong” to “weak.” It characterized the larger cut as a form of “catch-up” to align monetary policy with economic realities.
This week is set to be pivotal for global markets, with a series of central bank decisions and key economic releases. Monday will see the Empire State manufacturing index, followed by Tuesday’s August retail sales report. On Wednesday, housing starts and building permits will be released, along with the Bank of Canada’s rate decision. The highlight of the week, however, will be the Fed meeting and Jerome Powell’s press conference.
On Thursday, the Bank of England will announce its policy decision, followed by U.S. jobless claims and the Philadelphia Fed manufacturing survey. The busy week will conclude Friday with the Bank of Japan’s policy announcement.

Nas100 – Trading Zones to Watch Near HighsZone 1 – All-Time High Supply (24,133 – 24,142)
This zone sits right at the all-time high, where volatility and liquidity are elevated. Sellers are likely to defend aggressively here, making sharp rejections common. A clean breakout and acceptance above would show strong buyer conviction and could trigger momentum into new record territory.
Zone 2 – High Liquidity Demand (24,014 – 24,026)
This area reflects a high-liquidity pocket where buyers previously absorbed heavy selling pressure. Pullbacks into this zone may attract renewed demand, offering potential long setups. If the zone breaks decisively, however, it risks flipping into resistance and signaling continuation lower.
Sentiment in the US100 remains cautiously constructive. Optimism is fueled by strong tech leadership and expectations of upcoming Fed rate cuts, while softer labor data and cooling producer prices have eased pressure on yields. Still, inflation readings surprised slightly to the upside last week, reminding traders that risks remain. With price now testing all-time highs, volatility is elevated and the market’s mood is fragile momentum is there, but it requires confirmation through clean breakouts rather than relying on hope alone.

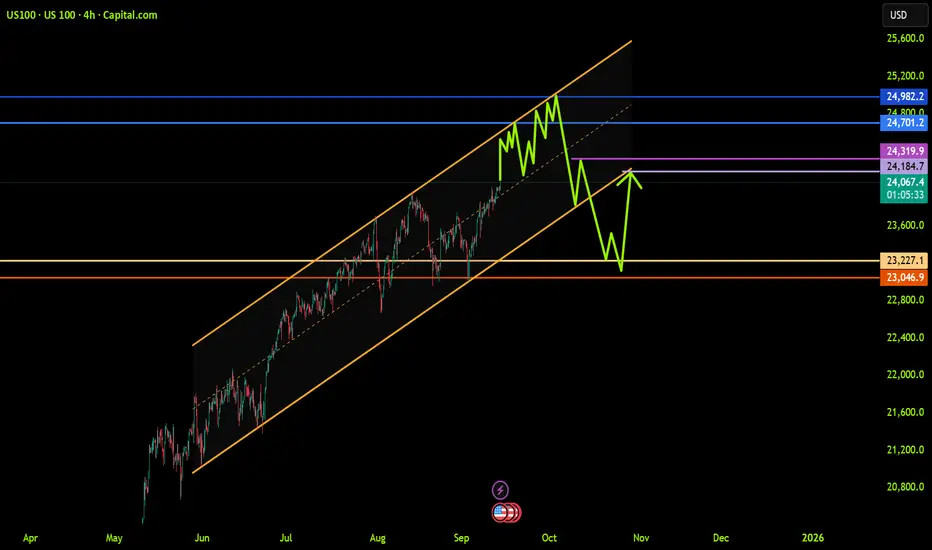
US100 (NDQ): Trend in 4H time framePlease pay special attention to the very accurate trend, colored levels, and very important channel.
Its a very sensitive setup, please be careful.
BEST,
MT
Downtrend Analysisafter we get a retest back to the new all time highs this is one of the set ups I can see setting up on nas. In order for us to confirm the sells I am interested in looking for lower high entries only as we start to make the retest back to the main higher low from last week which is at 23986. im expecting a full retest here due to the federal fund rates

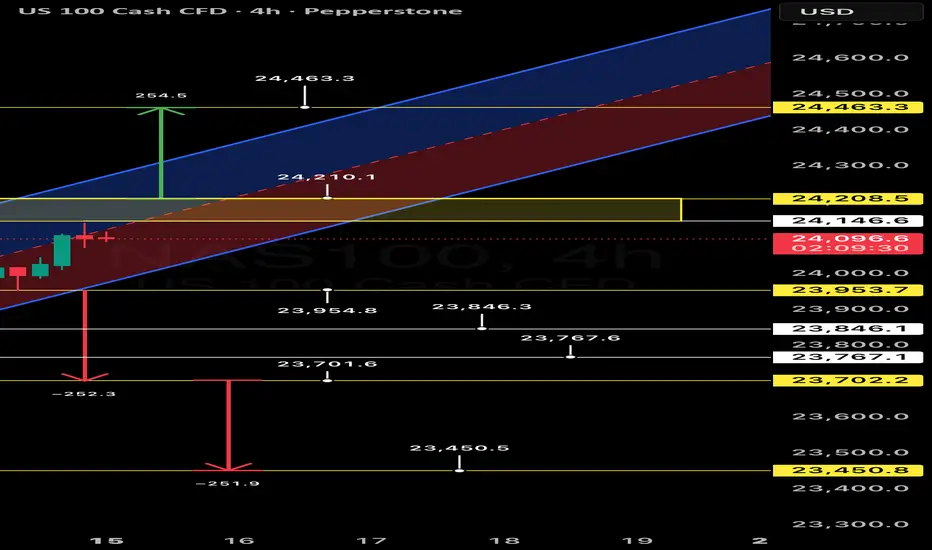
NASDAQ 100: A Tipping Point on the 4H ChartKey Takeaway
NASDAQ 100 (NAS100) is at a critical juncture, hovering at a potential inflection point around the 24,000 level. A clear breakout above or breakdown below this psychological and technical area will likely dictate the next major move for the index, presenting distinct opportunities for both bulls and bears.
Macro View
NASDAQ 100 has been in a strong rising trend channel for the medium to long term, indicating persistent investor optimism. The overall technical outlook remains positive. However, recent price action on the 4hour chart suggests a period of indecision, with the index consolidating just below its recent highs. This consolidation, combined with the emergence of a potential head and shoulders pattern, signals that a significant move is imminent.
Bearish Outlook: A Breakdown Scenario
A breakdown below the key support level at 23,800 would be a significant bearish signal. This level is crucial as it marks the lower boundary of the current consolidation zone.
• Target 1: 23,700 A move below the first key support could quickly see the index test the 23,700 level, which has acted as a previous point of interest.
• Target 2: 23,450 A break of the 23,700 support would confirm a deeper correction, with the next major target being 23,450. This level coincides with a significant volume node and previous support, making it a strong magnet for price.
Risk Management: A stoploss should be placed just above the resistance to mitigate risk in a false breakdown.
Bullish Outlook: A Breakout Scenario
The bullish case is contingent on the index successfully holding the 24,000 psychological level and breaking above the key resistance at 24,208.5.
• Target 1: 24,463 A confirmed breakout would likely propel the index toward the upper boundary of the rising channel, with a primary target of 24,463. This level represents a key extension of the current trend.
• Target 2: 24,600 A decisive move beyond 24,463 would suggest a continuation of the bullish momentum, with a secondary target at 24,600. This level aligns with a major extension and could see the index set new all-time highs.
Risk Management: A stop loss should be placed just below the support to protect against a trend reversal.
Conclusion
NASDAQ 100 is at a pivotal moment. Traders should watch for a clear break in either direction before entering a position. The 24,000 level is a critical pivot, and the ensuing price action will provide a clear roadmap for the market's next move.