USOIL: 08/12/2025 daily analysisOil prices held steady as traders monitored India's increased purchases of Russian crude and Ukraine's stepped-up attacks on Russian energy assets. WTI stayed near $60 after recent gains, while Putin promised uninterrupted fuel shipments to India ahead of US trade talks.
Ukraine’s strikes on energy infrastructure tightened loadings and lifted physical crude prices, but rising global supply from OPEC+ and major producers, such as the US, Brazil, and Guyana, keeps oversupply fears alive. The oversupply of crude oil in 2026 appears to be prevailing, pushing futures toward the low-$60s through 2026. For now, fresh market outlooks from the EIA, IEA, and OPEC are due this week.
On the technical side, the crude oil price corrected to the downside after finding resistance around the $60 mark, which is the psychological resistance of the round number as well as the 38.2% of the daily Fibonacci retracement level. Currently, it is testing the support of the 50-day simple moving average, while the Stochastic oscillator is moving towards neutral territory. The moving averages are validating the overall ebarish trend while the Bollinger Bands are sufficiently expanded to support any significant move in the short term.
Disclaimer: The opinions in this article are personal to the writer and do not reflect those of Exness
Trade ideas

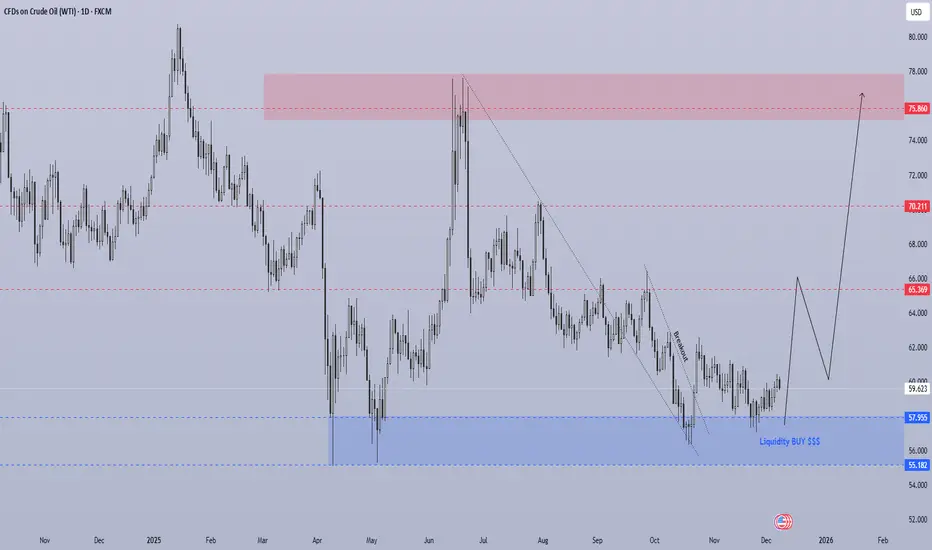
USOIL - WTI - D1Market Structure
Oil has been in a long-term downtrend, but the chart now shows a clear break of the descending trendline, signaling a potential trend reversal.
Price reacted strongly from the blue liquidity zone (55.18 – 57.95) — a major demand area where institutions often buy.
This zone has now formed a double bottom / accumulation structure, indicating strong bullish interest.
2. Key Zones
🔵 Demand Zone (Liquidity BUY Area)
55.18 – 57.95
Multiple liquidity sweeps below 58.00.
Strong reversal candles confirmed buyers.
This is the base for the upcoming bullish leg.
🔴 First Major Resistance / Target
65.36
Previously strong support → now resistance.
Likely first stop for the new bullish trend.
🔴 Second Target Zone (Medium-term)
70.21
Previous major swing level.
A strong resistance zone where partial profits make sense.
🔴 Final High-Probability Target Zone (Premium Supply)
75.86 – 78.00
Large supply area.
Strong reaction expected here.
Best area for large players to sell again.
3. Price Action Outlook
Main Scenario – Bullish Reversal (High Probability)
Price has broken out of the descending structure.
A clean retest or shallow pullback is expected above 58–60 USD.
Strong bullish leg toward:
✔ TP1: 65.36
✔ TP2: 70.21
✔ TP3: 75.86 – 78.00 (Major target zone)
Why bullish?
Break of trendline = momentum shift.
Liquidity sweep at major demand zone.
Multiple rejection wicks show strong buyer control.
No bearish continuation structure forming.
CRUDE OIL (WTI): Confirmed BoS
I see a confirmed bullish break of a significant daily structure
and a candle close above that on WTI Crude Oil.
With a high probability, the market will continue rising and
reach 60.65 resistance soon.
❤️Please, support my work with like, thank you!❤️
I am part of Trade Nation's Influencer program and receive a monthly fee for using their TradingView charts in my analysis.

Market Analysis: Oil Price Gains TractionMarket Analysis: Oil Price Gains Traction
Crude oil price is recovering and it could climb further higher toward $62.00.
Important Takeaways for Oil Price Analysis Today
- Crude oil prices are moving higher above the $59.00 resistance zone.
- There is a connecting bullish trend line forming with support at $59.40 on the hourly chart of XTI/USD.
Oil Price Technical Analysis
On the hourly chart of WTI Crude Oil, the price started a decent increase against the US Dollar. The price gained bullish momentum after it settled above $58.20.
The bulls pushed the price above the 50-hour simple moving average, and the RSI climbed toward 70. The price tested the $60.20 zone and is currently consolidating gains. There was a minor pullback below $60.00, and the price tested the 23.6% Fib retracement level of the upward move from the $58.20 swing low to the $60.20 low.
Immediate resistance is near $60.20. If the price climbs further higher, it could face bears near $60.50. The next key area of interest might be $61.20. Any more gains might send the price toward $62.00.
Conversely, the price might correct gains and test $59.40. There is also a connecting bullish trend line forming with support at $59.40 and the 50-hour simple moving average.
The main bid area on the WTI crude oil chart could be $59.00 and the 61.8% Fib retracement. If there is a downside break, the price might decline toward $58.20. Any more losses may perhaps open the doors for a move to $57.20.
This article represents the opinion of the Companies operating under the FXOpen brand only. It is not to be construed as an offer, solicitation, or recommendation with respect to products and services provided by the Companies operating under the FXOpen brand, nor is it to be considered financial advice.

Bearish reversal off overlap resistance?WTI Oil (XTI/USD) is rising towards the pivot, which is an overlap resistance and could reverse to the 1st support.
Pivot: 62.24
1st Support: 56.51
1st Resistance: 65.75
Disclaimer:
The opinions given above constitute general market commentary and do not constitute the opinion or advice of IC Markets or any form of personal or investment advice.
Any opinions, news, research, analyses, prices, other information, or links to third-party sites contained on this website are provided on an "as-is" basis, are intended to be informative only, and are not advice, a recommendation, research, a record of our trading prices, an offer of, or solicitation for, a transaction in any financial instrument and thus should not be treated as such. The information provided does not involve any specific investment objectives, financial situation, or needs of any specific person who may receive it. Please be aware that past performance is not a reliable indicator of future performance and/or results. Past performance or forward-looking scenarios based upon the reasonable beliefs of the third-party provider are not a guarantee of future performance. Actual results may differ materially from those anticipated in forward-looking or past performance statements. IC Markets makes no representation or warranty and assumes no liability as to the accuracy or completeness of the information provided, nor any loss arising from any investment based on a recommendation, forecast, or any information supplied by any third party.

USOIL, Big Money Breaks Defense, Bullish Continuation SetupPrice has officially broken above the Big Money protection zone after multiple strong reactions at the VShark Order Block.
Rising volume confirms real participation, not a false breakout.
This structure shift signals a renewed bullish phase for USOIL.
Buy zones are defined as follows:
🔵 Buy Zone 1
Fibonacci retracement zone of the new bullish leg, optimal area for continuation entries.
🔵 Buy Zone 2
The origin of the current impulse, a deeper accumulation zone if price makes a full pullback.
As long as price holds above the former defense, bullish continuation remains the primary expectation.
VNShark Perspective
We do not chase price after breakout.
We wait where Big Money previously built their positions.

USOIL: Market Sentiment & Price Action
The analysis of the USOIL chart clearly shows us that the pair is finally about to tank due to the rising pressure from the sellers.
Disclosure: I am part of Trade Nation's Influencer program and receive a monthly fee for using their TradingView charts in my analysis.
❤️ Please, support our work with like & comment! ❤️
wti 1h🔹 Overall Outlook and Potential Price Movements
In the charts above, we have outlined the overall outlook and possible price movement paths.
As shown, each analysis highlights a key support or resistance zone near the current market price. The market’s reaction to these zones — whether a breakout or rejection — will likely determine the next direction of the price toward the specified levels.
⚠️ Important Note:
The purpose of these trading perspectives is to identify key upcoming price levels and assess potential market reactions. The provided analyses are not trading signals in any way.
✅ Recommendation for Use:
To make effective use of these analyses, it is advised to manually draw the marked zones on your chart. Then, on the 5-minute time frame, monitor the candlestick behavior and look for valid entry triggers before making any trading decisions.
Update on the oil analysisBased on yesterday’s analysis on oil, we said it was a good buying opportunity and that the price had a high chance of reaching $62 per barrel. Today, the price didn’t make any significant move, and we’re only seeing a lot of lower wicks on the candles, which is a good sign and shows strong buying interest.
I don’t think there will be any major movement for the rest of tonight, so we’ll keep the position open for next week and see how the move continues.

Daily Market Report — Thursday, Dec 4, 2025📉 Market Moves
WTI (CLF26): +1.22% → 2-week high
RBOB (RBF26): –0.01% → flat-to-negative
Crude rallied on geopolitics + stalled peace talks, while gasoline stayed weighed down by weak demand signals and pricing cuts from Saudi Arabia.
📊 Key Drivers
Bullish Drivers (major upside catalysts)
1. No breakthrough in US–Russia peace negotiations
Market takeaway:
War is not ending soon
Sanctions on Russian energy remain
Expected return of Russian supply is pushed further out
This was the primary reason WTI broke to a 2-week high.
2. High geopolitical tension in Russia + Venezuela
Russia:
Putin threatens to attack ships helping Ukraine
4 Russian tankers hit in Black Sea
Baltic terminal and CPC pipeline disruptions continue
Russia has lost 13–20% of refining capacity
Venezuela:
Trump declares airspace “closed”
Potential U.S. military strikes
This combination adds a multi-regional risk premium that directly supports crude.
3. Russian export collapse continues
Vortexa shows:
Russia product shipments at 1.7m bpd (3-yr low)
Structural supply tightness persists.
4. OPEC+ pauses increases for Q1-2026
This ensures:
No new supply coming
Market won't be flooded during a surplus-risk period
Bullish because it caps non-Russian supply growth.
5. Rig count collapse (4-year low)
US production risk tilts mildly downward:
Rigs now at 407, down from 627
Signals lower US output in future months
Bearish Drivers (limiting or reversing price strength)
1. Saudi Arabia cuts OSP to Asia → lowest in 5 years
This is a big demand signal:
Aramco cutting Arab Light by 30 cents
Lowest pricing since Jan 2021
Market interprets as weak Asian demand
This was the top bearish driver of the session.
2. Stronger dollar (intraday reversal from multi-week lows)
Dollar rose through the session → capped crude gains and flipped RBOB red.
3. Floating storage at a 2.5-year high
Vortexa:
124.64 million bbl, +12% w/w
The highest since mid-2023
Reinforces the “market saturated” narrative.
4. OPEC + IEA highlight global surplus outlook
OPEC’s Q3 revision → +500k bpd surplus
IEA’s 2026 surplus outlook → +4.0m bpd
Underlying long-term sentiment remains bearish.
📝 Post-Mortem — Thursday, Dec 4, 2025
Why WTI broke to a 2-week high?
War isn’t ending → sanctions remain
Russian tanker attacks escalate supply risk
CPC + terminal disruptions keep pressure on flows
Risk-on sentiment early session
OPEC+ supply cap confirmed
These outweighed the bearish factors.
Why gasoline closed flat-to-negative?
Because gasoline is demand-led:
Saudi OSP cut = huge demand warning for Asia
Dollar strengthened intraday → imports more expensive
Crack spreads soften when economic signals weaken
Thus gasoline diverged from crude and closed red.
What the session tells us
The physical supply side remains tight, but not tightening further.
The demand side is weakening, with Saudi pricing cuts confirming it.
Market is now extremely headline-sensitive, especially around peace talks.
Expect jerky, volatile sessions until clarity emerges from either:
Peace negotiations
Russia export flows
Saudi pricing shifts
OPEC+ messaging
US macro data

U.S. Crude Oil (WTI) The upside barrier is located at $59.66
U.S. crude Oil continues to post mixed results as we hold within the corrective channel formation.
We have a resistance zone between $59.66 and $59.80.
Price in this area continues to attract the sellers.
We could be analysed as holding within a large Wyckoff accumulation zone. This would have an eventual bias to break to the upside.
A 261.8% extension level is currently located at $58.22. This is close to the base of the range
Conclusion: I would expect continued mixed and volatile trading. I look for rallies to be sold within the resistance zone

Bullish breakout?WTI Oil (XTI/USD) is reacting off the pivot, which acts as a pullback support that aligns with the 50% Fibonacci retracement and could bounce to the 1st resistance.
Pivot: 59.54
1st Support: 59.01
1st Resistance: 60.82
Disclaimer:
The opinions given above constitute general market commentary and do not constitute the opinion or advice of IC Markets or any form of personal or investment advice.
Any opinions, news, research, analyses, prices, other information, or links to third-party sites contained on this website are provided on an "as-is" basis, are intended to be informative only, and are not advice, a recommendation, research, a record of our trading prices, an offer of, or solicitation for, a transaction in any financial instrument and thus should not be treated as such. The information provided does not involve any specific investment objectives, financial situation, or needs of any specific person who may receive it. Please be aware that past performance is not a reliable indicator of future performance and/or results. Past performance or forward-looking scenarios based upon the reasonable beliefs of the third-party provider are not a guarantee of future performance. Actual results may differ materially from those anticipated in forward-looking or past performance statements. IC Markets makes no representation or warranty and assumes no liability as to the accuracy or completeness of the information provided, nor any loss arising from any investment based on a recommendation, forecast, or any information supplied by any third party.


CRUDE OIL Local Short! Sell!
Hello,Traders!
CRUDE OIL price is reacting inside a major supply zone, suggesting a potential shift as liquidity begins to unwind. If orderflow confirms, price may slide back toward the target level as SMC dynamics align with bearish distribution. Time Frame 2H.
Sell!
Comment and subscribe to help us grow!
Check out other forecasts below too!
Disclosure: I am part of Trade Nation's Influencer program and receive a monthly fee for using their TradingView charts in my analysis.

Is a sharp move in oil close?A relatively long-term analysis of oil is giving the signal that there’s a possibility of a sharp move down toward $65 per barrel. So on the lower timeframes, we can look for entries and quicker triggers to catch this move. My personal view is that a sharp move is forming.
WTI Crude downtrend continuation resistance at 6980The WTI Crude continues to display a bearish outlook, in line with the prevailing downward trend. Recent price action suggests a corrective pullback, potentially setting up for another move lower if resistance holds.
Key Level: 5980
This zone, previously a consolidation area, now acts as a significant resistance level.
Bearish Scenario (rejection at 5980):
A failed test and rejection at 5980 would likely resume the bearish momentum.
Downside targets include:
5796 – Initial support
5728 – Intermediate support
5667 – Longer-term support level
Bullish Scenario (breakout above 5980):
A confirmed breakout and daily close above 5980 would invalidate the bearish setup.
In that case, potential upside resistance levels are:
6025 – First resistance
6100 – Further upside target
Conclusion
WTI Crude remains under bearish pressure, with the 5980 level acting as a key inflection point. As long as price remains below this level, the bias favours further downside. Traders should watch for price confirmation around that level to assess the next move.
This communication is for informational purposes only and should not be viewed as any form of recommendation as to a particular course of action or as investment advice. It is not intended as an offer or solicitation for the purchase or sale of any financial instrument or as an official confirmation of any transaction. Opinions, estimates and assumptions expressed herein are made as of the date of this communication and are subject to change without notice. This communication has been prepared based upon information, including market prices, data and other information, believed to be reliable; however, Trade Nation does not warrant its completeness or accuracy. All market prices and market data contained in or attached to this communication are indicative and subject to change without notice.

WTI Outlook: Downtrend Bias vs. Bullish HoldFrom a weekly timeframe perspective, crude’s price action has been trending within a downward-sloping parallel channel since October 24, inside a larger downtrending channel from June 2025, which itself sits within an even broader downtrend dating back to December 2023. This multi-layered structure frames the overall bias as bearish and defines the key levels that must be breached to shift the outlook from short-term movements toward a more favorable long-term structure.
Starting with the one-month channel:
• Key upside breakout levels lie at the 60-mark.
• The next resistance sits near the upper boundary of the six-month channel at 62.60.
• A confirmed close above this level could extend gains toward the two-year channel boundary at 66.40 first, then 70, before confirming a longer-term bullish breakout structure.
On the downside, beginning with the one-month channel again:
• A sustained hold below 56 is expected to extend declines toward the six-month channel support at 55.
• A confirmed close below 55 could extend losses toward the original long-term channel boundary at 49, offering another potential buy-the-dip opportunity.
A possible double-bottom reversal pattern could emerge, either from the 55 low or from the 49 low, for a longer-term rebound. However, as long as price remains within the bounds of the downtrending channel established since 2023, the broader bearish bias is expected to persist.
The key levels mentioned above remain the main dividing lines between structural bullish and bearish shifts in crude oil, despite the complex mix of fundamental drivers shaping the market.
- Razan Hilal, CMT

WTI Crude Oil (USOIL) – 30-Minute Analysis1. Bullish Rejection at Support
Price is holding above the 58.40–58.50 demand zone, showing strong rejection and signs of buyer interest.
2. Long Setup Active
Entry: 58.50–58.70
Stop Loss: Below 58.25
Target: 59.90–60.00
This provides a solid risk-to-reward structure.
3. Structure Outlook
Market is attempting to form a higher low. A break above 59.20 may confirm bullish continuation.
4. Key Levels
Support: 58.30 / 58.50
Resistance: 59.20 / 59.60 / 60.00
Short-term bias: Bullish as long as the support zone holds.

US OILHI GUYS
UPDATE ON US OIL H4 HISTORICAL PATH and trading price patterns in detail
i expect sells on a wed, thur price pattern .
lets see what happens


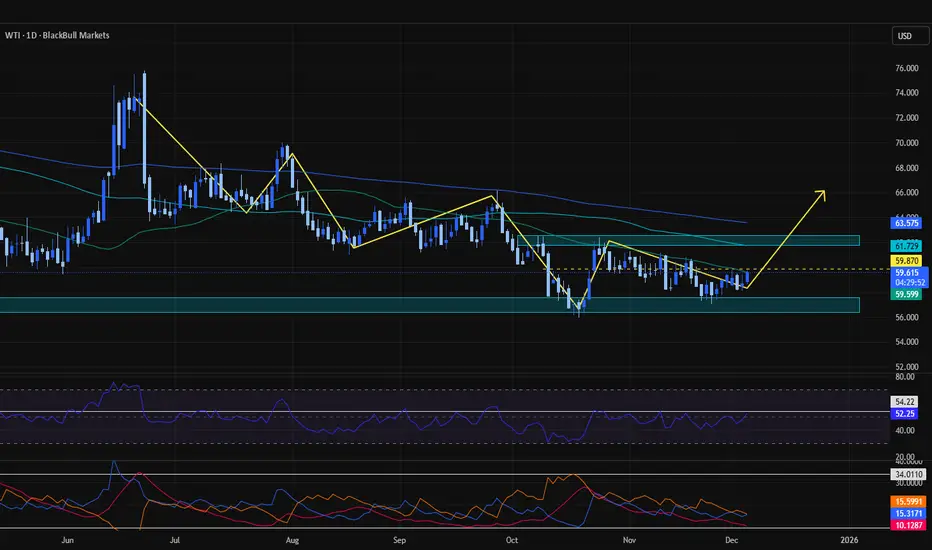
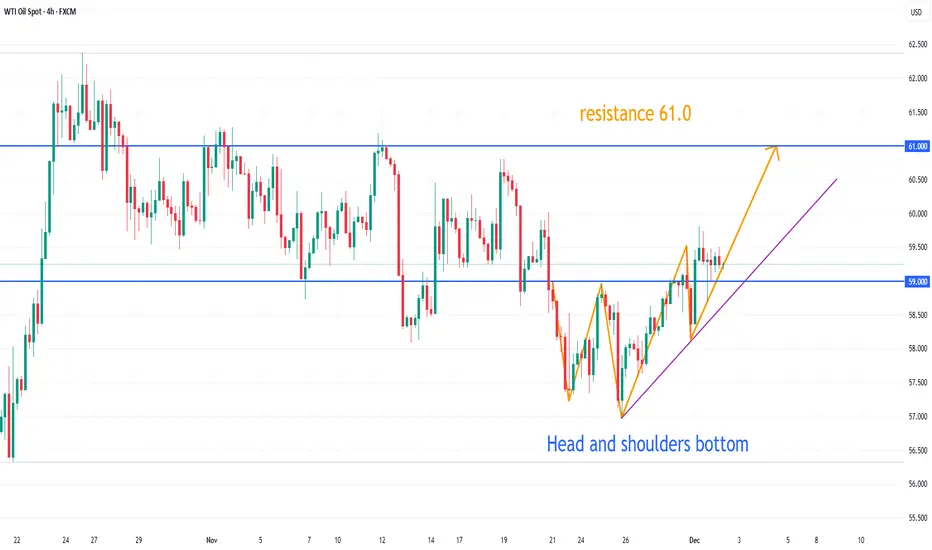
USOIL TP 61.0On the 4-hour chart, USOIL stabilized and then moved upwards, forming a head and shoulders bottom pattern in the short term. Currently, watch for support around 59.0; a pullback and stabilization after this level could present a buying opportunity. Resistance is seen around 61.0.
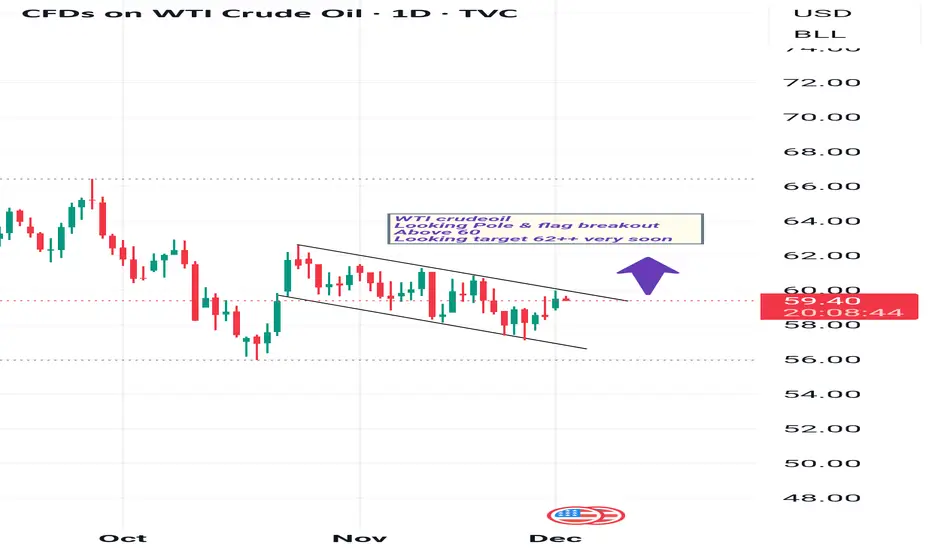
My View On USOIL (wti crudeoil)WTI crudeoil
Looking Pole & flag breakout Above 60
Looking target 62++ very soon
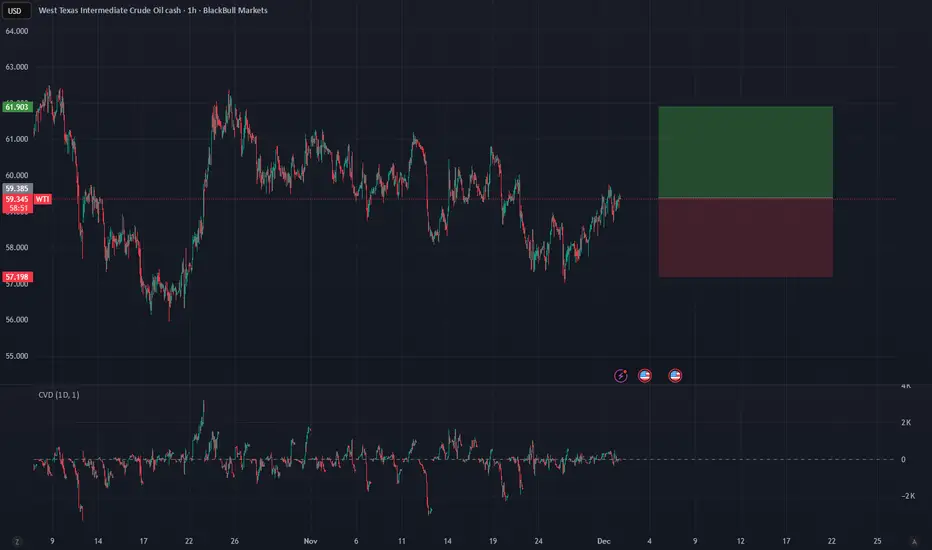
Absorption Pattern & Potential Reversal to $61After a significant downtrend from the $66.00 highs down to the $56.00 region, WTI Crude Oil is showing signs of a structural shift on the 1H timeframe. Here is the technical breakdown suggesting a bullish recovery.
1. Market Structure & Price Action The market has stopped making lower lows. Instead, we have established a Higher Low (HL) at roughly $57.50, compared to the capitulation low at ~$56.00. This is the first sign of a potential trend change. The price is currently reacting aggressively from this support zone, pushing back towards the $59.40 level.
The immediate obstacle is the psychological $60.00 level and the local supply zone around $59.50. A breakout above this area would confirm the reversal.
2. Order Flow & CVD A crucial observation on the lower timeframe data is the divergence between Price and CVD.
The CVD remains negative (Red values on the bottom left), indicating that aggressive market selling is still present.
Interpretation: Despite this selling pressure, price is not making new lows. Instead, it is holding structure and rising.
Conclusion: This indicates Absorption. Large passive buyers (Limit Bids) are absorbing the sell-side liquidity. The sellers are expending effort but getting no result (price drop). Once the sellers are exhausted, the path of least resistance is up.
3. Trade Setup (Long Position)
Based on the absorption at support and the formation of a Higher Low, I am looking for a rotation back to the upper range.
Direction: LONG
Entry Zone: Current Market Price ($59.35) or on a retest of $59.00.
Invalidation / Stop Loss: $57.20.
Reasoning: This is placed below the recent Higher Low structure. If price breaks this level, the absorption thesis has failed, and the downtrend will likely continue to $55.
Target: $61.90.
Reasoning: Major swing high / supply zone.