Nasdaq Short: Peak Confirmed; Bear Market ConfirmedIt is now clear that the bull market ended on 30th Oct and that we have already seen the first completed wave down for Nasdaq that unfolded in clear 5-wave structure. The sub-waves also showed clear 5-wave structure themselves.
We are currently in a wave 2 retracement that is facing the first real support-turned-resistance. However, take note that wave 2 can technically go all the way up to the start of wave 1 without invalidating the idea. So look out for reversal signal or confirmation before you short.
Trade ideas

US100 Resistance Ahead!
HI,Traders !
US100 is making a
Nice bullish correction
After a sharp local flash-crash
But a local horizontal resistance
Level is ahead at 25185.8
So after the retest we will
Be expecting a local
Bearish correction !
Comment and subscribe to help us grow !

US100 (NASDAQ 100) – Short TradeSetup Type: Short Position
Entry: Around 25,650 (Resistance zone)
Stop Loss: 25,787
Target: 24,850
Analysis:
Price is retesting a key resistance zone after a strong impulsive move upward. A rejection from this level could indicate the start of a short-term correction. If bearish confirmation appears (e.g., lower high formation or bearish engulfing candle), short positions could be valid toward 24,850 support.
Bias: Bearish below 25,787
Invalidation: Break and close above 25,787
Hashtags:
#US100 #NASDAQ100 #PriceAction #TradingSetup #BearishSetup #TechnicalAnalysis #TradingView #SmartMoney #ShortTrade #Indices

NAS100 Trade Set Up 1500 pips secured!Price manipulated first above London highs to then come down and sweep SSL/London lows then CISD on the 15m with a retest to buy up to full tp5 1500 pips

NAS100 Trade Set Up Nov 7 2025Price remains bearish so i will only looking for sells either after price sweeps internal BSL or London highs BSL before looking for 1m-5m IFVG/CISD to take sells to lower SSL levels

Nasdaq Catch me on IG @KI113R45 as I'll catch this trade with a Lil amount as R150 testing whether the problem with us traders is with the amount we use or the skill set used🎮🤔🤷♂️👾

NAS100 H1 | Bullish Bounce off Key SupportNAS100 is falling towards our buy entry at 24,841, which is a swing low support level that aligns with the 161.8% Fibonacci extension level.
The stop loss is at 24,664, which is a swing low support level, while the take profit is at 25,102, which is a pullback resistance level.
Stratos Markets Limited (tradu.com/uk ):
CFDs are complex instruments and come with a high risk of losing money rapidly due to leverage. 68% of retail investor accounts lose money when trading CFDs with this provider. You should consider whether you understand how CFDs work and whether you can afford to take the high risk of losing your money.
Stratos Europe Ltd (tradu.com/eu ):
CFDs are complex instruments and come with a high risk of losing money rapidly due to leverage. 70% of retail investor accounts lose money when trading CFDs with this provider. You should consider whether you understand how CFDs work and whether you can afford to take the high risk of losing your money.

US100 MARKET OUTLOOK!US100 had a sharp drop in price recently from in yesterday’s trading session. From the H4 perspective , we’re beginning to see a bearish momentum kick in. I’m looking forward to seeing more price drops. Therefore, a sell opportunity is envisaged.

Nasdaq long then short: Expecting one last wave upIn this analysis, I talk about the wave structure for Nasdaq and highlighted that wave 1 is currently the longest wave and that means wave 5 cannot be longer than wave 3. This gives us a maximum target of 26300 that is already hit on 30th Oct. So while I do expect another up wave for Nasdaq, this will likely be a double top with the same high as 30th Oct before we start on a longer-term move down.

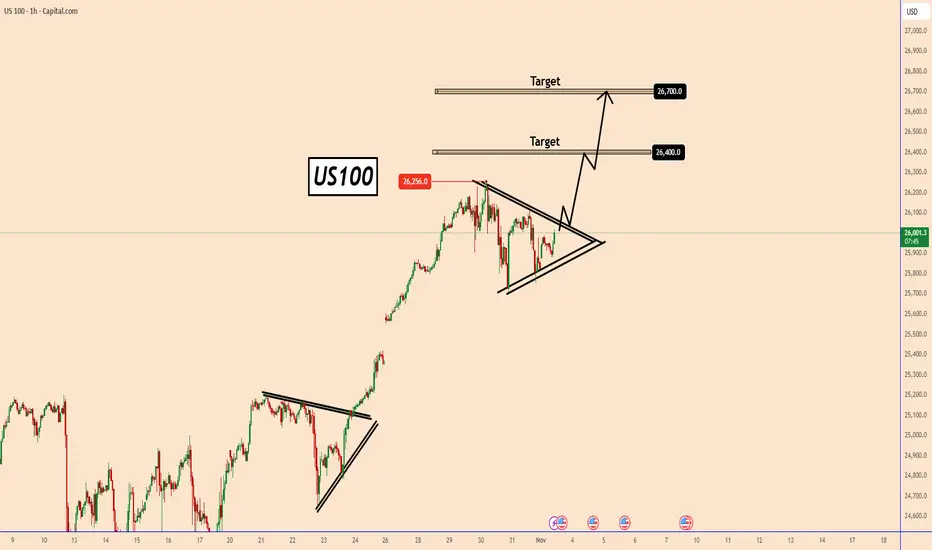
US100 is in a strong uptrend and continues to set new highsUS100 is in a strong uptrend and continues to set new highs.
An all-time high was set last week near 26256, and there is a good chance that US100 will continue to rise.
The price is rallying again and once it moves above the triangle, another uptrend could begin.
Comments from the FED that they may cut rates further in the coming months are supporting the indices by raising hopes and the upward momentum is linked to the booming economy
Key targets:
26400 and 26700
You may find more details in the chart!
Thank you and Good Luck!
❤️PS: Please support with a like or comment if you find this analysis useful for your trading day❤️
NAS100 Trade Set Up Nov 11 2025Price swept PDH and inverted a 4h FVG plus broke structure to the downside on the 1h so i will want to see a internal BSL sweep to then see a continuation lower to SSL and possibly 1h FVG

NAS100 Trade Set Up Nov 5 2025Price remains under bearish pressure as long as price respects this 4h FVG i will look for internal bearish structure on the 1m-5m to take sells to SSL/Asia lows

NDQ100 (15M) Bullish Analysis. (SMC)🧩 Market Context
After a strong bearish move marked by a 1H Fair Value Gap (FVG), the market started to show institutional accumulation.
A Change of Character (ChoCh) and a Break of Structure (BOS) confirm a shift to bullish momentum.
The identified Order Block (OB) acts as a key mitigation point supported by a well-defined support zone.
💥 Entry Idea
• Buy: 25,124
• Stop-Loss: 24,979
• Take-Profit: 25,530
• Risk/Reward: 1 : 2.6
After a Fake Out (bearish liquidity trap), price shows strong bullish reaction, indicating institutional intention to mitigate the OB and reach the Buy-Side Liquidity above.
📊 Technical Confirmations
• The SMA starts to act as a dynamic support.
• Rejection from the OB validates structure change.
• The target (25,530) aligns with a distribution zone and liquidity pool, perfect for partial or full take-profit exits.
🧭 Conclusion
Clean structure, strong institutional logic, and confluences in harmony.
This setup illustrates the accumulation → mitigation → distribution sequence, where the market sweeps liquidity before expanding upward.
A perfect example of professional market reading. 🚀
GOOD LUCK TRADERS 🦾🤓✌🏻

NASDAQ POTENTIAL LONG 2 NOV 2025SWING TRADE
4H structure remains BULLISH
Waiting for the swing PB to look for longs at marked potential entry areas if 15m structure shifts BULLISH in either of these zones.
15m structure is currently BEARISH and will wait for MSS before looking for longs.
I am not interested in shorting the PB but instead going with the trend.
Currently up +-2000 points on NSDQ for SEP and OCT.
Follow me TRADINGVIEW
Insta garethxsavage

NasdaqBullish nasdaq as price went to restest the strong demand zone ans respected the price zone. Now more bullish momentum expected till our initial resistance.

NDX - POTENTIAL PULLBACK IN PLAY - SHORT SHORT INTO LONGGood Morning,
Always trade with risk assessment in mind. You can lose money quickly without an exit strategy. I choose a 7% stop based on my risk.
We are looking for a .5% exhaustion gap into todays market to show initiation of the pullback.
Trade Safely
Enjoy!

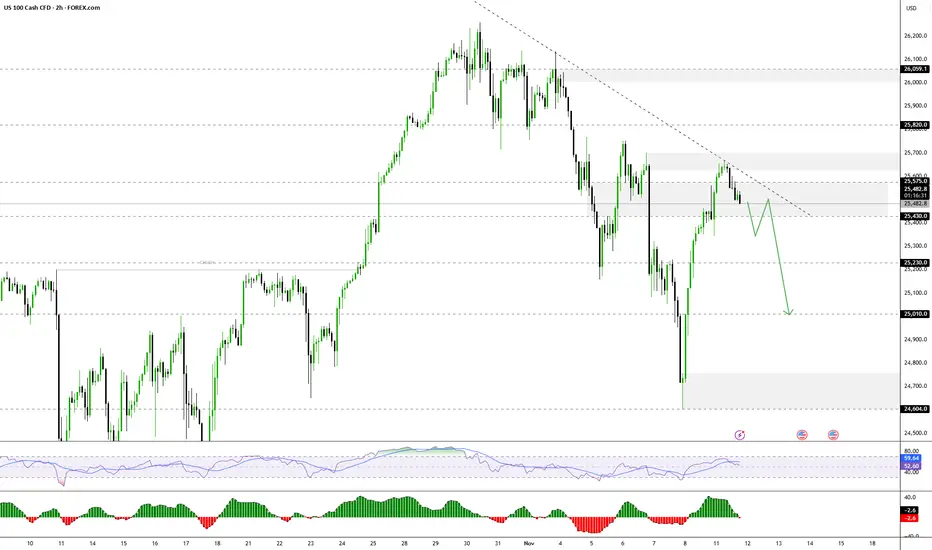
Nasdaq Potential for Further CorrectionThe NASDAQ index currently appears to be in a short-term correction, with the price likely to retest 25430 from 25570 before further movement.
- Above 25430–25575: Bullish continuation towards 25700 → 25820 → 25960.
- Below 25430: Bearish momentum is likely towards 25230 → 25010.
Sellin Zone Nas1001. Daily is bearish
2. 4HR is bearish
3. 2HR is bearish
4. 1HR is bearish
Therefore, we looking for sells. I will enter a sell in the internal supply zone.

NASDAQ Double Top Rejection Still At PlayI do not believe the bears are quite done yet in this market. What I am seeing currently is a bullish correction or retest of this double top rejection.
Momentum to the downside will resume soon enough. For now however, enjoy the ride to the upside - cautiously.
This is a buy to sell setup. My overall bias is bearish.

NAS100 CONTINUE TO BULLISH RALLYTechnically:
1) Trendline broke and then retest
2) Support becane resistance
3) no bearish divergence

New Highs Before a Major Correction?The NASDAQ remains firmly within its main ascending trend channel, respecting both the upper and lower boundaries since mid-2023. After a sharp dip triggered by tariff-related headlines, the index quickly recovered, reaffirming bullish momentum and establishing a new support base along the lower trendline.
We’re now approaching the 2nd Fibonacci extension level drawn from the previous major top to the last significant bottom — a key confluence area that historically signals potential exhaustion of the current leg up.
Based on the current price trajectory, this zone could act as a probable top region, marked by the green resistance box on the chart. If the market reacts here, a technical correction or consolidation phase could unfold, retracing back toward the support zone around the mid-channel (highlighted in green).
The “500 Days Rich Man Theory” line (July 2026) may coincide with a macro cycle inflection point, suggesting a timing window for trend reversal or cooling period before the next long-term advance resumes.

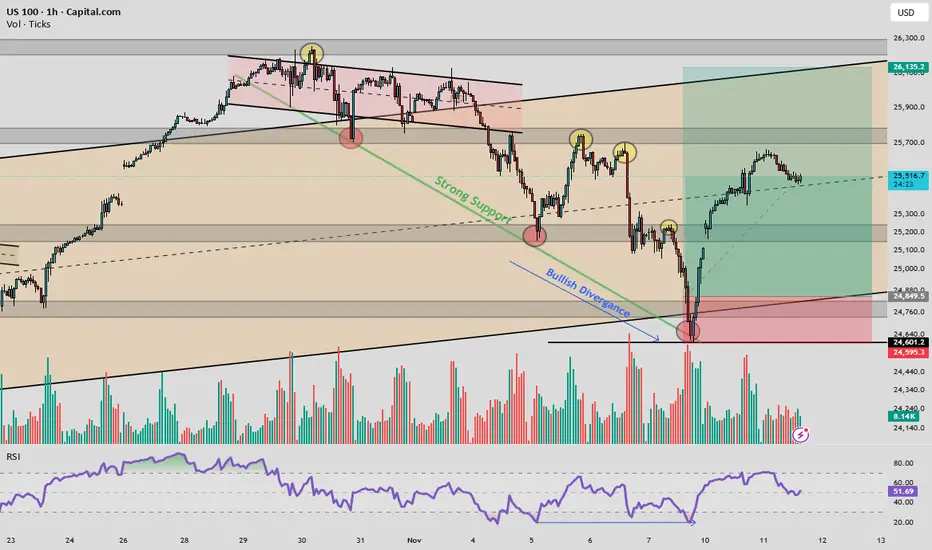
US100: Bullish Divergence Meets Institutional SupportUS100 1H Analysis – Bullish Divergence at Strong Support
Price is compressing within a descending channel, currently testing a multi-touch support zone around 24,730–24,490. Volume shows signs of accumulation, and RSI reveals bullish divergence, hinting at potential reversal. If support holds, a bounce toward 25,900–26,250 is likely. Breakdown below 24,490 invalidates the setup.
Follow @GoldenZoneFX for more content and valuable insights.
Nasdaq-100 Wave Analysis – 10 November 2025- Nasdaq-100 reversed from support level 25000.00
- Likely to rise to resistance level 26250.00
Nasdaq-100 index recently reversed up with the daily Hammer from the support zone between the round support level 25000.00 and the support trendline of the daily up channel from May.
This support zone was strengthened by the 61.8% Fibonacci correction of the sharp upward impulse from October.
Given the clear daily trend, Nasdaq-100 index can be expected to rise to the next resistance level 26250.00 (top of the previous impulse wave i).
