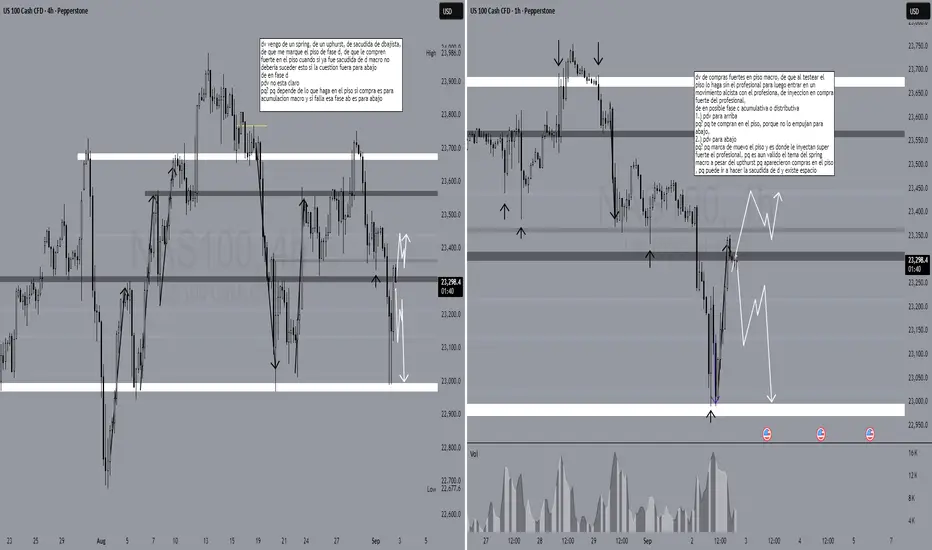
key levels for the nqIf the nq breaks 23362 we have enough information to wait for a shakeout and then enter. if it breaks 23210.7 we got to wait for a retracement and then a shakeout to sell. But, be aware that for sales the target should be more aggressive which means to cover on 23k, and just in case, we can leave a small portion of the position open but cover more than 70% because it might be the macro shakeout.
Trade ideas
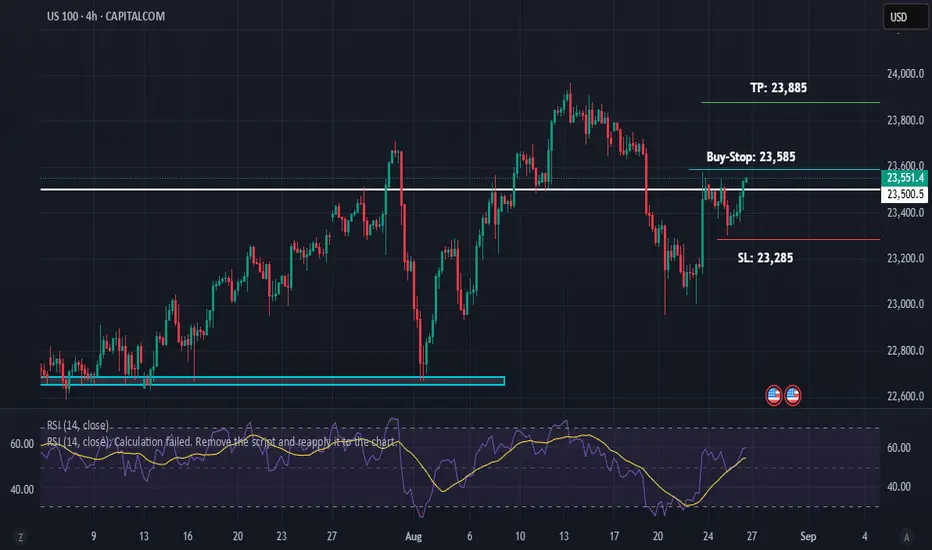
US 100 Buy-Stop, 4H/1D Close Above ResistanceUS 100 has closed above Resistance on 4 Hour and Daily Timeframe.
It is in Bullish Trend on Daily Timeframe. The trend is very likely to continue based on Technicals.
Moreover, it is likely that Federal Reserve will lower the interest rates in the Unied States. If that happens, financial markets will continue the upward trajectory. That however, is a long-term projection. Our trade setup here is just 1:1 but we can see more such trades in the future.
US100 Risky Short! Sell!
Hello,Traders!
US100 made a sharp
Move up and made a
Retest of the horizontal
Resistance of 23,375
From where we will be
Expecting a local bearish
Correction and a move down
Sell!
Comment and subscribe to help us grow!
Check out other forecasts below too!
Disclosure: I am part of Trade Nation's Influencer program and receive a monthly fee for using their TradingView charts in my analysis.

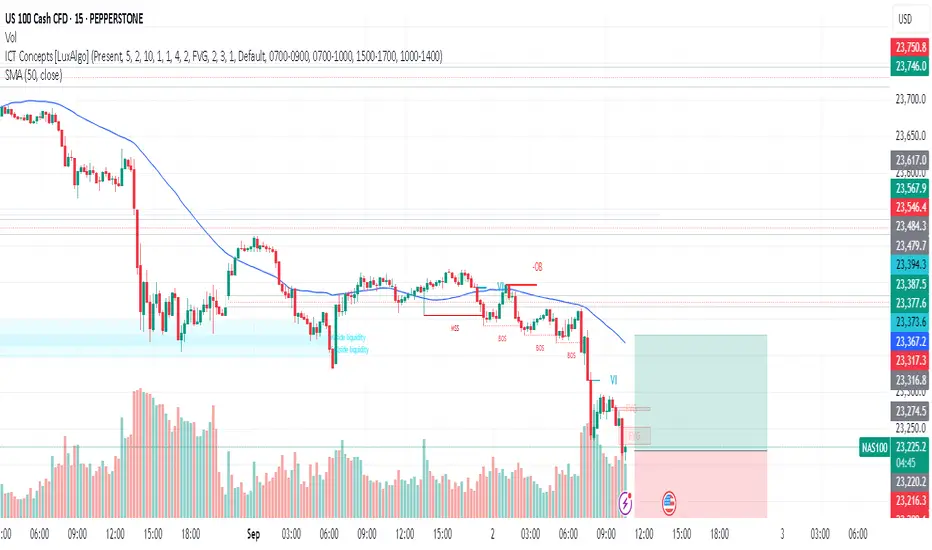
NAS100 SELL 15 MINUTE TIMEFRAMESTRONG SUPPLY ZONE Fair value gaps to fill Amazing Range 3:1 Risk Reward, Let's See!

US100 Consolidating? With raection around 2300 area level, its clear to see that bulls are not ready to let go yet. This purely based of technicals. I'm expecting a bit of a pull to get an entry @ 23211 hopefuly the market will be in our favour.

Explaining Fibonacci Retracement/Extension levelsThis video is designed to help teach you why I use the Fibonacci Defense levels as components of price action and how I use Fibonacci retracement/extension levels (related to previous market trends).
Remember, the three components of price action are TIME, PRICE, & ENERGY.
If you don't understand how price is structured before attempting to use Fibonacci concepts, it's almost like trying to throw darts blindfolded.
You must break down the previous trends in order to try to understand what is happening with current price trends (expansion/contraction/phases).
Watch this video and I hope it helps all of you understand what the markets are doing and how to use Fibonacci Retracement/Extension levels more efficiently.
All types of technical analysis are validation tools - not guarantees. The only thing we get out of technical analysis is a way to validate or invalidate our expectations. A or B. Nothing else.
Get some.
#trading #research #investing #tradingalgos #tradingsignals #cycles #fibonacci #elliotwave #modelingsystems #stocks #bitcoin #btcusd #cryptos #spy #gold #nq #investing #trading #spytrading #spymarket #tradingmarket #stockmarket #silver

NAS100 LongThis is now oversold on all timeframes, showing sellers exhaustion
There is a deep crab pattern on H4 and H1 displaying a potential reversal zone
There is great support at this level as daily trend is also pointing up
Double bottom on M15 showing divergence
Stoploss of 150 pips

Nas100 Trade Set Up Sep 2025FX:NAS100
www.tradingview.com
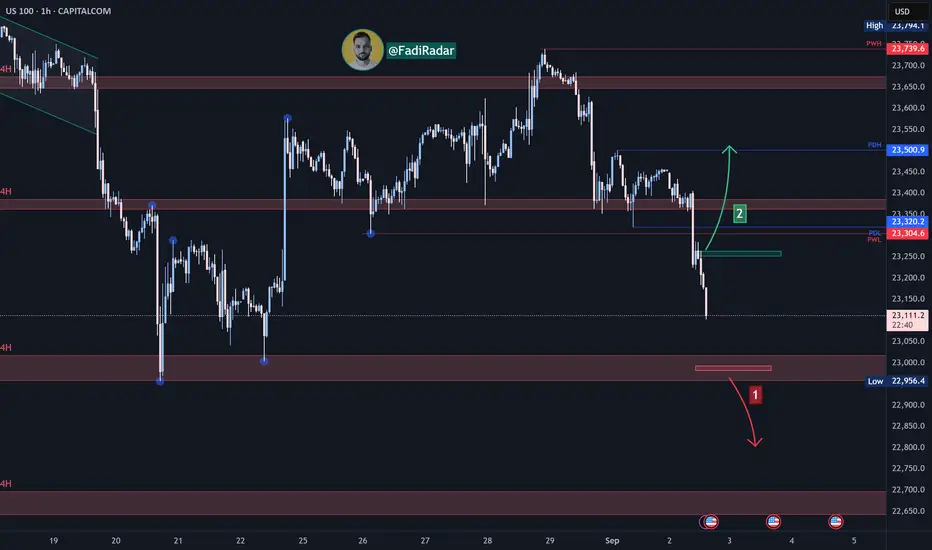
Price broke PDL and approaching daily SSL while making LH/LL so i want to see a slight pull back before continuing lower

NAS100 Long Setup | Demand Zone ReactionPrice action on NAS100 has pulled back into a key demand zone after sweeping liquidity below short-term support ($$$). This area also aligns with previous imbalance fills, suggesting buyers may look to defend it once again.
📊 Technical Outlook
Price swept liquidity under prior support and tapped into demand.
Long idea is valid with risk defined below demand zone.
If buyers hold this zone, upside continuation is likely toward the 23,500–23,700 region.
🌐 Market Sentiment
Seasonality Risk: September is historically the weakest month for U.S. equities, often marked by heightened volatility.
Investor Sentiment: Surveys show mixed outlook — Fear & Greed Index remains in “Greed” (64), while AAII still reports more bears than bulls.
Macro Headlines: Fed uncertainty, tariff rulings, and over-reliance on tech remain short-term risks.
⚖️ Summary
Technically, NAS100 is sitting in a prime buy zone — liquidity grab + demand reaction setup. However, fundamentals still suggest caution, as September volatility could trigger deeper sweeps before a meaningful rally.
👉 For me, it’s a buy from demand with controlled risk. If bulls defend, we could see momentum shift back upward.
💬 What do you think — will bulls hold this level, or will September’s volatility push NAS100 even lower?

NASDAQ Index Analysis (US100 / NASDAQ)At today’s market open, the NASDAQ index started to decline and is currently heading to test the key support level at 23,000.
🔻 Bearish Scenario:
If the price breaks below 23,000 and holds, it is likely to move lower towards the next support level at 22,700.
🔺 Bullish Scenario:
If the price rebounds and breaks above 23,260, holding above it may support further upside toward 23,350.
NASDAQ Eyes 23,565 Pivot as PCE Report LoomsNASDAQ – Update
The Nasdaq slipped on Friday as traders turned cautious ahead of the highly anticipated PCE inflation report, the Fed’s preferred gauge that could heavily influence the September rate decision. The release, expected before the bell, will likely set the near-term trend.
Technical Outlook:
The index reversed from resistance, showing signs of pressure ahead of the data.
A 1H close below 23,565 will confirm bearish continuation toward 23,435 → 23,295 → 23,170, especially if PCE comes in hotter than expected.
If the report is softer, bullish momentum may resume, targeting the ATH at 23,870, with extended resistance at 24,090.
Key Levels:
Support: 23,565, 23,435 – 23,295 – 23,170
Resistance: 23,690 – 23,870 – 24,090
📌 Bias: Neutral ahead of the PCE release. Expect high volatility and wait for confirmation at the pivot level before positioning.

Nasdaq long Looking for longs .
Entered a small size at 23200. Sl just under the lows .
Let us see what this brings on.

NAS100 UPDATE - VERY IMPORTANT READ!Dear Friends in Trading,
INVESTING LIVE - IMPORTANT:
Equities start to get hit by bond market rumblings
The blow up in long-end yields is biting at broader market sentiment now
Stocks down
S&P 500 futures are now down 0.5% as markets are seeking shelter amid the blow up in bond yields. European indices are also sinking lower across the board with the DAX now down nearly 1% with the CAC 40 also turning early gains to losses now. It's all coming undone as we see long-end yields surge higher all across major economies.
France's 30-year yields are now above 4.50% for the first time since 2011 and that follows suit from the situation in the UK here. And as warned there, it was only a matter of time before the spillover impact hits at stocks today. And it's not just in Europe, we're seeing the same in Japan and also the US as well. From last week: The US yield curve continues to steepen post-Jackson Hole
These are testing times and if there's ever a good reason for a correction in stocks, this would be it.
Elsewhere, gold is also being dragged back down on the day as traders are seeking safety in the US dollar at the moment. The precious metal has pared earlier gains to $3,478 now. But if it is a case of truly focusing on the blow up in yields with a steepening of the yield curve, I reckon the play will be to buy gold on dips for the long haul.
I sincerely hope my point of view offers a valued insight.
Thank you for taking the time study my analysis.

Trendline Pullback BreakThe price made a pullback after a bearish move and now it has broken the pullback trendline, followed by a small pullback and now it looks to make a bearish move
WE ONLY TRADE PULLBACKS
Comment your thoughts

NAS100- OPPORTUNITY OF A LIFETIMETeam, I was patiently wait for the NAS100 hit 23200 - liquidity sweep before entering
NOW lets jump on board at 23220-23200 with STOP LOSS AT 23120
Target 1 at 23315 - take 50% partial and bring stop loss to BE
NEXT target at 23365-95 - take 30%
the rest at 23415-23550
LETS GO AND MAKE MILLION TOGETHER.
US 100 shortEntry: 23450
Stop Loss: above 1h Trendline: 23550
Target: just above 127 fibo level at 23208
Price clearly rejected from the 23,500 level.
Now I’m expecting a lower high (LH) followed by a lower low (LL) setup.
