US NAS 100Preferably suitable for scalping and accurate as long as you watch carefully the price action with the drawn areas.
With your likes and comments, you give me enough energy to provide the best analysis on an ongoing basis.
And if you needed any analysis that was not on the page, you can ask me with a comment or a personal message.
Enjoy Trading ;)
Trade ideas

Lower CPI Data – But Don’t Be Fooled by “Good” Inflation Numbers
Summary:
Markets cheered on lower CPI data, but the optimism might be misplaced. A softer inflation print gives the FED more flexibility, yet it also reduces the urgency for two rate cuts this year — something traders had already priced in.
Logic:
CPI came in weaker → short-term bullish sentiment.
But the real driver of rates is not CPI alone — it’s the balance between inflation and growth.
With inflation easing and economic activity still stable, the FED doesn’t need to cut twice in 2025.
Futures market (CME FedWatch) was pricing two cuts, which means that optimism is already priced into NASDAQ valuations.
Scenario Outlook:
If CPI remains stable and growth holds → only one cut or delay, not two.
That means tech valuations might need to reprice lower, especially high beta names.
NASDAQ could revisit support around 17,000–17,200 before finding balance again.
Trading View:
Watch for rejection near 18,000–18,200 (overextension after CPI rally).
Short-term bias: bearish / correction mode.
Long-term bias: still bullish, but needs valuation reset.
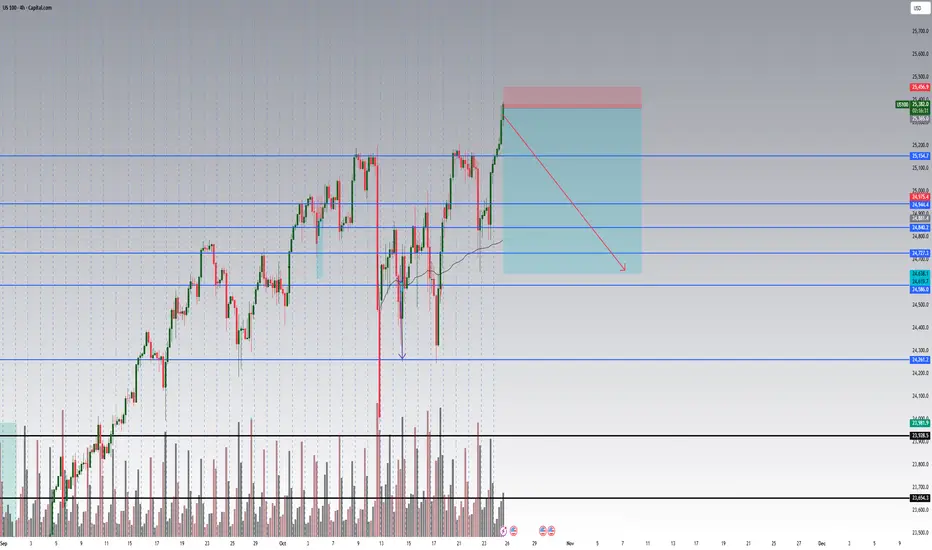
US100 (NAS100) The Tech Sector's Next Breakout📊 Technical Context: The Range-Bound Reality
The 4-hour chart reveals that the NAS100 is currently entrenched in a narrow consolidation channel, forming a high-probability decision zone. The recent price action has tested a pivotal support region following a downward correction from the peak.
Key Structural Levels (Based on 4H Chart):
• Current Pivot: The index is trading near 25,866.9, which sits just above the primary consolidation floor.
• Immediate Resistance (Ceiling): The first significant barrier is the zone around 26,167.3.
• A definitive 4H candle close above this level would signal a short-term bullish breakout.
• Critical Support (Floor): The key technical floor is the consolidation range low near 25,560.0. This level must hold to maintain the current neutral to bullish structural bias.
Upside Targets:
• A break above 26,167.3 unlocks the path to the first swing high target at 26,566.8 (a +278.0 point move from the ceiling).
• The major continuation target sits at the recent swing high of 27,004.0 (a total upside potential of approximately +719.6 points).
Downside Targets:
• A decisive 4H candle close below 25,560.0 would invalidate the immediate range.
• The next major support and downside target is exposed at 25,217.4 (a downside target of approximately -519.2 points).
Technical Verdict: The market is poised for a volatility expansion move once a clear breakout occurs from the 25,560.0 - 26,167.3 range. The longer the consolidation persists, the more forceful the eventual move is likely to be.
📰 Fundamental Headwinds & Tailwinds
To achieve an Editor's Pick, this technical setup must be grounded in the macroeconomic forces driving the technology sector (NASDAQ's primary composition).
The Fed & Interest Rates (High Volatility Risk):
• The price action is highly sensitive to signals regarding interest rate cuts.
• Hawkish Commentary (Headwind): Any shift to a tighter monetary stance by the Federal Reserve (Fed) could quickly lead to a break of the 25,560.0 support, as higher rates reduce the present value of future earnings for growth stocks.
• Dovish Commentary (Tailwind): Signals indicating a pause or potential for future cuts will act as a strong fundamental catalyst, likely fueling a breakout toward 27,004.0.
Corporate Earnings and GDP Data (Directional Catalysts):
• Positive Earnings: Strong quarterly reports from the 'Magnificent Seven' (the largest NASDAQ components) are essential. Positive surprises can provide the fundamental fuel needed for a break above 26,167.3.
• Inflation/Employment Data: Upcoming releases of major economic indicators (such as the Consumer Price Index or Non Farm Payroll) will dictate market sentiment. Reports suggesting persistent inflation are a risk factor, while softening data supports a relief rally.
💡 Potential Trading Strategy
Traders should adopt a reactive, breakout-based strategy rather than anticipating the direction within the current range.
1. Bullish Breakout (Long Setup):
• Entry Confirmation: Wait for a clean 4H close above the resistance zone of 26,167.3 on increased volume, ideally coinciding with a positive fundamental catalyst.
• Initial Target: 26,566.8.
• Secondary Target: 27,004.0.
• Risk Management: Place a stop loss just below the consolidation ceiling (e.g., 26,000.0).
2. Bearish Breakout (Short Setup):
• Entry Confirmation: Wait for a decisive 4H close below the critical support of 25,560.0, triggered by adverse fundamental news or technical momentum.
• Initial Target: 25,217.4.
• Risk Management: Place a stop loss just above the broken support (e.g., 25,750.0).
FINAL SUMMARY
The NAS100 is presenting a high conviction "wait and confirm" setup. The technical structure provides clear boundaries, while the fundamental landscape (Fed policy and earnings) is poised to deliver the catalyst. Do not trade the range; trade the break.

US100US100 is in bearish trend.
Potentially printing LH and LL.
No sign of reversal .
Alligator mouth open which also confirm trend will go down.
We sell at CMP.

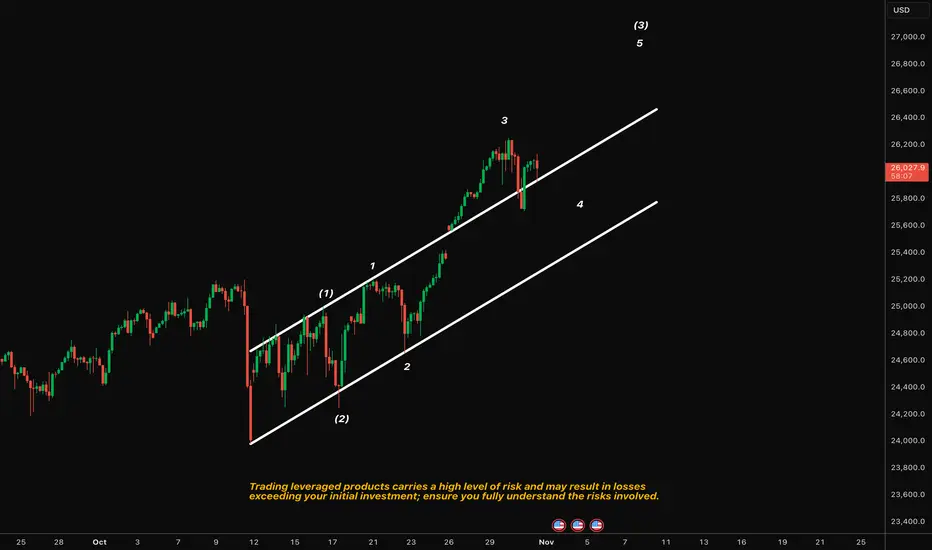
NASDAQ100 | Wave 4 Correction Within ChannelPrice has respected a clean ascending channel, completing a clear 1–2–3 wave sequence. We’re now seeing a corrective pullback that aligns with the wave 4 region — testing the midline support of the channel. As long as this structure holds, the broader wave (3) remains intact.
Scenarios:
Scenario A: If the lower channel and wave 4 region hold → potential continuation higher toward wave 5 and the upper boundary near 26,600–26,800.
Scenario B: If the channel support breaks → deeper correction likely toward 25,800 before any potential resumption of trend.
Are Institutional Buyers Returning to NASDAQ100 Again?🎯 NASDAQ100 Blueprint: The Thief's Ultimate Heist Setup 💰
📊 Asset Overview
NASDAQ:NDX | US100 Index
Market Capital Flow Analysis - Swing Trade Setup
🔍 Technical Foundation
Bias: 🐂 BULLISH CONFIRMED
The LSMA (Least Squares Moving Average) breakout has painted the perfect picture. When institutional money flows align with technical breakouts, you know the smart money is positioning for the next leg up.
Current Market Structure:
We're witnessing a textbook bullish continuation pattern with strong momentum building above key moving averages. The index is showing resilience at support zones while eyeing psychological resistance levels ahead.
💎 The Thief's Layered Entry Strategy
Entry Philosophy: "Why catch one knife when you can catch four?" 😏
This is classic Thief-style layering - multiple limit orders spread across strategic price zones to build a position with optimal average entry:
Entry Layers (Limit Orders):
🎯 Layer 1: 24,800
🎯 Layer 2: 25,000 (Psychological level)
🎯 Layer 3: 25,200
🎯 Layer 4: 25,400
Pro tip: You can add more layers based on your risk appetite and capital allocation. Scale in gradually, not aggressively.
Alternative: If you prefer simplicity, you can enter at current market price - but layering gives you the edge when volatility strikes.
🛡️ Risk Management
Stop Loss Zone: 24,600
⚠️ Important Notice: Dear Ladies & Gentlemen (Thief OG's), this SL is MY reference point based on market structure. You are the captain of your own ship - set your stop loss according to YOUR risk tolerance and account size. Trade at your own risk!
🎯 Profit Target
Primary Target: 26,000
Why this level?
Strong historical resistance zone
Overbought territory on multiple timeframes
Potential bull trap formation area
Confluence with Fibonacci extension levels
⚠️ Exit Strategy Note: Dear Ladies & Gentlemen (Thief OG's), this TP is MY analysis. When YOU see green, YOU decide when to bank it. Take profits incrementally if you prefer safety over maximum gains. Remember: Pigs get fat, hogs get slaughtered! 🐷
🔗 Correlated Assets to Watch
These pairs move in tandem with NASDAQ100 - keep them on your radar:
📈 SP:SPX (S&P 500): The big brother index - when SPX moves, NQ100 often follows
📈 NASDAQ:QQQ (Nasdaq ETF): Direct tracking vehicle for tech-heavy momentum
📈 NASDAQ:AAPL (Apple Inc.): Largest NASDAQ component - heavy influence on index direction
📈 NASDAQ:MSFT (Microsoft): Tech titan with significant index weighting
📈 NASDAQ:NVDA (NVIDIA): Semiconductor leader driving AI narrative
📈 NASDAQ:TSLA (Tesla): High-beta play that amplifies NASDAQ moves
📈 TVC:DXY (US Dollar Index): Inverse correlation - strong dollar often pressures tech stocks
📈 TVC:TNX (10-Year Treasury Yield): Rising yields = tech pressure; falling yields = tech rally
Key Correlation Insight: Tech stocks (and thus NASDAQ) typically benefit from falling yields and weakening dollar conditions. Monitor these macro factors!
⚡ Key Technical Points
✅ LSMA breakout confirms bullish momentum shift
✅ Volume profile suggests accumulation at current levels
✅ Multiple timeframe alignment (swing trader's dream)
✅ Risk-reward ratio favors long positioning
✅ Institutional money flow indicators turning positive
⚠️ Watch for: Volatility spikes near resistance, macro news events, and Federal Reserve commentary that could impact tech valuations.
🎭 The Thief's Final Words
"In the market, you're either the heist mastermind or the one getting robbed. Choose wisely." 😎
This setup is designed for swing traders who understand that patience and proper position sizing beat FOMO every single time. Layer in, manage risk, and let the market come to you.
Remember: This isn't financial advice - it's a roadmap drawn by someone who respects the market's ability to humble even the best of us.
📢 Community Support
✨ If you find value in my analysis, a 👍 and 🚀 boost is much appreciated — it helps me share more setups with the community!
#NASDAQ100 #US100 #NQ100 #SwingTrading #TechnicalAnalysis #LSMA #LayeredEntry #ThiefStyle #IndexTrading #BullishSetup #RiskManagement #TradingStrategy #MarketAnalysis #PriceAction #SupportAndResistance #TradingIdeas #StockMarket #ForexTrading #DayTrading #TradingCommunity

NAS100 Head and Shoulders on M15 still at PlayThe plan for Nas100 is still the same as my analysis on Friday.
Now we just need a break of those lower highs that formed on Friday so we can continue to short it to the gap as planned.

NAS100 Forecast: A Fresh Bullish Impulse Toward New HighsThe NAS100 index is currently moving within a classic Elliott Wave structure. After completing wave (3), the market entered a correction phase that formed wave (4). This correction appears to have ended in the highlighted support zone, where buyers stepped in strongly. The five-wave pattern before wave (4) confirms a solid bullish trend. Now, the index seems to be preparing for the final upward move wave (5). This wave often represents the last push of a rally before a larger correction starts. As long as the price stays above the recent support near 24,400 , the next targets could be seen around 25,200–25,600 . In simple terms, the market is expected to continue its uptrend after a short pullback, following the typical Elliott Wave sequence of five upward waves and three corrective ones.

US100 consolidation a bullish Phase TrendThe US100 remains within a short-term bearish trend, though recent price action suggests a potential recovery phase if support levels hold.
Technically Wall Street futures gained on Monday, marking a positive start to November. The move was supported by renewed optimism around oil demand and hopes of progress in U.S.–China trade relations, boosting overall risk appetite.
Key technical levels:
Resistance: 26,400 — A sustained move above this level could confirm bullish momentum and open the path for further gains. 25,700 If prices retrace to this zone and hold, we could see renewed buying pressure as investors position for a rebound a decisive break below 25,700 would likely signal a continuation of the downtrend, inviting further downside. In the short term, expect some volatility as the index tests these critical levels. If buying interest remains strong near support, the US100 could resume an upward correction, giving investors an opportunity to take short- to mid-term profits.
You may find more details in the chart.
Trade wisely best of Luck Buddies.
Ps; Support with like and comments for better analysis Thanks for Supporting.

NAS100 Trade Set Up Nov 3 2025If price trades into PDH first i will wait for internal bearish structure to catch sells down to SSL/London Lows but if price comes to test 1h FVG first and respects it i will look for internal structure to catch buys to PDH


NAS100 | US100 (Nasdaq 4H) – Technical OutlookUS100 (Nasdaq 4H) – Technical Outlook
📊 Market Structure:
Price has recently formed a weak high around 26,200, rejecting from a premium / supply zone, signaling potential short-term bearish pressure.
The previous upward structure showed a BOS (Break of Structure) near 25,000, confirming bullish intent earlier — but now momentum is slowing as price returns below the PDH (Previous Day High).
The current 4H candles show strong bearish reaction, indicating sellers defending the premium zone.
📉 Key Levels:
Supply Zone (Premium Area): 26,000 – 26,200
Equilibrium Zone: Around 24,800 – 25,000
Immediate Support: 25,800 (current PD level)
Weekly Pivot (PW): 25,400 (potential short-term target)
📈 EMA Confluence:
Price has rejected from above the 89 EMA (blue) and is now testing below it.
The 200 EMA (yellow) continues to trend upward, showing long-term bullish momentum, but the shorter EMAs suggest a short-term pullback.
As long as price stays below 89 EMA, bias remains bearish to neutral in the near term.
🎯 Trade Scenarios:
Scenario 1 – Short-Term Sell Setup:
Entry Zone: 25,950 – 26,100 (retest of premium area or EMA rejection)
Take Profit: 25,400 (PW)
Stop Loss: Above 26,250
Confluence: Supply zone + weak high + bearish EMA alignment
Scenario 2 – Bullish Continuation (after retracement):
Wait for price to retrace to the equilibrium zone (24,800–25,000)
Look for bullish reaction with confirmation from Stochastic RSI divergence
Target: Return to 26,000
📊 Indicators Insight:
Stochastic RSI: Currently dropping from overbought territory, indicating possible continuation of short-term downside.
Momentum slowing — ideal for short retracement trades before potential reversal.
Summary:
US100 is rejecting from premium resistance near 26,200.
Short-term bias: bearish retracement toward 25,400 or deeper 25,000 equilibrium zone.
Long-term bias remains bullish, supported by 200 EMA structure — watch for confirmation before re-entry buys.

US100How to become successful in forex and stock trading:
1.Master fundamentals and technical analysis.
2.Build and follow a solid trading plan.
3.Apply strict risk management (4–6% rule).
4.Stay disciplined—control fear and greed.
5.Record and analyze every trade.
6.Focus on high-quality setups only.
7.Diversify across assets and markets.
8.Keep evolving—study, adapt, and grow daily.

NAS BEARISH SETUP As the price continues to trade above 25. Price has met resistance at 26.2 and is about to test it again forming a double top on new resistance

Position Sizing: The Math That Separates Winners from LosersMost traders blow up their accounts not because of bad entries, but because of terrible position sizing. You can have a 60% win rate and still go broke if you risk too much per trade.
The 1-2% Rule (And Why It Works)
Never risk more than 1-2% of your account on a single trade.
Here's why this matters:
Risk 2% per trade → You can survive 50 consecutive losses
Risk 10% per trade → 10 losses = -65% drawdown (you need +186% just to break even)
Risk 20% per trade → 5 losses = game over
The Position Sizing Formula
Position Size = (Account Size × Risk %) / (Entry Price - Stop Loss)
Real Example:
Account: $10,000
Risk per trade: 2% = $200
Entry: $50
Stop loss: $48
Risk per share: $2
Position Size = $200 / $2 = 100 shares
If stopped out → You lose exactly $200 (2%)
If price hits $54 → You make $400 (4% gain, 2:1 R/R)
Different Risk Frameworks
Conservative (1% risk)
Best for: Beginners, volatile markets, high-frequency trading
Survivability: Can take 100+ losses
Growth: Slower but steady
Moderate (2% risk)
Best for: Experienced traders, tested strategies
Survivability: 50 consecutive losses
Growth: Balanced risk/reward
Aggressive (3-5% risk)
Best for: High conviction setups, smaller accounts trying to grow
Survivability: 20-33 losses
Growth: Faster but dangerous
Warning: Never go above 5% unless you're gambling, not trading.
The Kelly Criterion (Advanced)
For traders with significant backtested data:
Kelly % = Win Rate -
Example:
Win rate: 55%
Avg win: $300
Avg loss: $200
Win/Loss ratio: 1.5
Kelly % = 0.55 - = 0.55 - 0.30 = 25%
But use 1/4 Kelly (6.25%) or 1/2 Kelly (12.5%) - Full Kelly is too aggressive for real markets.
Common Position Sizing Mistakes
❌ Revenge trading larger after a loss
✅ Keep position size constant based on current account value
❌ Risking the same dollar amount regardless of setup quality
✅ Risk 0.5% on B-setups, 2% on A+ setups
❌ Ignoring correlation risk
✅ If you have 5 tech stocks open, you're really risking 10% on one sector
❌ Not adjusting after drawdowns
✅ If account drops 20%, your 2% risk should recalculate from new balance
The Volatility Adjustment
In high volatility (VIX > 30):
Cut position sizes by 30-50%
Widen stops or risk less per trade
Market can gap past your stops
In low volatility (VIX < 15):
Can use normal position sizing
Tighter stops possible
More predictable price action
My Personal Framework
I use a tiered approach:
High conviction setups (A+): 2% risk
Good setups (A): 1.5% risk
Decent setups (B): 1% risk
Experimental/learning: 0.5% risk
Maximum combined risk: Never more than 6% across all open positions.
The Bottom Line
Position sizing is the only thing you have complete control over in trading. You can't control:
Where price goes
Market volatility
News events
But you CAN control how much you risk.
The traders who survive long enough to get good are the ones who master position sizing first.
What's your current risk per trade? Drop it in the comments. If it's above 5%, we need to talk.
NAS100 | Bearish Momentum Extends The Nasdaq 100 fell about 2.1% (~500 points) as projected, maintaining a bearish outlook while technology stocks continued to weigh on market sentiment.
Below 25,700: Bearish continuation towards 25,340 → 25,230 → 25,000.
Above 25,700: Short-term recovery towards 25,820 → 26,170.


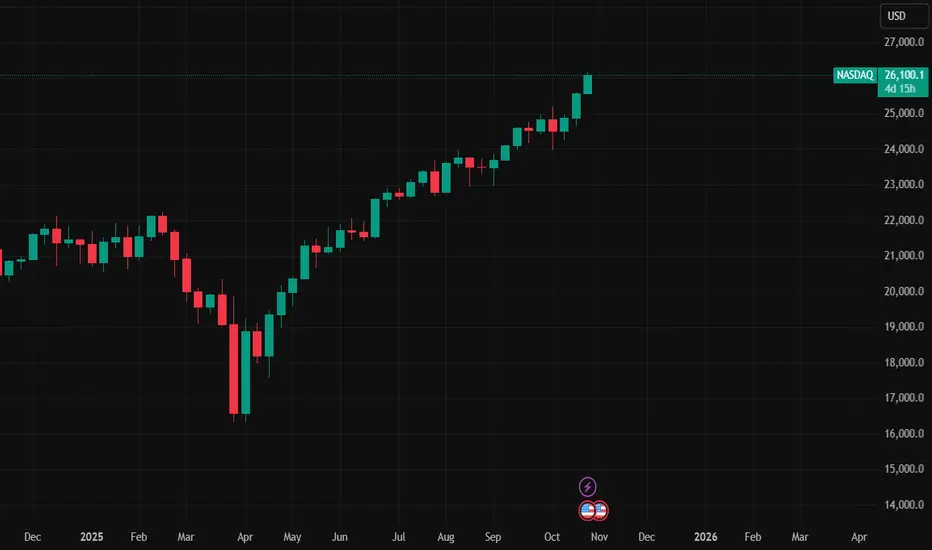
Nasdaq bullish momentum continuesNasdaq bullish momentum continues. US economy and Technology stocks are fundamentally strong.

NASDAQ to 26,000 before year end - September, 2025No doubt this idea will be controversial as a majority of ideas published on the platform call for a bearish outlook.
Earlier this year paper hands were flushed out of the market on tariff scares. They couldn’t exit the market fast enough, some didn’t actually know why they were selling as emotions were in full control.
Today those same traders and investors sit in cash as they wait for an opportunity to buy in. Others betting heavily against the trend for Armageddon. All the while the market grinds upwards and onwards.
Two very simple questions everyone must ask when entering or betting against the market:
1. What is the trend?
2. Support and resistance, which is it?
You cannot maintain a bearish bias should you answer both of those questions positively. That’s emotion. Do you find yourself scanning lower timeframes to look for bias confirmation? You'd be in majority then. Notice how many published ideas you see operating in the 15 and 30 minute charts with 2 to 3 month forecasts? Always makes me smile, but it will not change the facts of the chart.
The Trend
Higher lows are evident on the daily chart below, marked out in black. The trend is your friend until the end.
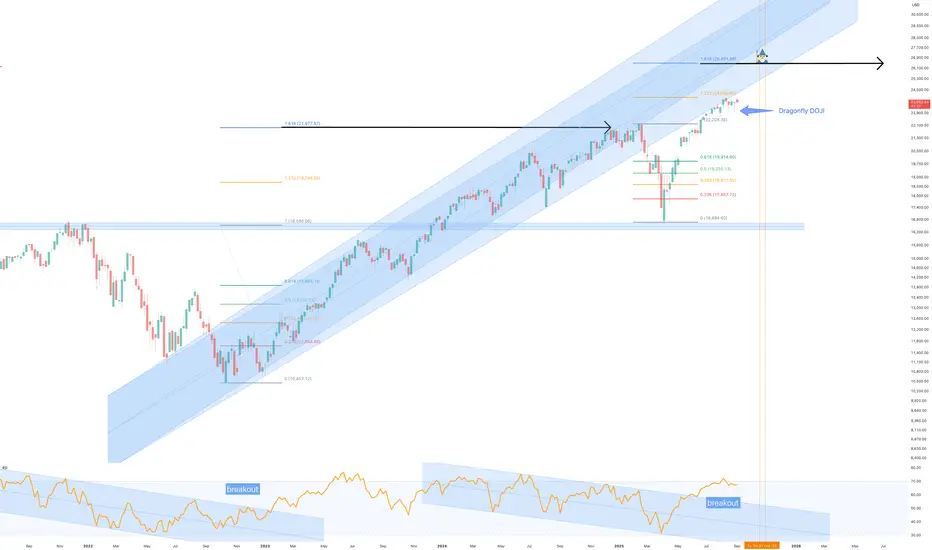
Support & resistance
Look left. On the daily chart we can see multiple support tests with confirmation on past resistance. If the levels do not at first appear, zoom out using a higher timeframe. A majority will zoom in instead to confirm bias, that’s a red flag.
The Put / Call ratio
Retail traders are aggressive in their attempts to “short” this market. Nowhere is that more evident than the Put/Call ratio. Anytime you see dumb money move the put call ratio to 90 and above, the market rips. Just recently short sellers moved the ratio beyond this level. The chart below provides a comparison with the NDX to show what happens next. The rally that follows will typically last up to 2 months on average after this signal.
Why 26000?
The market entered price discovery after the previous all time high breakout of 22k. The forecast area was previously published, see linked ideas. The same conditions that allowed those forecasts now repeat. In addition the Fibonacci extensions; the NDX repeatably rallies to the 1.618 extension after each and every emotional flush out. It’s a gift horse of an opportunity.
Previous years:
Conclusion
Markets climb walls of worry, and this moment is no different. The loudest voices today call for collapse, but the charts, price action, and sentiment data are telling another story entirely. Higher lows, confirmed support, extreme put/call ratios, and Fibonacci extensions all align with one clear outcome: continuation.
A move to 26,000 on the NASDAQ before year-end is not a wild stretch of imagination, but the logical conclusion of repeating market behaviour. Every emotional flush out has historically created the runway for price discovery to the 1.618 extension, and this time is no different.
If you’re betting against the trend, you’re not fighting the market, you’re fighting math, structure, and history. The bears may dominate headlines but that just News. The market is not listening to fear. It’s grinding higher, and the destination is 26,000.
Ww
NasdaqNasdaq is showing a correction pattern after a previous upward movement. The price closed below the old support zone and was rejected, confirming a resistance zone at 25,923.4.
The loss of this support reinforces the continuation of the corrective movement, with a projected drop towards the next support zone at 25,569.8, a point where there is convergence with the previous low and a potential area for absorbing buy orders.

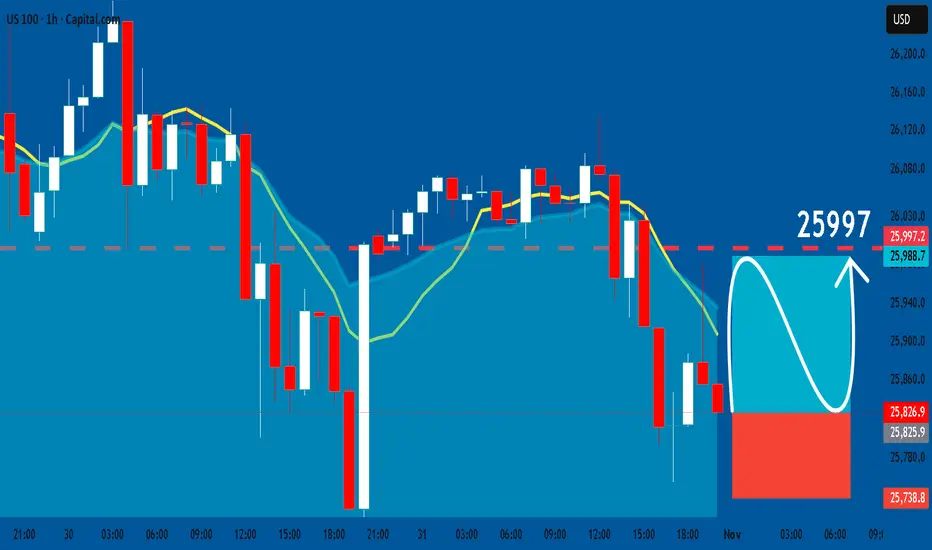
US100: Long Signal Explained
US100
- Classic bullish formation
- Our team expects pullback
SUGGESTED TRADE:
Swing Trade
Long US100
Entry - 25826
Sl - 25738
Tp - 25997
Our Risk - 1%
Start protection of your profits from lower levels
Disclosure: I am part of Trade Nation's Influencer program and receive a monthly fee for using their TradingView charts in my analysis.
❤️ Please, support our work with like & comment! ❤️
US100 (NDQ): Trend in daily time frameThe color levels are very accurate levels of support and resistance in different time frames, and we have to wait for their reaction in these areas.
So, Please pay special attention to the very accurate trends, colored levels,
and you must know that SETUP is very sensitive.
Be careful
BEST
MT

NDQShift prediction to the right.
Global market cooler anticipated. Crypto should be hit the hardest and fastest.
Most anticipating rally continuation like post-COVID...
I think that will cause a surprise.
