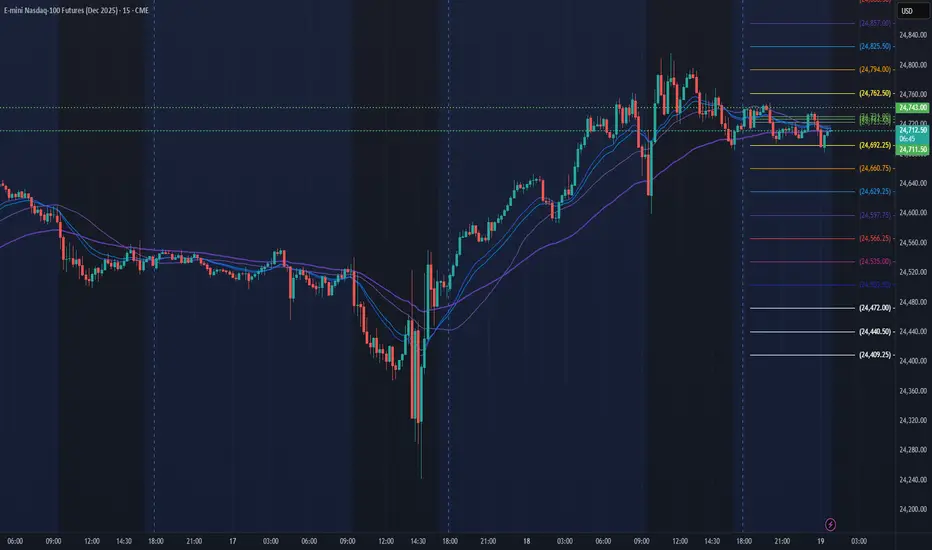
NQ Power Range Report with FIB Ext - 9/19/2025 SessionCME_MINI:NQZ2025
- PR High: 24743.00
- PR Low: 24711.50
- NZ Spread: 70.5
No key scheduled economic events
Session Open Stats (As of 12:45 AM 9/19)
- Session Open ATR: 275.89
- Volume: 27K
- Open Int: 268K
- Trend Grade: Long
- From BA ATH: -0.4% (Rounded)
Key Levels (Rounded - Think of these as ranges)
- Long: 25217
- Mid: 22503
- Short: 21790
Keep in mind this is not speculation or a prediction. Only a report of the Power Range with Fib extensions for target hunting. Do your DD! You determine your risk tolerance. You are fully capable of making your own decisions.
BA: Back Adjusted
BuZ/BeZ: Bull Zone / Bear Zone
NZ: Neutral Zone
NDAQ100H2026 trade ideas
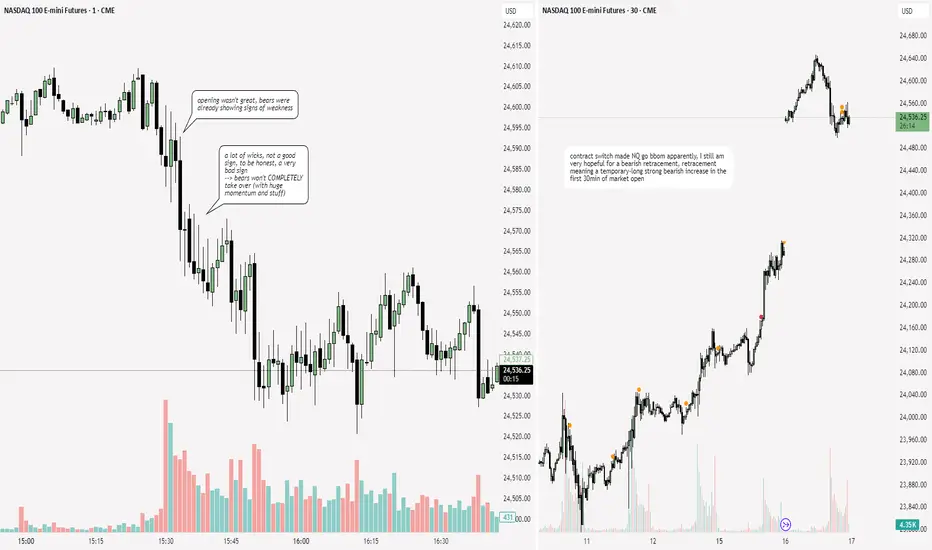
NQ: 255th trading session - recapTHE PULLBACK WILL COME, I JUST KNOW IT. But tbh, when it comes I'll know, it'll probably consist of complete bearish force already in the opening, no greend candles the first 3-5 candles. With price pushing so higher the downfall will be insane. I don't even know whether I'll get an entry - not kidding. Price pushing too fast and too low
--> no entry, too late, no momentum available anymore

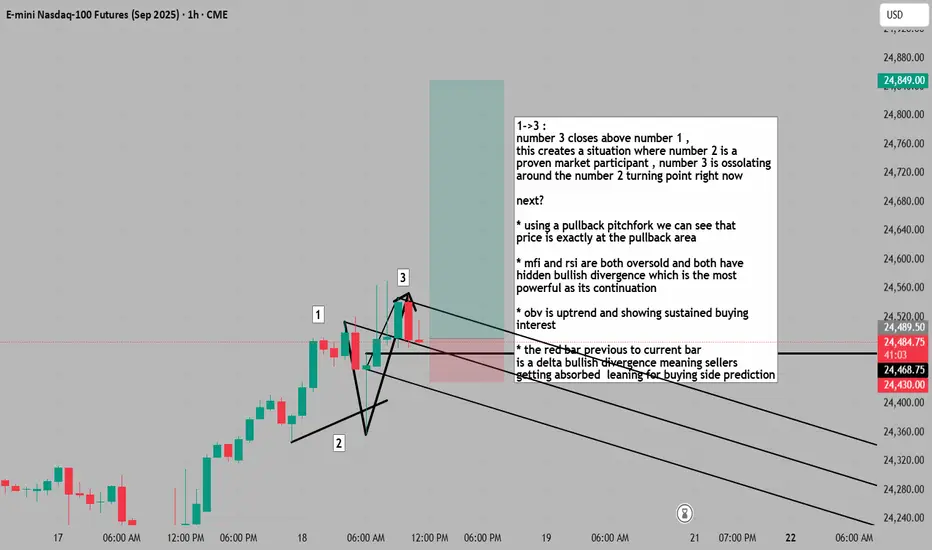
I guessed all the confluences, every single one, and I was rightHAAHHAHAH , cant make this up, I guessed every single confluence I listed, hidden bullish, delta divergence, reverse pitchfork, and everything when I actually checked it, was there, luck?
( use footprint chart to check delta divergences / imbalances )
1->3 :
number 3 closes above number 1 ,
this creates a situation where number 2 is a
proven market participant , number 3 is ossolating
around the number 2 turning point right now
next?
* using a pullback pitchfork we can see that
price is exactly at the pullback area
* mfi and rsi are both oversold and both have
hidden bullish divergence which is the most
powerful as its continuation
* obv is uptrend and showing sustained buying
interest
* the red bar previous to current bar
is a delta bullish divergence meaning sellers
getting absorbed leaning for buying side prediction

Today's Trade PossibilitiesBuy the Dip
Green-shaded areas are accumulation/distribution areas.
Nearest Buy the Dip: 24550 - 24490
Pros:
1.prior vpoc @ 24503 (from 9/12)
2.vpoc @ 24412.75
3.pdc 24465.25
4.support @ 24490 (Head and Shoulders Neckline from 9/16)
AGGRESSIVE TRADES
put in orders now 1 MNQ @ 24550. Buy 1 MNQ at 5-point intervals from here to 24490. 19-point target for each trade.
MODERATE TRADES
wait for a good bounce, then place your trades in 5-point intervals, 19-point targets
CONSERVATIVE TRADES
wait for a bounce at or about 24490, then place your trades
Climb the Ladder Breakout Trades
use the above same logic to choose aggressive, moderate or conservative
also affecting these three categories - will you place them in 5-point or 10-point increments? will you overlap them or not? Overlapping is more aggressive. If you don't overlap them, you will wait until the lower entry hits its target before you enter the next trade. A much more conservative (safe) approach.
Pivot Trades
I err on the side of caution
my Pivots: 24247, 24097, 24977
these are subject to change
feel free to pick your own pivots

NQ Power Range Report with FIB Ext - 9/18/2025 SessionCME_MINI:NQZ2025
- PR High: 24574.25
- PR Low: 24495.25
- NZ Spread: 176.5
Key scheduled economic events:
08:30 | Initial Jobless Claims
- Philadelphia Fed Manufacturing Index
Session Open Stats (As of 12:15 AM 9/18)
- Session Open ATR: 279.81
- Volume: 29K
- Open Int: 249K
- Trend Grade: Long
- From BA ATH: -0.0% (Rounded)
Key Levels (Rounded - Think of these as ranges)
- Long: 25217
- Mid: 22503
- Short: 21790
Keep in mind this is not speculation or a prediction. Only a report of the Power Range with Fib extensions for target hunting. Do your DD! You determine your risk tolerance. You are fully capable of making your own decisions.
BA: Back Adjusted
BuZ/BeZ: Bull Zone / Bear Zone
NZ: Neutral Zone

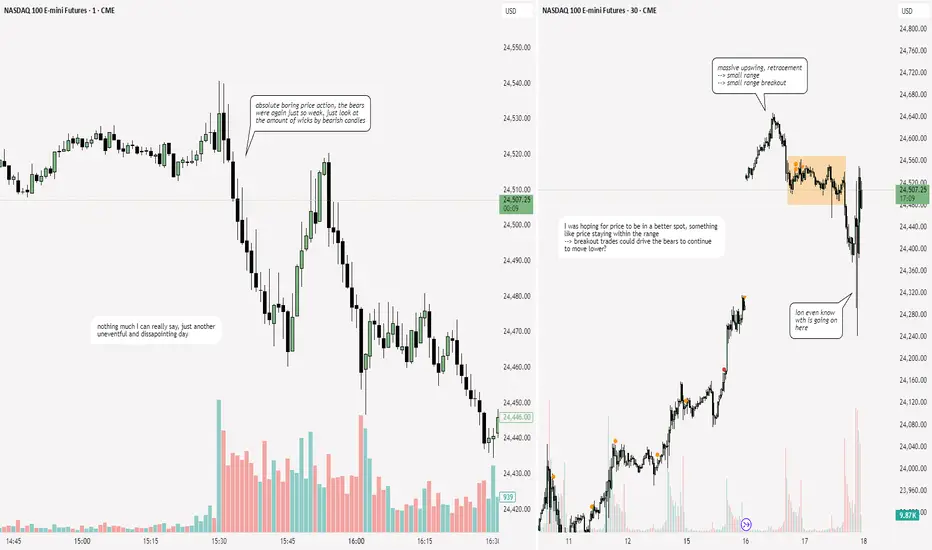
NQ: 254th trading session - recapp.e was canceled today so I was able to scalp, didn't really matter that much tho.
I might think about cutting these boring sessions out of my recaps, it is just not worth it to have
tradeless and boring sessions uploaded here...
Trading FOMC DayMost say do NOT trade FOMC day.
I trade it.
5m chart
Buy the Breakout
1.Above 13:50 high I buy 1 contract at each 10-point interval
2.29-point target for each and every entry
Buy the Dip
1.I buy the green shaded areas 31-point target
2.If a certain area bounces well, I keep trading it until it no longer works
Pivots
1.My pivots:24,307, 24,207, 24,147, 24,087, 24,027
2.101-point target for each entry

Nasdaq looking downtoday as seen in the video, we are looking for a short.
yesterday showed a lot of rejection to the upside so maybe today we see the market test levels to the down side.
entry in blue.
stop in red
target in green
Elektra

Target areas above and below current NQ price for Market open.9/17/25 - Target areas above and below current NQ price for Market open.
NQ Power Range Report with FIB Ext - 9/17/2025 SessionCME_MINI:NQZ2025
- PR High: 24551.75
- PR Low: 24525.00
- NZ Spread: 59.75
Key scheduled economic events:
14:00 | FOMC Economic Projections
- FOMC Statement
- Fed Interest Rate Decision
14:30 | FOMC Press Conference
Temp AMP margins increase for expected FOMC volatility
Session Open Stats (As of 12:15 AM 9/17)
- Session Open ATR: 270.67
- Volume: 12K
- Open Int: 220K
- Trend Grade: Long
- From BA ATH: -0.5% (Rounded)
Key Levels (Rounded - Think of these as ranges)
- Long: 25217
- Mid: 22503
- Short: 21790
Keep in mind this is not speculation or a prediction. Only a report of the Power Range with Fib extensions for target hunting. Do your DD! You determine your risk tolerance. You are fully capable of making your own decisions.
BA: Back Adjusted
BuZ/BeZ: Bull Zone / Bear Zone
NZ: Neutral Zone
day 2 100 to 1,000,000 Romans 7:15 For I do not the thing I want, but I do the very thing I hate. my greed was disguised by my own thoughts leaving me with less, than what I anticipated.

NQ: 253rd trading session - recapVery boring session, higher timeframe bias was great again but idk, session on its own was just pretty bad: No momentum, no setups in sight, no great price action etc
Target areas above and below current NQ price for Market open.Target areas above and below current NQ price for Market open.

Bullish for the day?Nasdaq bouncing off the VWAP in 15 minutes and positive news just now for core retail sales. Bullish for the day?

NQ Power Range Report with FIB Ext - 9/16/2025 SessionCME_MINI:NQU2025
- PR High: 24537.50
- PR Low: 24524.00
- NZ Spread: 30.0
Key scheduled economic events:
08:30 | Retail Sales (Core|MoM)
Session Open Stats (As of 12:25 AM 9/16)
- Session Open ATR: 282.21
- Volume: 15K
- Open Int: 282K
- Trend Grade: Long
- From BA ATH: -0.0% (Rounded)
Key Levels (Rounded - Think of these as ranges)
- Long: 25217
- Mid: 22503
- Short: 21790
Keep in mind this is not speculation or a prediction. Only a report of the Power Range with Fib extensions for target hunting. Do your DD! You determine your risk tolerance. You are fully capable of making your own decisions.
BA: Back Adjusted
BuZ/BeZ: Bull Zone / Bear Zone
NZ: Neutral Zone
NASDAQ 100 HEAD AND SHOULDERS FORMATION CANCELED Hey traders FOMC week and we are back to looking at the Nasdaq. Picking tops and bottoms in these markets is always challenging to say the least.
Well what do we have here?
Market has now broken above the head of this pattern which means no more Head & Shoulders. A close above the right shoulder or the head cancels the formation.
So at this point I don't think anyone knows how the market will react after this weeks FED meeting.
So therefore I think it's a wait and see approach before creating a new trading plan at least imo.
So No Scenarios yet until after FOMC. Watch out for Volatility!😬
Good Luck & Always use Risk Management!
(Just in we are wrong in our analysis most experts recommend never to risk more than 2% of your account equity on any given trade.)
Hope This Helps Your Trading 😃
Clifford
RISK DISCLOSURE
TRADING IN THE FUTURES AND FOREX MARKET INVOLVES SIGNIFICANT RISK. ALWAYS CONSULT A FINANCIAL ADVISOR AS HIGH RISK ASSET CLASSES MAY NOT BE SUITABLE FOR ALL INVESTORS. THIS IS NOT A RECOMMENDATION TO BUY OR SELL ANY ASSETS. ALL IDEAS ARE MADE FOR EDUCATIONAL PURPOSES. PAST PERFORMANCE DOES NOT GUARANTEE FUTURE RESULTS.
CFTC RULE 4.41 – HYPOTHETICAL OR SIMULATED PERFORMANCE RESULTS HAVE CERTAIN LIMITATIONS. UNLIKE AN ACTUAL PERFORMANCE RECORD, SIMULATED RESULTS DO NOT REPRESENT ACTUAL TRADING.

Bullish Nasdaq-but thread lightly Sep 15-19
CME_MINI:NQU2025 Quick summary / bias
Price put in a clear bullish structure through Thursday → Friday (higher highs, higher lows) but just hit a liquidity sweep up to 24159 and pulled back into a visible Imbalance / order-block area that sits right above the 4H open / purple line at 24001.50.
So my primary bias is bullish as long as price holds the 24000–24040 area.
If price breaks and closes below the origin lows around 23969 → 23909 the bias flips bearish.
----------------------------------------------
What I see (structure + important levels)
Higher-timeframe context: an impulsive move up from the 23960–23970 region into the 24159 high — that’s a clear displacement and creation of a bullish imbalance (the shaded box on the chart).
Liquidity events: a pronounced wick above 24159 (buy-side liquidity run) followed by a quick sell—classic stop-hunt then retrace into the Price Imbalance.
Key horizontal levels to use:
Resistance / short-term target: 24159.00 (recent high / liquidity high).
Primary support / confluence (buy zone): 24001.50 (purple line / 4H open) and the grey FVG just above it (~24000–24080 area).
Invalidation / bearish trigger: a decisive break below 23969.00 (and especially below the referenced originating imbalance around 23909–23871 on the left).
Current quote on the chart: 24,115.25 (shows we’ve pulled off the 24159 high and are sitting into the gap/OB).
----------------------------------------------
Trade ideas (clear entries, stops, targets)
A — Primary (preferred) — Long (mean-reversion into Imbalance / structural buy)
Why: Market made an impulsive rally; sweep above 24159 sucked liquidity and then pulled back into the bullish imbalance + 4H open — a high-probability area for continuation if buyers defend it.
Entry (limit or 1-min confirmation): ~24020 (inside the Imbalance / just above 24001.50).
If you trade micro time frames: wait for a 5-min displacement down into the FVG and then a 1-min bullish rejection (tight lower wick + bullish engulf / strong rejection) to enter.
Stop: 23950 (just below the liquidity sweep low / below 23969).
Targets:
T1: 24159.00 (recent high).
T2: 24240 ( extension if T1 runs — measured continuation ).
Risk math (example):
Entry = 24,020; Stop = 23,950 → risk = 70 points.
T1 = 24,159 → reward = 139 points → RR ≈ 1.99 : 1.
T2 = 24,240 → reward = 220 → RR ≈ 3.14 : 1.
Management: scale out (25% at T1, move stop to breakeven, trail rest by structure).
---------------------------------------------------
B — Aggressive Long (breakout continuation)
Trigger: Clean break and close above 24159 and a retest that holds the level.
Entry: Long on retest above 24159.
Stop: below the retest low (e.g., 24120).
Target: next measured move / psychological round levels (e.g., 24280–24320).
----------------------------------------------------
Execution rules / signals (so you’d know exactly what to do)
Prefer entries at confluence: Imbalance + 4H open + prior liquidity level (24000–24040).
Micro confirmation: On the 5-min, look for the displacement into the FVG; on the 1-min look for a clean rejection (long wick and quick bullish candle) before hitting “buy”. This matches your stated process (displacement on 5m, reversal on 1m).
Position sizing: risk per trade = set so your stop distance × size = e.g., 0.5%–1% of account. Don’t risk full target size on one slice—scale in.
If price closes below 23969 on the 1H (or a strong 5-min close below), stand down on longs and look for short entries only after a retest.
----------------------------------------------------
Invalidation & what to watch
Invalidation of bullish view: clean close and follow-through below 23969 (especially if price closes and stays below 23909). That flips the edge to the bears.
Confirmation of continuation: price holds the Imbalance/4H open (24001.50) and reclaims/prints above 24159 with a clean retest (shows buyers absorbed liquidity).
----------------------------------------------------
Remember that confirmation not only validates the idea but it increases the success probability of the idea.

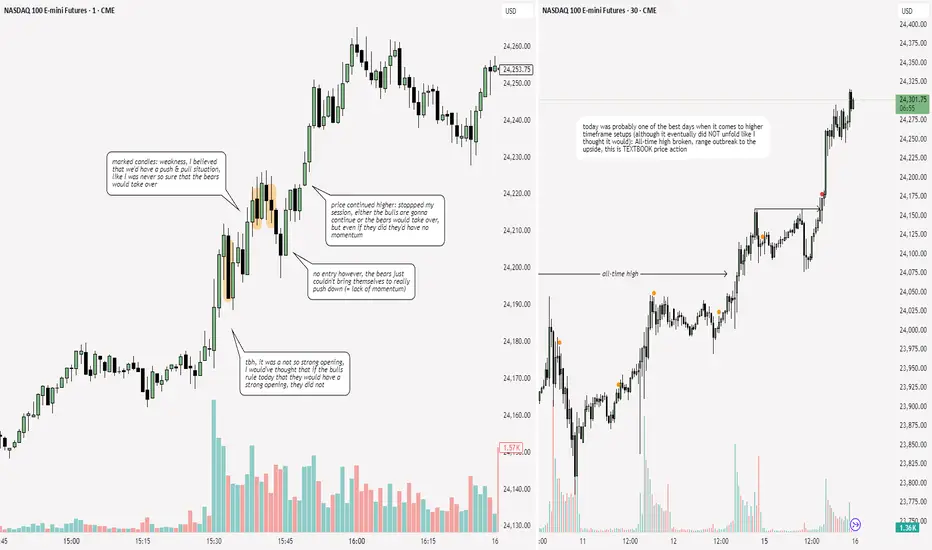
NQ: 252nd trading session - recapDefinitely a very exciting session, price action has been doing me well tbh.
But school starts again, meaning I won't trade every wednesday, I despise this fact
some chart detailscharting is key to discipline. anyone can chart, who can follow their own mind with persistence focus. i love charting and i love trading but they are two different things in one.

Target areas above and below current NQ price for Market open.All time highs Really only 1 level of interest close to price.

NQ FUTURES IDEA 9/15We are looking to re test the top of 24,159 NQ but first we might drop to 24,000 NQ. I think we trade around this 24,064 range and then start pushing back up to re test 24,159 NQ.

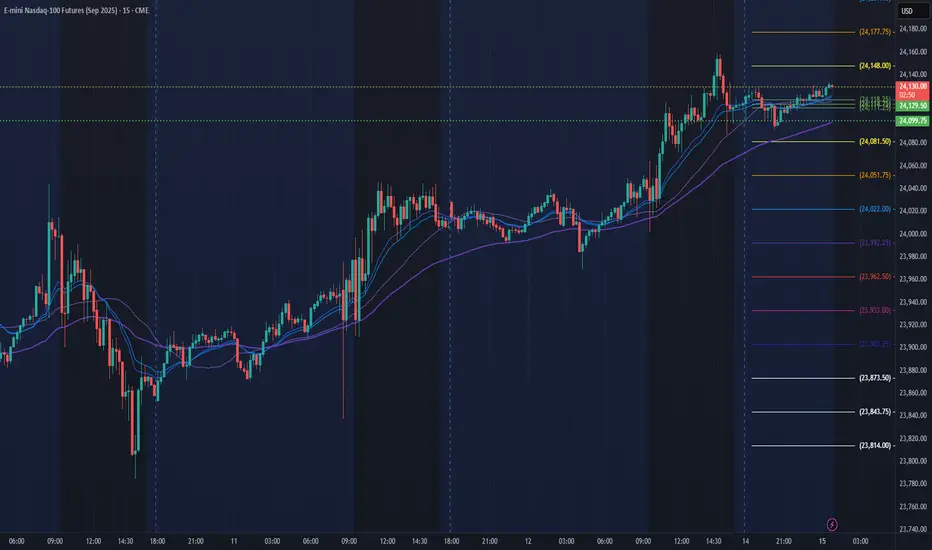
NQ Power Range Report with FIB Ext - 9/15/2025 SessionCME_MINI:NQU2025
- PR High: 24129.50
- PR Low: 24099.75
- NZ Spread: 66.75
No key scheduled economic events
Contract rollover week
- Advertising potential to continue ATH march
Session Open Stats (As of 12:45 AM 9/15)
- Session Open ATR: 270.13
- Volume: 13K
- Open Int: 273K
- Trend Grade: Long
- From BA ATH: -0.1% (Rounded)
Key Levels (Rounded - Think of these as ranges)
- Long: 25217
- Mid: 22503
- Short: 21790
Keep in mind this is not speculation or a prediction. Only a report of the Power Range with Fib extensions for target hunting. Do your DD! You determine your risk tolerance. You are fully capable of making your own decisions.
BA: Back Adjusted
BuZ/BeZ: Bull Zone / Bear Zone
NZ: Neutral Zone