US30 Technical Breakdown – 11/05/2025📍 US30 Technical Breakdown – 11/05/2025
After a strong rally toward 48,000, US30 is showing signs of exhaustion 😴 Bears have stepped back in, pushing price below short-term EMAs as momentum fades. The index is now hovering near 47,130, caught between minor support and resistance zones ⚖️
📊 Market Behavior:
🔹 Clear rejection from 48,000 — same key psychological barrier from last week
🔹 Consecutive lower highs → early structure shift forming
🔹 Price struggling to stay above EMAs → sellers reclaim control short term
📌 Key Levels:
🔹 Resistance Zones:
47,250 → intraday EMA cap
47,400 → prior supply zone
47,800 → major resistance before 48,000
🔹 Support Zones:
47,000 → immediate support
46,520 → strong demand zone
46,000 → next downside magnet if breakdown continues
🧠 Bias:
Short-term bearish ⚠️
⬇️ Below 47,250 → watch for deeper pullback
⬆️ Above 47,400 → bulls could reattempt a move to 47,800
Trade ideas

US30 Trade Set Up Nov 3 2025For price to go bullish i want to see a test of the 15m FVG and respect it to then make internal 1m-5m IFVG/CISD to target BSL/London highs but if price inverts the 15m gap i will look for sells to PDL

US 30Preferably suitable for scalping and accurate as long as you watch carefully the price action with the drawn areas.
With your likes and comments, you give me enough energy to provide the best analysis on an ongoing basis.
And if you needed any analysis that was not on the page, you can ask me with a comment or a personal message.
Enjoy Trading ;)

DOW JONES INDUSTRIAL HIGH PROBABILITY SETUP SOON!!!🚨 DOW30 HIGH PROBABILITY BUY SETUP 🚨
* Here We Can See Clearly The Next Potential Moves For US30 Coming Hours/Days.
* Keep Your Eyes Close On Your Trading Positions.
* Happy PIP Hunting Traders.
FXKILLA.

US30 | Dow Jones Extends Gains Above 47,565 SupportUS30 – MARKET OUTLOOK | Bullish Momentum Holds Above Pivot Zone 🇺🇸
The Dow Jones remains bullish after stabilizing above the pivot line at 47,565, supported by positive sentiment in earnings and broader risk appetite.
🔼 Above 47,565: Bullish bias toward 47,760 → 47,920 → 48,040.
🔽 Below 47,565: Bearish correction toward 47,460 → 47,250 → 47,100.
Pivot: 47,570
Support: 47,460 · 47,250 · 46,920
Resistance: 47,760 · 47,920 · 48,040
US30 stays bullish while above 47,565, but a break below could trigger a short-term pullback toward lower supports.

US30 Risky Short!
HI,Traders !
#US30 is growing now
But a horizontal resistance
Level of 47513.8 from where
We will be expecting a local
Pullback and a local move down !
Comment and subscribe to help us grow !

US30 H4 | Bullish Bounce Off OBUS30 is having a temporary correction towards the downside. However, there is a Fair Value Gap and Order Block present, which could cause price to bounce from that area.
Our buy entry is in between the FVG and OB, at 46,883, which also aligns with the 75% FIbonacci retracement level.
The stop loss is at 46,509, which is at the swing low support level, while the take profit is at 47,460, which is at the pullback resistance level.
Stratos Markets Limited (tradu.com/uk ):
CFDs are complex instruments and come with a high risk of losing money rapidly due to leverage. 68% of retail investor accounts lose money when trading CFDs with this provider. You should consider whether you understand how CFDs work and whether you can afford to take the high risk of losing your money.
Stratos Europe Ltd (tradu.com/eu ):
CFDs are complex instruments and come with a high risk of losing money rapidly due to leverage. 70% of retail investor accounts lose money when trading CFDs with this provider. You should consider whether you understand how CFDs work and whether you can afford to take the high risk of losing your money.

Dow Jones Indus (US30)Price has completed a clean sweep of sell-side liquidity and is now showing strong displacement toward the upside. The recent break in structure confirms short-term bullish intent.
If price returns to the fair value gap or discount zone, I’ll look for confirmation to enter in alignment with the intraday bullish flow.
My first target remains the internal liquidity zone, and the potential extended target is the previous day’s high where buy-side liquidity rests.

DJI : Starting from ZEROIt has been some time since I published the last DJI idea.
Anyway, price now is at the extreme and it is quite RARE that I have to start from ZERO - the beginning of EVERYTHING.
If this is the case, when I can clearly see the BEGINNING, then surely I can also see the END, with a DOUBLE 'D'.
It might just follow the previous drop of 38.2%
The probability is very good.
Good luck.

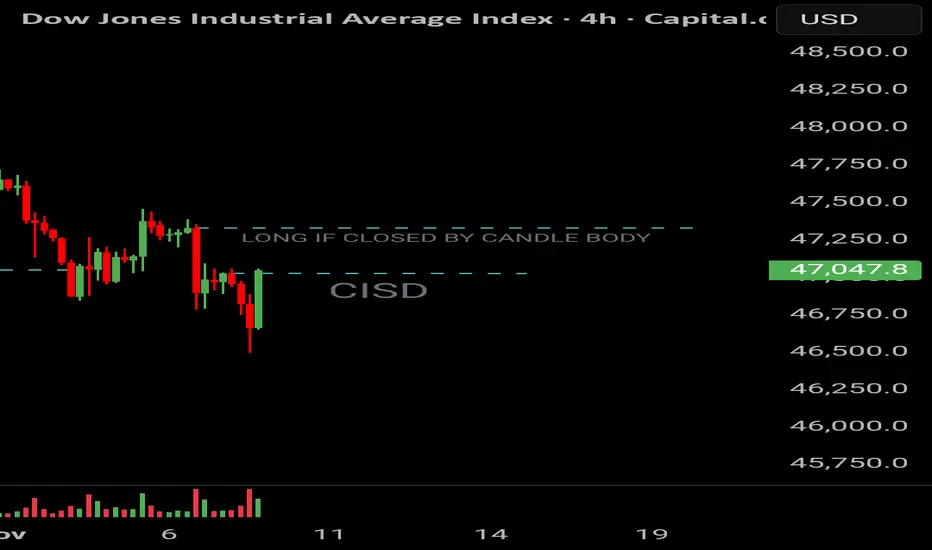
Possible entryWe can see that the price may go up if closed with the body in that upper line ( by my strategy).
Dow Jones IndexThis week, the Dow Jones Index will maintain an upward trend, albeit at a slower pace compared to previous weeks. The short-term target will be met around the 48,160 level, and naturally, the market will reach that point. Following that, depending on market conditions, we will assess whether the upward trend will continue or if a decline will occur.

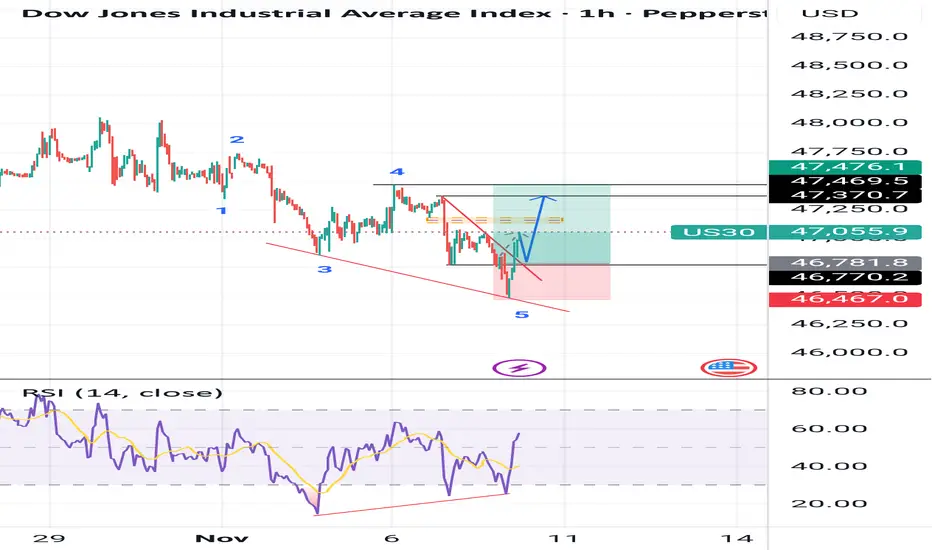
US30 Strategy: Waiting for Confirmation Amid Conflicting Trends🔥📉 Currently checking out the US30 (Dow Jones)! On the ⏰ 4-hour chart, the vibe is definitely bearish, but when you zoom out to the 📅 daily chart, things look much more bullish 🚀. For me, this index is at a real crossroads! 👉
🔎 On the 30-minute chart, I’m watching closely for a bullish breakout above the recent high and a key break of structure 🟢📈 — that would spark a potential buy opportunity!
💼 If instead, price slips below the current high and we see a bearish shift in structure 🚩📉, I’m eyeing a possible sell setup!
❗️Of course, this is just my view, not financial advice! 🚫💸

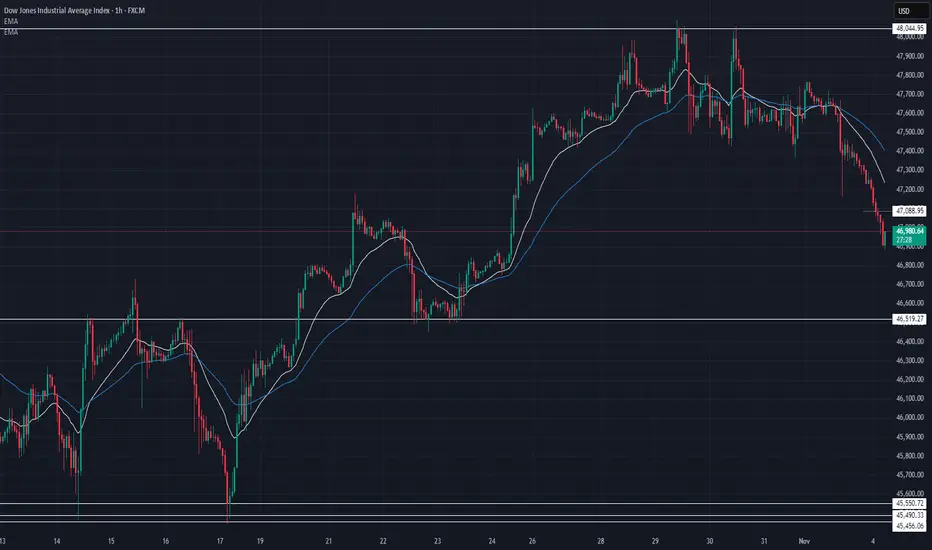
US30 Technical Breakdown – 11/04/2025📍 US30 Technical Breakdown – 11/04/2025
US30 faced heavy selling pressure after rejecting the 48,000 psychological resistance 🚫 The index has been in a steady decline since, currently sitting near 46,950, testing the mid-range structure support 👀
📊 Market Behavior:
🔹 Clean rejection from 48,000 → clear short-term shift in sentiment
🔹 Price trading below both EMAs → momentum favoring sellers
🔹 47,000 area acting as temporary support — watch for a bounce or breakdown
📌 Key Levels:
🔹 Resistance Zones:
47,400 → intraday EMA resistance
47,700 → lower high zone
48,000 → key breakout barrier
🔹 Support Zones:
46,900 → current structure support
46,520 → major demand area
46,000 → deeper correction level
🧠 Bias:
Short-term bearish ⚠️
➡️ Below 46,900 → sellers in control
⬆️ Break above 47,400 → potential reversal zone
US30 Trade Set Up Nov 4 2025Price pushed down hard during Asia and London and is making bearish structure so i will be looking for sells either after a sweep of BSL and tap into 4h FVG or if we invert this 15m FVG with a retest i will take sells down to SSL/London lows and lower 4h FVG

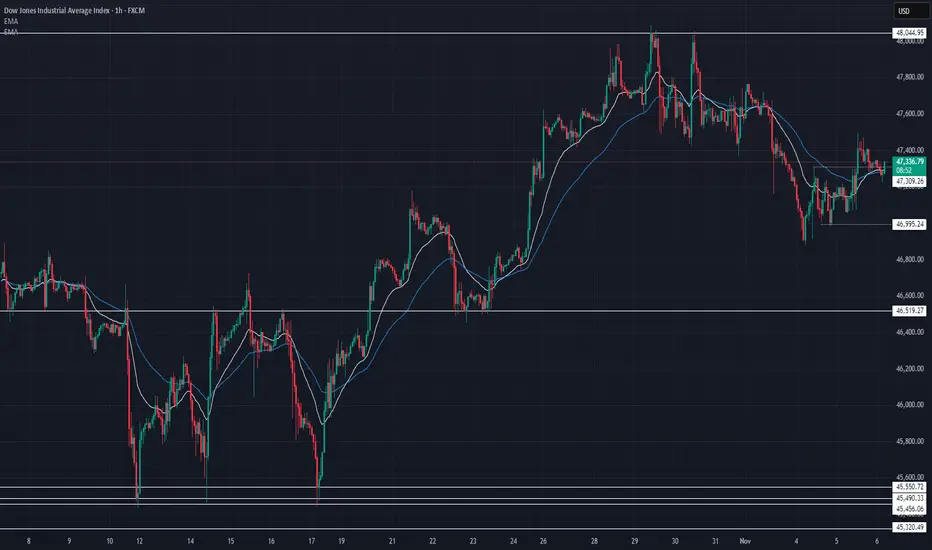
US30 Technical Breakdown – 11/06/2025📍 US30 Technical Breakdown – 11/06/2025
US30 is showing some early signs of stabilization after yesterday’s dip 🔄 Buyers stepped in near 47,000 to defend key support, pushing price slightly above EMAs — hinting at a potential short-term recovery.
📊 Market Behavior:
🔹 Rejection from 48,000 still holding strong
🔹 Bounce from 47,000 → short-term higher low forming
🔹 EMAs flattening → indecision phase before next move
📌 Key Levels:
🔹 Resistance:
47,400 → intraday EMA cap
47,650 → minor supply zone
47,900–48,000 → key psychological resistance
🔹 Support:
47,000 → major short-term demand
46,520 → strong structure level
45,550 → key swing low zone
🧠 Bias:
Neutral to mildly bullish ⚖️
⬆️ Above 47,400 → potential push toward 47,650–47,900
⬇️ Below 47,000 → momentum shifts back to bears
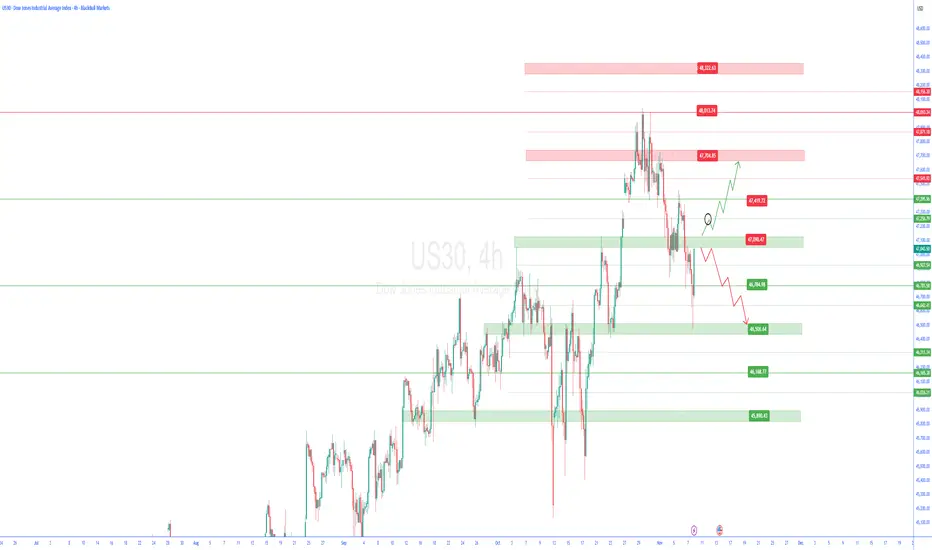
us30 4h🔹 Overall Outlook and Potential Price Movements
In the charts above, we have outlined the overall outlook and possible price movement paths.
As shown, each analysis highlights a key support or resistance zone near the current market price. The market’s reaction to these zones — whether a breakout or rejection — will likely determine the next direction of the price toward the specified levels.
⚠️ Important Note:
The purpose of these trading perspectives is to identify key upcoming price levels and assess potential market reactions. The provided analyses are not trading signals in any way.
✅ Recommendation for Use:
To make effective use of these analyses, it is advised to manually draw the marked zones on your chart. Then, on the 15-minute time frame, monitor the candlestick behavior and look for valid entry triggers before making any trading decisions.
US30 BUY WITH LIMIT ORDER!!!!!US30 made a strong rejections off the order block zone am going to be positioning for a buy entry on the pull back in the inside bar candle on the buy zone i marked....

US30 Eyes 47,200 for Potential BounceHey Traders, in today’s trading session we’re monitoring US30 for a potential buying opportunity around the 47,200 zone.
The Dow Jones continues to trade in a broader uptrend, and price action is currently in a correction phase, approaching the 47,200 support and resistance confluence area — a key zone where buyers may look to step back in.
Watching for a bullish reaction at this level to confirm continuation of the prevailing trend.
Share your view below — do you think US30 holds this zone or breaks lower?
Trade safe,
Joe.

DOW JONES HIGH PROBABILITY SETUPS SOON!!!🚨 DOW30 HIGH PROBABILITY SELL/BUY SETUP 🚨
* Here We Can See Clearly The Next Potential Moves For US30 Coming Hours/Days.
* Keep Your Eyes Close On Your Trading Positions.
* Happy PIP Hunting Traders.
FXKILLA.

US30 – Buyers Defend Pivot | Holding 47080 Keeps Trend IntactUS30 – MARKET OUTLOOK | Bullish Bias Above 47080
US30 continues to trade with a bullish tone while holding above 47080, supported by stronger sentiment across U.S. equities.
Above 47080: Bullish continuation toward 47300 → 47460 → 47760.
Below 47080: Bearish correction possible toward 46910 → 46600.
Pivot: 47100
Support: 46910 · 46610 · 46450
Resistance: 47310 · 47460 · 47760
US30 remains bullish while above 47080, but a confirmed 1H close below this level could trigger a short-term bearish correction toward 46910–46600.

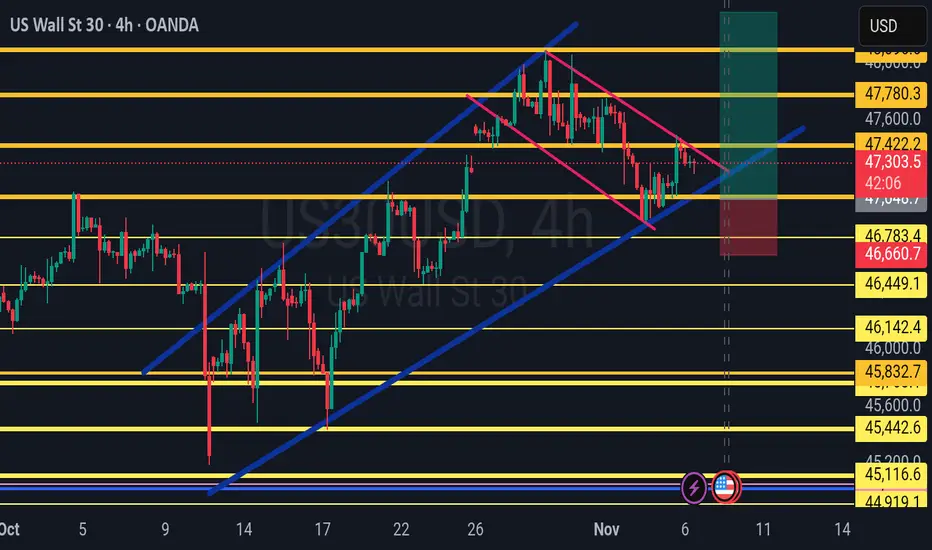
US30 LONG SETUP Price is looking to test 48.000 again after a strong correction that pushed it back to 47. region. Healthy support around 47 has been met on point with the 50% fib level. Strong push back to 48 is promising.
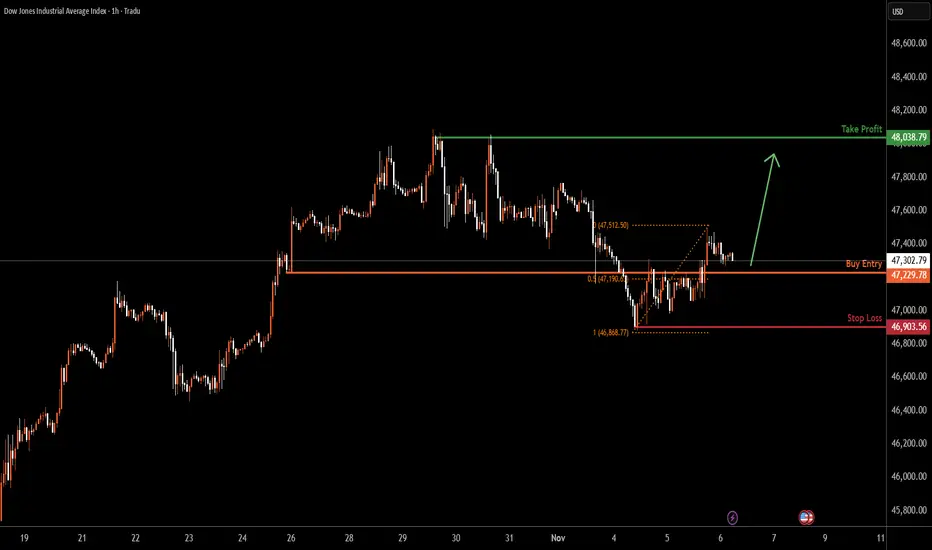
US30 H1 | Bullish Bounce Off 50% Fibonacci SupportUS30 is falling towards the buy entry at 47,229.78, whichis an overlap support that aligns witht he 50% Fibonacci retracement and could bounce from this level to the upside.
Stop loss is at 46,903.56, which is a swing low support.
Take profit is at 48,038.79, which is a multi swing high resistance.
Stratos Markets Limited (tradu.com ):
CFDs are complex instruments and come with a high risk of losing money rapidly due to leverage. 68% of retail investor accounts lose money when trading CFDs with this provider. You should consider whether you understand how CFDs work and whether you can afford to take the high risk of losing your money.
Stratos Europe Ltd (tradu.com ):
CFDs are complex instruments and come with a high risk of losing money rapidly due to leverage. 70% of retail investor accounts lose money when trading CFDs with this provider. You should consider whether you understand how CFDs work and whether you can afford to take the high risk of losing your money.