DJ30 ShortHere is my short setup on the Dow Jones, the bottom grey box is where I will take my first set of profits. BLACKBULL:US30
Trade ideas

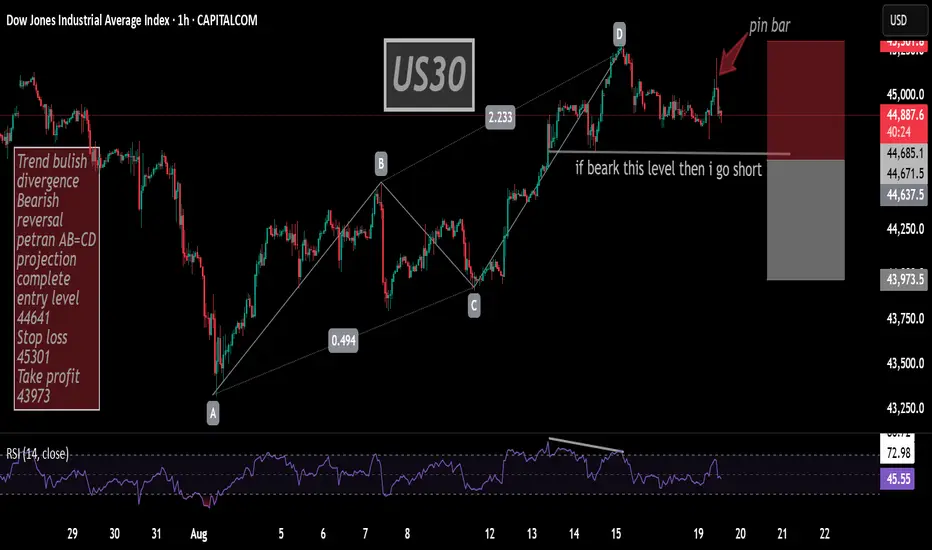
US30Trend bulish
divergence Bearish also pin bar at top
reversal petran AB=CD projection complete
entry level 44641
Stop loss 45301
Take profit 43973
Aug ~12th UpEssentially, the resistance below has turned into a huge wall of support.
Going to need a few days to consolidate, but the ingredients are there and ready to cook. Maybe not exactly on the 12th. Expect rally to last until early Sept. once it starts.
Not giving any start or SL because I suck at technical analysis. You do you.

Multi-Month iHS Ready for BreakoutMega iHS has formed over the past 10 months.
Entry: Neckline Breach
Exit: Fibs, MM, 51-55k
SL: LL, <43k
NFA

Us30We hit tp tomorrow I will share my analysis of gold us30 nas100 Ger30 EurJpy
Good day we done for the day

US30 Price currently stuck in supplyPrice has been stuck in that supply zone since Friday. If it continues to hold it will eventually apply pressure to the downside and we should therefore short the index and target the next demand zone.

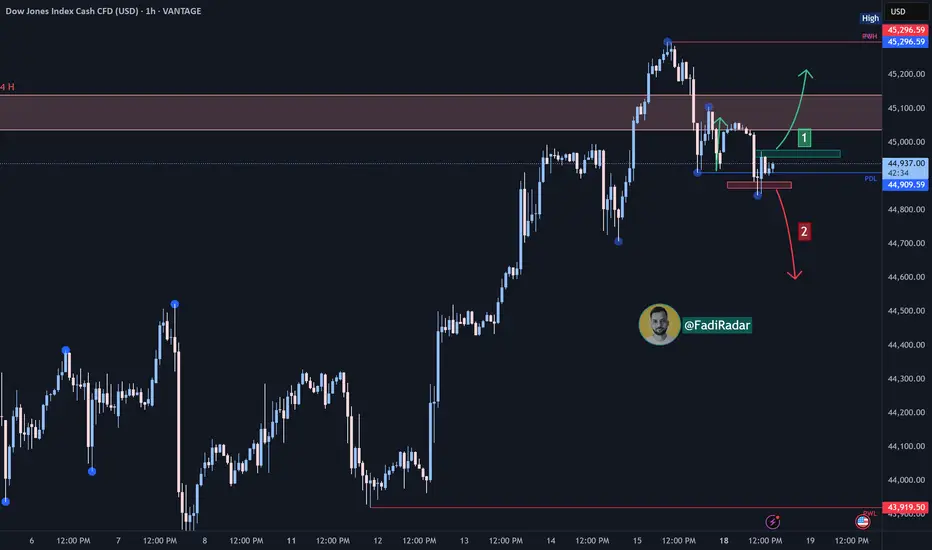
Dow Jones Analysis (US30 / Dow Jones):The index is currently trading in a long-term bullish trend, while moving within a corrective bearish channel on the hourly timeframe.
1️⃣ Bullish Scenario (More Likely):
If bullish momentum continues and the index holds above 45,000, it may target 45,200. Sustained buying pressure could push the price toward a new high.
2️⃣ Bearish Scenario:
If the price breaks below 44,870 and stabilizes under it, the index could retest 44,700, with further downside potential toward 44,500 if selling pressure persists.

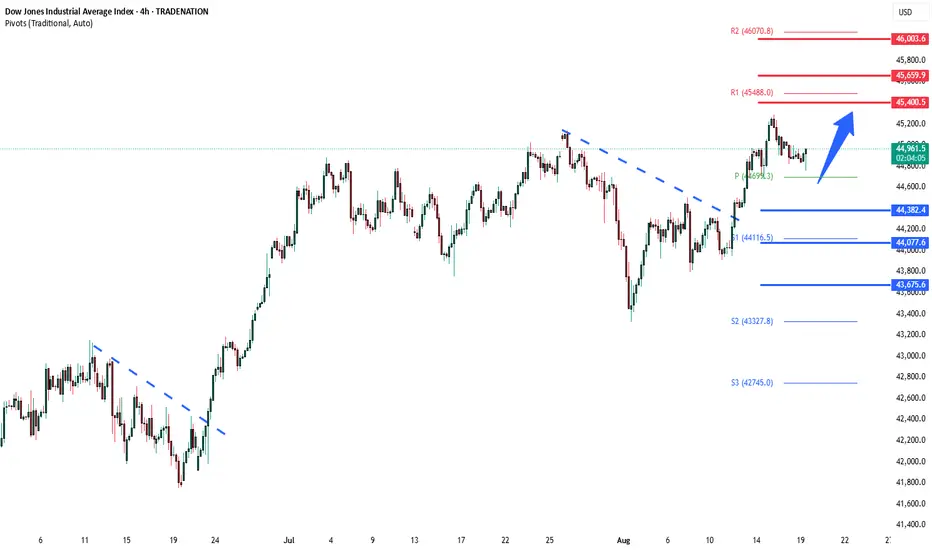
DowJones range trading below ATHKey Support and Resistance Levels
Resistance Level 1: 45400
Resistance Level 2: 45660
Resistance Level 3: 46000
Support Level 1: 44380
Support Level 2: 44080
Support Level 3: 43675
This communication is for informational purposes only and should not be viewed as any form of recommendation as to a particular course of action or as investment advice. It is not intended as an offer or solicitation for the purchase or sale of any financial instrument or as an official confirmation of any transaction. Opinions, estimates and assumptions expressed herein are made as of the date of this communication and are subject to change without notice. This communication has been prepared based upon information, including market prices, data and other information, believed to be reliable; however, Trade Nation does not warrant its completeness or accuracy. All market prices and market data contained in or attached to this communication are indicative and subject to change without notice.


US30 Outlook: Earnings in Focus, 44,950 Key PivotUS30 Overview
The price action today is likely to be influenced by Home Depot NYSE:HD earnings.
If the 4H candle closes above 44,950, this would strengthen the bullish outlook, opening the way toward 45,100 and 45,285.
However, as long as the index trades below 44,950, the bias remains bearish, targeting 44,720 and 44,610.
In summary, while below 44,950, the market remains in a bearish trend.
Support Levels: 44,720, 44,610, 44,470
Resistance Levels: 45,100, 45,285

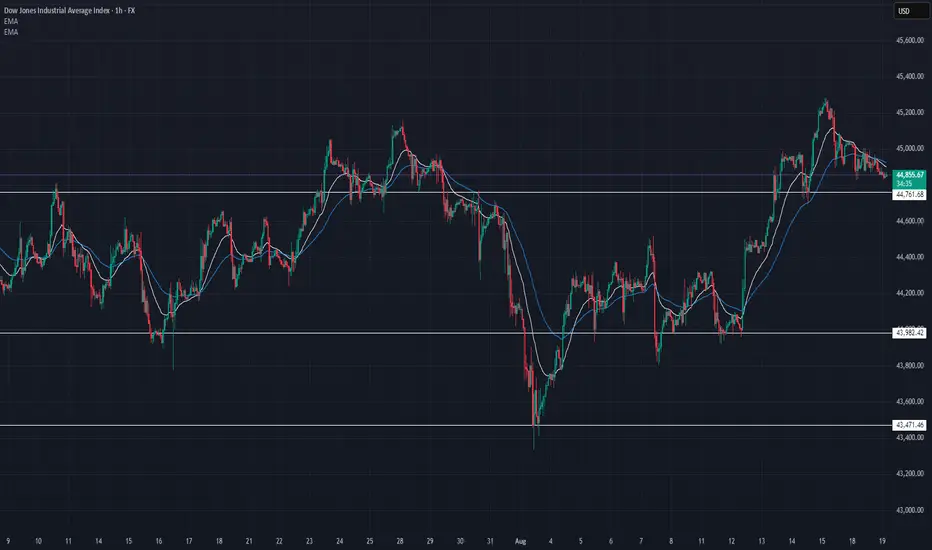
US30 Technical Breakdown – 08/19/2025📍 US30 Technical Breakdown – 08/19/2025
US30 is currently trading around 44,859, pulling back after failing to sustain above 45,200. Price rejected from the upper range and is now sitting just above the 44,761 support zone.
The EMAs are flattening, showing momentum stalling. If 44,761 gives way, bears could press back toward 43,982. Bulls must reclaim 45,000–45,200 to regain control.
📊 Current Market Behavior:
📉 Rejected from 45,200 high
📊 Testing support at 44,761
📉 EMAs flattening → neutral momentum
⚠️ Range-bound between 45,200 & 44,761
📌 Key Levels:
🔹 Resistance Zones:
45,000–45,200 → Immediate barrier
45,400–45,600 → Next upside zone
🔹 Support Zones:
44,761 → Key intraday support
43,982 → Demand base
43,471 → Major swing low
🧠 Bias:
📉 Short-term Neutral / Bearish tilt
Dow Jones Wave Analysis – 18 August 2025
- Dow Jones reversed from strong resistance level 45000.00
- Likely to fall to support level 44500.00
Dow Jones index recently reversed down from the resistance zone located between the strong resistance level 45000.00 (which has been reversing the price from the end of 2024) and the upper daily Bollinger Band.
The downward reversal from this resistance zone created the daily Japanese candlesticks reversal pattern Shooting Star.
Given the strength of the resistance level 45000.00 and the overbought daily Stochastic, Dow Jones index can be expected to fall to the next support level 44500.00.

US30 UPDATE - Preparing to SHORTDear Friends in Trading,
How I see it,
Zoomed in on 1HR
Price is at a very strong resistance area at this time.
Multiple rejections especially on bigger timeframes increases the potential to
to fall towards the PIVOT/POC area as per my 4HR analysis.
Keynote:
Only a clear and decisive breach above 45018, can potentially rally towards 45140
I sincerely hope my point of view offers a valued insight
Thank you for taking the time study my analysis.

Correction A corrective and fluctuating trend is expected to form and advance to the support area. Then there is a possibility of a trend change and the start of an upward trend.

Dow Jones Index Analysis (US30 / Dow Jones):The index is currently trading in a bullish trend on the broader outlook, while moving within a corrective downward channel on the hourly timeframe.
🔺 Bullish Scenario:
If the bullish momentum continues and the price holds above the 44,970 level, it may target 45,000 followed by 45,200.
🔻 Bearish Scenario:
If the price breaks below the nearby support at 44,870 and stabilizes under it, this may push the index toward testing 44,770, and continued selling pressure could extend the decline toward 44,500.