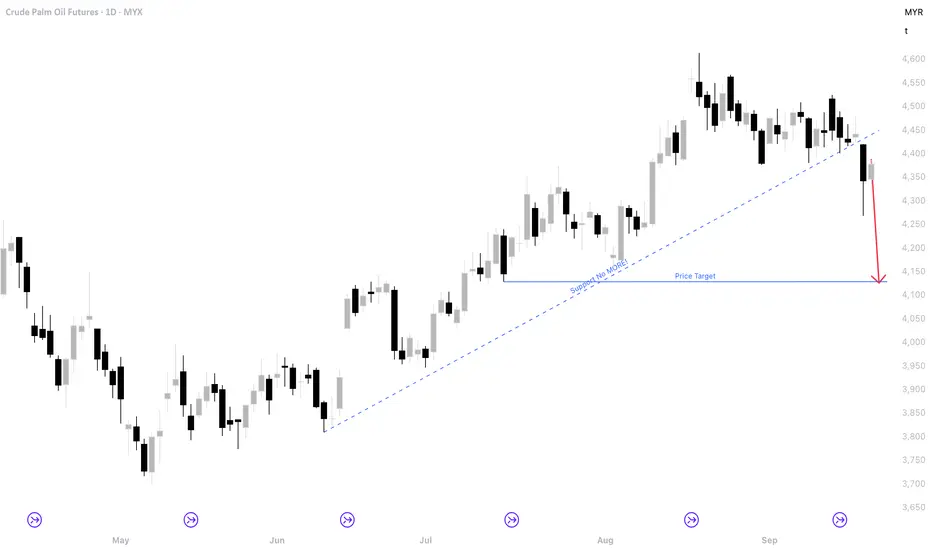
FCPO Week 39 2025: To test 4100!A month of consolidation and price didn't break higher and instead looking to go lower. 4100 might be the area to test. Looking for opportunity to SELL.
CPOG2029 trade ideas
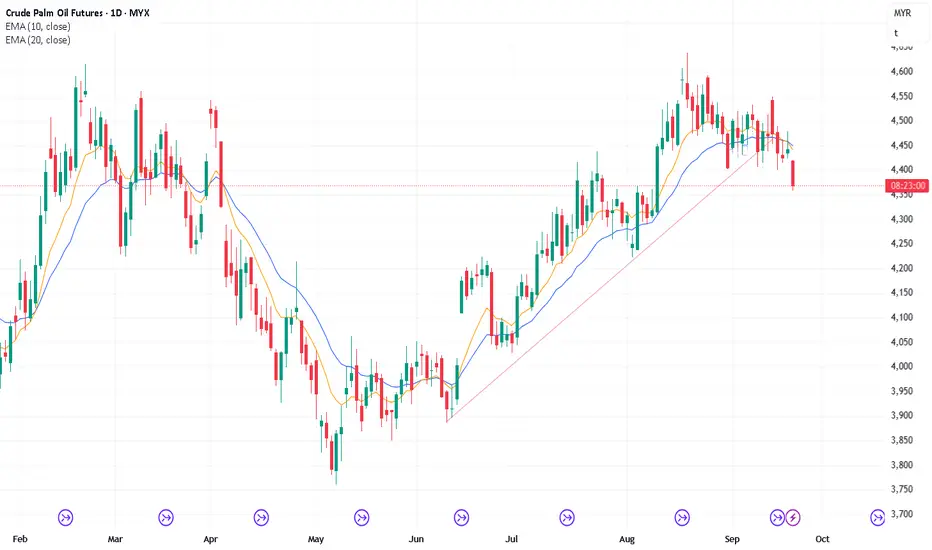
25/9/25 No FT Selling, Bulls Want Close Above 20-Day EMA
Wednesday’s candlestick (Sept 24) was an inside bull bar closing near its high.
In our last report, we stated that traders would see if the bears can create follow-through selling, even if it is only a bear doji, or if the market would close with a bull body, testing near the recent tight trading range (the 4400 area) instead.
The bears were not able to create sustained follow-through selling. The market tested above the 4400 area in the night session.
The bulls view the recent move as a deeper two-legged pullback and want a reversal from a large double bottom bull flag (Aug 29 and Sep 23).
They want the pullback to lack follow-through selling, as has been the case with all recent pullbacks (July 1 and August 4). So far, this appears to be the case.
They want the move (Sep 23) to turn into a bear trap.
They want the breakout to fail, reversing back into the trading range (around the 4450 area). The market tested the 4450 in the night session.
Next, the bulls want the market to close above the 20-day EMA. They want the weekly candlestick to close as a strong bull bar near its high with a long tail above.
They must create more follow-through buying over the next two days.
The bears got a deep pullback and a breakout below the tight trading range, trading below the 20-day EMA and the bull trend line.
However, the move lacked sustained follow-through selling.
The bears hope that the current move is a retest of the breakout point.
They want the 20-day EMA to act as resistance, followed by at least a small sideways to down leg to retest the Sept 23 low.
They need to create strong bear bars to increase the odds of a reversal.
Production for Sept should be flat or down. Oct's production should be flat to down as well.
Refineries' appetite to buy remains decent.
Export: Sept: First 20 days +8% per ITS.
So far, the market has broken out below the tight trading range, but follow-through selling has been limited.
For tomorrow (Thursday, Sept 25), traders will see if the bulls can create strong follow-through buying, closing above the 20-day EMA.
Or will the market stall around the 20-day EMA (around 4450 area), followed by a second leg sideways to down to retest the Sept 23 low instead?
Andrew

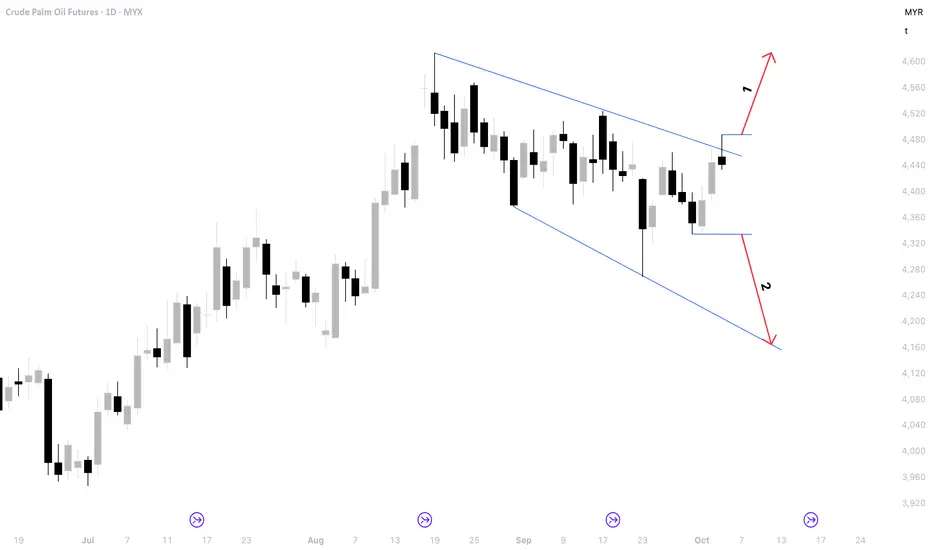
FCPO Week 41 2025: 4100 or 4600?2 scenarios next week MYX:FCPO1! :
1) Bullish: if price close above 4490 then it is bullish towards 4600.
2) Bearish: if price close below 4330 then it is bearish towards 4100.
3) Consolidation: If you trade consolidation there are about plus minus 150 points in between bullish and bearish scenarios.
Happy trading and good luck!
FCPO Weekly Roundup: Week Ending October 03, 2025— Strategic Commodity Insight — 🔶📊🌴
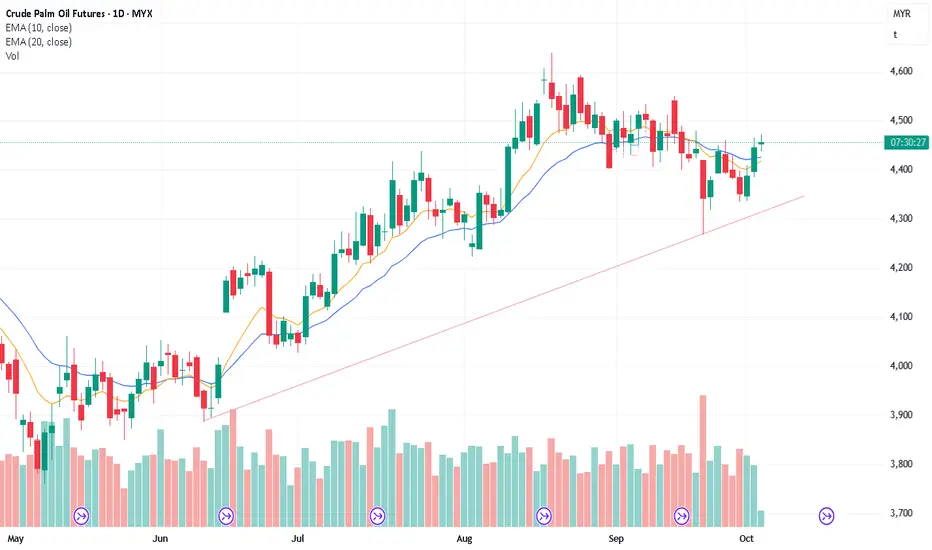
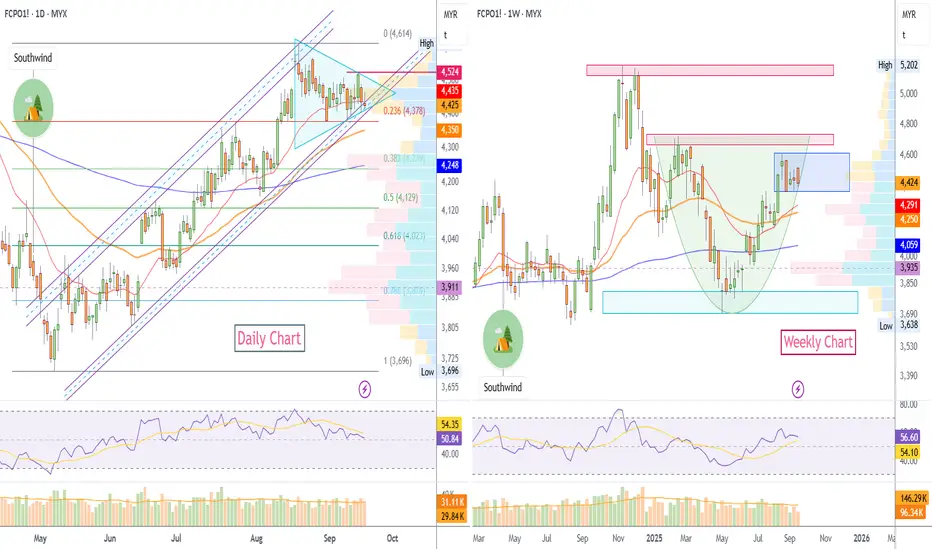
FCPO's technical posture is constructively bullish, as the price coils within a well-defined bull flag on the daily chart. This consolidation is acting as the "handle" for a larger "cup and handle" formation visible on both daily and weekly timeframes, a pattern that strongly suggests a potential upside continuation.
Detailed Analysis ✨
Cup and Handle / Bull Flag Formation: The market carved out a broad, rounding bottom (the "cup") from May through August. The subsequent pullback has formed a textbook descending channel (the "handle" or bull flag). This coiling price action is typical before a major trend resumption.
Supply Zone and Profit-Taking: The reason for the recent stalled momentum is clear: the price is grappling with the significant overhead supply zone between 4,450 and 4,724 MYR. This area represents prior highs where buyers are now exiting positions, causing intraday gains to fade as the market absorbs this trapped supply. Each attempt to break higher has been met with profit-taking, but the pattern of higher lows within the flag remains intact.
Breakout Potential: The price is now approaching the apex of the bull flag, suggesting a breakout is becoming more likely. A decisive close above the flag's upper trendline (currently near 4,525 MYR) would be the first signal, with confirmation on a move above the cup's rim at the 4,614–4,724 MYR resistance zone.
Updated Key Levels and Outlook 🎯
Immediate Resistance: The upper channel line of the bull flag around 4,525 MYR.
Major Breakout Level: A sustained close above the 4,614 MYR pivot is required to validate the cup-and-handle pattern and trigger the next leg higher.
Primary Support: The base of the handle at 4,262–4,214 MYR remains the critical level to hold. A break below this would invalidate the bullish setup.
Takeaway: The combination of a cup-and-handle pattern with a bull flag handle points to a high probability of an upside resolution in the coming week. While sellers at the supply zone are providing friction, the underlying structure suggests buyers are accumulating strength for a breakout attempt. Watch for a close above 4,614 MYR to confirm the start of a new uptrend 🚀

3/10/25 Can Bulls Get a Strong Weekly Candlestick?
Thursday’s candlestick (Oct 2) was a follow-through bull bar closing in its upper half with a prominent tail above.
In our last report, we stated that traders would observe whether the bulls could create more follow-through buying, closing above the 20-day EMA, or if the market would test near the 20-day EMA but stall and trade lower instead.
The market traded higher and closed above the 20-day EMA.
The bulls view the recent move (Sep 23) as a deeper two-legged pullback and want a reversal from a double bottom bull flag (Aug 29 and Sep 23) and a large double bottom bull flag (Aug 4 and Sep 23).
They view the recent move (Sept 30) as a retest of the prior low (Sept 23), and want the pullback to lack follow-through selling, forming a higher low. So far, this is the case.
They want a retest of the August high, even if it only forms a lower high.
They must create follow-through buying above the 20-day EMA to increase the odds of the market trading higher.
The bears got a deep pullback and a breakout below the tight trading range (Sep 23), but the move lacked sustained follow-through selling.
They see the current move as a pullback and want the 20-day EMA to act as resistance.
They want the market to form a double top bear flag with the Sept 26 high.
They need to create strong bear bars below the 20-day EMA to increase the odds of a reversal.
Production for Oct should be down.
Refineries' appetite to buy remains decent.
Export: Oct export remains to be seen.
The bulls want a strong bull bar today so that the weekly candlestick will close near its high and above last week's high. If this is the case, odds slightly favor next week to trade at least a little higher.
The bears want a strong bear bar closing below the 20-day EMA today, so that the weekly candlestick will close as a doji or with a small bear body, reducing the recent bullishness.
For today (Friday, Oct 3), traders will see if the bulls can create a strong bull bar closing near its high. If they do, the weekly candlestick will close near its high, which will increase the bullishness for next week.
Or will the market stall and reverse below the 20-day EMA instead?
Andrew
2/10/25 Bulls Need Strong Close Above 20-Day EMA
Wednesday’s candlestick (Oct 1) was a bull bar closing in its upper half with a prominent tail above.
In our last report, we stated that traders would observe whether the bears could create more follow-through selling testing near the Sept 23 low, or if the move would start to stall at a higher low, followed by a reversal above the 20-day EMA in the weeks ahead.
The market stalled at a higher low (vs Sep 23) so far, and traded higher for the day.
The bulls view the recent move (Sep 23) as a deeper two-legged pullback and want a reversal from a double bottom bull flag (Aug 29 and Sep 23) and a large double bottom bull flag (Aug 4 and Sep 23).
They view the recent move (Sept 30) as a retest of the prior low (Sept 23), and want the pullback to lack follow-through selling, forming a higher low. So far, this is the case.
They want a retest of the August high, even if it only forms a lower high.
They must create follow-through buying above the 20-day EMA to increase the odds of the market trading higher.
The bears got a deep pullback and a breakout below the tight trading range (Sep 23), but the move lacked sustained follow-through selling.
They then got a small second leg sideways to down leg to retest the Sept 23 low, and the move formed a higher low (Sep 30) so far.
They see the current move as a pullback and want the 20-day EMA to act as resistance. They want the market to form a double top bear flag with the Sept 26 high.
They need to create strong follow-through selling below the 20-day EMA to increase the odds of a reversal.
Production for Oct should be down.
Refineries' appetite to buy remains decent.
Export: Oct export remains to be seen.
For today (Thursday, Oct 2), traders will see if the bulls can create more follow-through buying, closing above the 20-day EMA.
Or will the market test near the 20-day EMA but stall and trade lower instead?
Andrew

1/10/25 Can Bears Get More FT Selling or Start to Stall?
Tuesday’s candlestick (Sept 30) was a bear bar closing in its lower half with a prominent tail below.
In our last report, we stated that traders would observe whether the bears could create strong follow-through selling, testing near the Sept 23 low, or if the move would lack follow-through selling and instead be followed by a reversal above the 20-day EMA.
The market continues to trade slightly lower, and the bears got some follow-through selling.
The bulls view the recent move (Sep 23) as a deeper two-legged pullback and want a reversal from a large double bottom bull flag (Aug 29 and Sep 23).
They want the pullback to lack follow-through selling, forming a higher low.
They see the current move (Sept 30) as a retest of the prior low (Sep 23), and want it to form a higher low.
They want a retest of the August high, even if it only forms a lower high.
They must create follow-through buying above the 20-day EMA to increase the odds of the market trading higher.
The bears got a deep pullback and a breakout below the tight trading range, but the move lacked sustained follow-through selling.
They want at least a small second leg sideways to down leg to retest the Sept 23 low.
So far, the second leg sideways to down is still a higher low (Sep 30).
They need to create strong follow-through selling to increase the odds of retesting the Sept 23 low.
Production for Oct should be down.
Refineries' appetite to buy remains decent.
Export: Sept: export +9% per ITS.
The monthly candlestick closed as a bear bar in its lower half with a prominent tail below.
There is a 5-bar bull microchannel on the monthly candlestick indicating persistent buying. There may be buyers below the first pullback.
For tomorrow (Wednesday, Oct 1), traders will see if the bears can create more follow-through selling testing near the Sept 23 low.
Or will the move start to stall at a higher low, followed by a reversal above the 20-day EMA in the weeks ahead instead?
Andrew

30/9/25 - Last Trading Day of The Month
Monday’s candlestick (Sept 29) was a small bear bar closing near its low with a long tail above.
In our last report, we stated that traders would observe whether the bears could create strong follow-through selling testing near the Sept 23 low, or if the move would lack follow-through selling, followed by a reversal above the 20-day EMA instead.
The market traded slightly lower and the follow-through selling is still limited.
The bulls view the recent move (Sep 23) as a deeper two-legged pullback and want a reversal from a large double bottom bull flag (Aug 29 and Sep 23).
They want the pullback to lack follow-through selling, as has been the case with all recent pullbacks (July 1 and August 4). So far, this appears to be the case.
They want the move (Sep 23) to turn into a bear trap.
They want a retest of the August high, even if it only forms a lower high.
They must create follow-through buying above the 20-day EMA to increase the odds of the market trading higher.
The bears got a deep pullback and a breakout below the tight trading range, but the move lacked sustained follow-through selling.
They want the 20-day EMA to act as resistance, followed by at least a small second leg sideways to down leg to retest the Sept 23 low.
So far, the second leg sideways to down is weak (Sep 29), and forming a higher low.
They need to create strong follow-through selling to increase the odds of retesting the Sept 23 low.
Production for Sept should be flat or down. Oct's production should be flat to down as well.
Refineries' appetite to buy remains decent.
Export: Sept: First 25 days +12% per ITS.
The monthly candlestick will close after tomorrow's session. The bulls want the monthly candlestick to close with a bull body, while the bears want a bear body.
Tomorrow will determine whether the monthly candlestick will close bullish, bearish or neutral.
For tomorrow (Tuesday, Sept 30), traders will see if the bears can create strong follow-through selling testing near the Sept 23 low.
Or will the move lack follow-through selling, followed by a reversal above the 20-day EMA instead?

29/9/25 - Next 2 Days Will Determine the Monthly Candlestick
Friday’s candlestick (Sept 26) was an outside bear bar closing near its low with a long tail above.
In our last report, we stated that traders would see if the bulls can create strong follow-through buying, closing above the 20-day EMA, or if the market would stall around the 20-day EMA (around the 4450 area), closing below the 20-day EMA instead.
The market traded higher to test the 4450 area but lacked follow-through buying, reversing to close below the 20-day EMA.
The bulls view the recent move as a deeper two-legged pullback and want a reversal from a large double bottom bull flag (Aug 29 and Sep 23).
They want the pullback to lack follow-through selling, as has been the case with all recent pullbacks (July 1 and August 4). So far, this appears to be the case.
They want the move (Sep 23) to turn into a bear trap.
They want the breakout from the trading range to fail, reversing back into the trading range (around the 4450 area).
They want a retest of the August high, even if it only forms a lower high.
They must create follow-through buying above the 20-day EMA to increase the odds of the market trading higher.
The bears got a deep pullback and a breakout below the tight trading range, but the move lacked sustained follow-through selling.
The bears hope that the current move (Sept 26) is a retest of the breakout point.
They want the 20-day EMA to act as resistance, followed by at least a small sideways to down leg to retest the Sept 23 low.
They need to create strong follow-through selling early next week.
Production for Sept should be flat or down. Oct's production should be flat to down as well.
Refineries' appetite to buy remains decent.
Export: Sept: First 25 days +12% per ITS.
The monthly candlestick will close after Tuesday's session. The bulls want the monthly candlestick to close with a bull body, while the bears want a bear body.
The next two trading days will determine whether the monthly candlestick will close bullish, bearish or neutral.
For tomorrow (Monday, Sept 29), traders will see if the bears can create strong follow-through selling testing near the Sept 23 low.
Or will the move lack follow-through selling, followed by a reversal above the 20-day EMA instead?
Andrew

26/9/25 Bulls Want Strong Weekly Candlestick
Thursday’s candlestick (Sept 25) was a bull bar closing near its high with a small tail above.
In our last report, we stated that traders would see if the bulls could create strong follow-through buying, closing above the 20-day EMA, or if the market would stall around the 20-day EMA (around the 4450 area), followed by a second leg sideways to down to retest the Sept 23 low instead.
The market traded higher to test 4450, but has not closed above it yet.
The bulls view the recent move as a deeper two-legged pullback and want a reversal from a large double bottom bull flag (Aug 29 and Sep 23).
They want the pullback to lack follow-through selling, as has been the case with all recent pullbacks (July 1 and August 4). So far, this appears to be the case.
They want the move (Sep 23) to turn into a bear trap.
They want the breakout from the trading range to fail, reversing back into the trading range (around the 4450 area). The market is now trading around this area.
Next, the bulls want the market to close above the 20-day EMA. They want the weekly candlestick to close as a strong bull bar near its high with a long tail above.
They must create a strong bull bar tomorrow to end the week on a high note.
The bears got a deep pullback and a breakout below the tight trading range, but the move lacked sustained follow-through selling.
The bears hope that the current move is a retest of the breakout point.
They want the 20-day EMA to act as resistance, followed by at least a small sideways to down leg to retest the Sept 23 low.
If the market trades higher, they want the 4500-50 area to act as resistance, forming a lower high and a double top.
They need to create strong bear bars to show they are in control.
Production for Sept should be flat or down. Oct's production should be flat to down as well.
Refineries' appetite to buy remains decent.
Export: Sept: First 20 days +12% per ITS.
So far, the market has reversed back into the trading range, which is a magnet.
The bulls want Friday to close as a strong bull bar. If they get this, the weekly candlestick will close near its high with a long tail below, increasing the odds of next week trading at least a little higher.
The bears want Friday to close as a strong bear bar. They want the weekly candlestick to close with a bear body and below the middle of its range.
For tomorrow (Friday, Sept 26), traders will see if the bulls can create strong follow-through buying, closing above the 20-day EMA.
Or will the market stall around the 20-day EMA (around the 4450 area), closing below the 20-day EMA instead?
Andrew
24/9/25 Can Bears Create FT Selling or Fail To Do So?
Tuesday’s candlestick (Sept 23) was a big bear bar closing around the middle of its range with a long tail below.
In our last report, we stated that traders would observe whether the bears could get a strong bear bar closing near its low, or if there would be a prominent tail below the daily candlestick, indicating some profit-taking activity.
The market gap down further in the morning, but lacked follow-through selling. The market traded sideways to up for the day.
The bulls view the current move as a deeper two-legged pullback and want a reversal from a large double bottom bull flag (Aug 29 and Sep 23).
They want the pullback to lack follow-through selling, as has been the case with all recent pullbacks (July 1 and August 4).
They want the move (Sep 23) to turn into a bear trap.
They want the breakout to fail, reversing back into the trading range (around the 4450 area).
They must create strong bull bars to show they are back in control.
The bears got a deep pullback from a larger double top bear flag (Sept 9 and Sept 17).
They got a breakout below the recent tight trading range, trading below the 20-day EMA and the bull trend line.
The long tail below today's candlestick indicates the bears are not yet as strong as they could be.
They need sustained follow-through selling to increase the odds of a reversal.
Production for Sept should be flat or down. Oct's production should be flat to down as well.
Refineries' appetite to buy remains decent.
Export: Sept: First 20 days +8% per ITS.
So far, the bears have managed to break out of the tight trading range.
Traders will see if the bears can create follow-through selling, or they will fail to do so, as seen in recent major pullbacks (July 1 and August 4).
For tomorrow (Wednesday, Sept 24), traders will see if the bears can create follow-through selling, even if it is only a bear doji.
Or will the market close with a bull body, testing near the recent tight trading range (the 4400 area) instead?
Andrew

23/9/25 Strong Breakout from Tight Trading Range
Monday’s candlestick (Sept 22) was a bull doji closing in its lower half with a long tail above.
In our last report, we stated that traders would see if the bears could create follow-through selling below the 20-day EMA, or if the move would lack follow-through selling (again), reversing above the 20-day EMA later in the week.
The market traded higher to test the 20-day EMA but reversed and closed below it. The market gap down and sold off during the night session.
The bulls see the current move as a deeper pullback.
They want the pullback to lack follow-through selling, as has been the case with all recent pullbacks (July 1 and August 4).
They must create strong bull bars to show they are back in control.
The bears view the move (Sep 17) as forming a larger double top bear flag (Sept 9 and Sept 17).
They got a breakout below the recent tight trading range, trading below the 20-day EMA and the bull trend line.
They need sustained follow-through selling to increase the odds of a strong reversal.
Production for Sept should be flat or down. Oct's production should be flat to down as well.
Refineries' appetite to buy remains decent.
Export: Sept: First 20 days +8% per ITS.
So far, the bears have managed to break out of the tight trading range. The market could still trade sideways to down for now.
For tomorrow (Tuesday, Sept 23), traders will see if the bears get a strong bear bar closing near its low. If this is the case, the market could still trade lower on Wednesday.
Or will there be a prominent tail below the daily candlestick, indicating some profit-taking activity?
Andrew
22/9/25 Bears Need FT, Can They Do It?
Friday’s candlestick (Sept 19) was an inside doji closing in its lower half with a long tail above.
In our last report, we stated that traders would observe whether the bears could create a strong bear bar closing near its low, or if the market would trade sideways to up instead.
The market traded higher to test the 20-day EMA but reversed and closed near its low. The weekly candlestick closed as a bear bar with a small tail below.
The bulls want the 20-day EMA and the bull trend line to act as support. They want the current move to form a bear trap.
They want the pullback to be weak and sideways, lacking follow-through selling, as has been the case with all recent pullbacks (Jul 1 and Aug 4).
They want it to form a wedge bull flag (Aug 29, Sep 10, and Sep 18).
They must create follow-through buying above the 20-day EMA to increase the odds of a retest and a breakout above the August high.
The bears view the move (Sep 17) as forming a larger double top bear flag (Sept 9 and Sept 17).
They need to create strong follow-through selling, trading below the 20-day EMA and the bull trend line to increase the odds of a sustained move.
Production for Sept should be flat or down.
Refineries' appetite to buy remains decent.
Export: Sept: First 15 days +2.55% per ITS.
So far, the market has been trading sideways with poor follow-through and frequent reversals. This is a hallmark of a trading range.
For tomorrow (Monday, Sept 22), traders will see if the bears can create follow-through selling below the 20-day EMA.
Or will the move lack follow-through selling (again), reversing above the 20-day EMA later in the week?
Andrew

FCPO Weekly Roundup: Week Ending Sep 19, 2025📊 The Technical Take
The charts show a classic standoff between long-term strength and short-term indecision!
📈 Long-Term Bullish: The big picture (weekly chart) shows a powerful **"Cup and Handle"** pattern forming. This is a very strong bullish sign for the months ahead! ☕️
🧘 Short-Term Pause: The daily chart shows the price is coiling tightly in a "Symmetrical Triangle"
🔺 The market is taking a breather and building energy for its next big move.
🌍 The Fundamental Story
It's a classic tug-of-war between strong demand and rising supply.
🟢 THE BULLS (Demand):
🟢 India's Unstoppable Demand: India 🇮🇳 is currently the powerhouse driver of the market. Imports surged by over 15% in August to a 13-month high! This is fueled by massive restocking for their festive season and palm oil's significant price advantage over competing oils. This strong demand is expected to continue, absorbing any new supply.
💰 Good Price : Palm oil's price advantage over soyoil is keeping buyers interested.
💧 The Biodiesel Boost : Don't forget the structural demand! Government mandates in both Indonesia and Malaysia for higher biofuel blending (B40) are permanently removing millions of tons of palm oil from the food market, creating a tighter long-term supply balance that is very supportive of higher prices.
🌏 Strong Global Exports : Beyond India, overall export numbers from Malaysia have been improving, showing that global demand remains robust and is successfully absorbing the seasonal increase in production.
🔴 THE BEARS (Supply) :
- 🌿 Harvest Pressure : It's peak production season in Malaysia & Indonesia, meaning more supply is hitting the market.
- 📦 Stocks are Up : Inventories in Malaysia are at a 2-year high.
👀 Outlook for the Week Ahead
The market is perfectly balanced and waiting for a catalyst. The key is to watch the symmetrical triangle on the daily chart!
🎯 Bullish Scenario : A breakout **ABOVE** the triangle signals that strong demand is winning. This could kick off the next leg up!
⚠️ Bearish Scenario : A breakdown **BELOW** the triangle would mean that supply pressure is taking over, and we could see a deeper price correction.
In short: The market is coiled like a spring. Watch for the breakout to see which way it pops! 🚀
19/9/25 Can Bears Get FT Selling or Fail Again?
Thursday’s candlestick (Sept 18) was a consecutive bear bar closing in its lower half with a long tail below.
In our last report, we stated that traders would observe whether the bears could create sustained follow-through selling below the 20-day EMA or if the market would trade slightly lower but then reverse back above the 20-day EMA.
The market traded lower to test the August 29 low, but closed off its low.
The bulls want the 20-day EMA and the bull trend line to act as support. They want the current move to form a bear trap.
They want the pullback to be weak and sideways, lacking follow-through selling, as has been the case with all recent pullbacks (Jul 1 and Aug 4).
They want it to form a wedge bull flag (Aug 29, Sep 10, and Sep 18).
They must create follow-through buying above the 20-day EMA to increase the odds of a retest and a breakout above the August high.
The bears view the move (Sep 17) as forming a larger double top bear flag (Sept 9 and Sept 17).
They need to create strong follow-through selling, trading below the 20-day EMA and the bull trend line to increase the odds of a sustained move.
Production for Sept should be flat or down.
Refineries' appetite to buy remains decent.
Export: Sept: First 15 days +2.55% per ITS.
So far, the market has been trading sideways with poor follow-through and frequent reversals. This is a hallmark of a trading range.
For tomorrow (Friday, Sept 19), traders will see if the bears can create a strong bear bar closing near its low. If they can, the weekly candlestick will close near its low, increasing the odds of next week trading at least a little lower.
Or will the market trade sideways to up instead? If the market closes higher, the weekly candlestick will close with a long tail below or above the middle of its range, reducing the recent bearishness.
Andrew

FCPO: Technical & Market Outlook - 18-09-2025 (Morning Session)🌴 FCPO: Technical & Market Outlook 📈
FCPO is consolidating after an early dip, with price holding above key intraday support. While weaker rival oils are creating headwinds, a firm demand base and steady exports provide a floor.
📊 Technical View (from charts)
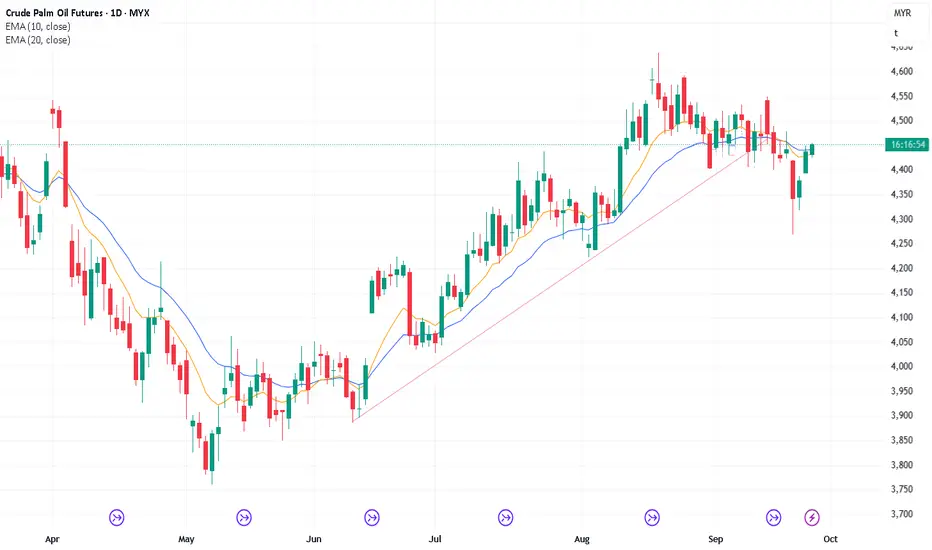
Daily: The strong up-channel since May remains intact, with the price testing the lower trendline. RSI is neutral (~51), leaving room for a move in either direction.
Hourly: Choppy trade is underway, but a solid demand shelf has formed. The 200-hour average (~4,432) is the immediate pivot.
🟢 Support: 4,401–4,381 (intraday demand zone), 4,378 (major Fib level), and 4,347 (volume shelf).
🔴 Resistance: 4,447 (key pivot), then 4,490, and 4,525. A breakout could target 4,568.
📰 Market Talk & Fundamentals
📉 Early Pressure: Softer CBOT soyoil and weaker Dalian palm olein weighed on sentiment in early trade.
💪 Underlying Support: Prices are likely supported by reduced output expectations. A firm ringgit is also encouraging exporters to hold their selling prices steady.
🇮🇳 Strong Demand: India's robust August palm imports (a 1-year high) confirm strong festive demand, underpinning export sentiment.
🧭 Combined Outlook & Triggers
🟢 Bullish: A hold above 4,401 and a reclaim of 4,447 is needed to confirm bullish momentum, targeting 4,490 and then 4,525.
🟡 Range/Neutral: Expect choppy trade between 4,401 and 4,490 as the market balances weak rival oils against strong physical demand.
🔴 Bear Risk: A decisive break and close below 4,378 would signal a deeper correction, opening the door for a test of 4,347.

19/8/25 No FT Buying, Bears Need FT Selling
Monday’s candlestick (Sept 17) was a big bear bar closing in its lower half with a prominent tail below.
In our last report, we stated that traders would observe whether the bulls could create sustained follow-through buying above the 20-day EMA, or if the market would gap up but lack follow-through buying, thereby reversing below the 20-day EMA again.
The market gapped significantly higher, but lacked follow-through buying, reversing to test the 20-day EMA.
The bulls want the 20-day EMA and the bull trend line to act as support.
They want the pullback to be weak and sideways, lacking follow-through selling, as has been the case with all recent pullbacks (Jul 1 and Aug 4).
They want it to form a higher low (Aug 29) followed by a reversal from a double bottom bull flag (Aug 29 and Sep 10).
They must create follow-through buying above the 20-day EMA to increase the odds of a retest and a breakout above the August high.
The bears view the move (Sep 17) as forming a larger double top bear flag (Sept 9 and Sept 17).
They need to create strong follow-through selling, trading below the 20-day EMA and the bull trend line to increase the odds of a sustained move.
Production for Sept should be flat or down.
Refineries' appetite to buy remains decent.
Export: Sept: First 15 days +2.55% per ITS.
So far, the market has been trading sideways with poor follow-through and frequent reversals. This is a hallmark of a trading range.
For tomorrow (Thursday, Sept 18), traders will see if the bears can create sustained follow-through selling below the 20-day EMA.
Or will the market trade slightly lower, but reverse back above the 20-day EMA again?
Andrew

17/9/25 Market to Gap Up, Bulls Need Strong FT Buying
Friday’s candlestick (Sept 12) was a doji bar closing around the middle of its range.
In our last report, we stated that traders would see if the bulls could create a follow-through bull bar above the 20-day EMA, or if the move would lack follow-through buying, resulting in a reversal below the 20-day EMA again.
The market initially traded higher but lacked follow-through buying, subsequently trading lower. The market bounced off its low to close above the 20-day EMA.
The bulls want the 20-day EMA and the bull trend line to act as support. So far, this is the case.
They want the pullback to be weak and sideways, lacking follow-through selling, as has been the case with all recent pullbacks (Jul 1 and Aug 4).
They want it to form a higher low (Aug 29) followed by a reversal from a double bottom bull flag (Aug 29 and Sep 10).
They hope the Sept 10 bear bar will form a bear trap and want the market to reverse above the 20-day EMA. If the bulls can create strong follow-through buying next week, the odds of this will increase.
They must create follow-through buying above the 20-day EMA to increase the odds of a retest and a breakout above the August high.
The bears view the recent move (Sep 9) as forming a small double top bear flag (Sept 3 and Sept 9).
They need to create strong follow-through selling, trading below the 20-day EMA and the bull trend line to increase the odds of a sustained move.
If the market trades higher, they want the Sept 9 high or 4500 round number area to be resistance, forming a wedge bear flag.
Production for Sept should be flat or down.
Refineries' appetite to buy remains decent.
Export: Sept: First 10 days -1% per ITS.
So far, the market has been trading sideways with poor follow-through and frequent reversals. This is a hallmark of a trading range.
The market would likely gap up tomorrow.
For tomorrow (Wednesday, Sept 17), traders will see if the bulls can create sustained follow-through buying above the 20-day EMA. If they can, the odds of a bear trap will increase.
Or will the market gap up but lack follow-through buying, reversing below the 20-day EMA again?
Andrew

Weekly Palm Oil Roundup | Fri, 12 Sep 2025
📅 Weekly Palm Oil Roundup | Fri, 12 Sep 2025
DCE cue: RBD Palm Olein closed +22 pts, a constructive lead that often nudges FCPO directionally via inter‑market links.
🕯️ Candles: FCPO1 printed dojis on both daily and weekly frames, reflecting participant indecision after recent gains.
↔️ Structure: Daily chart shows a lower high and a higher low, signaling short‑term sideways compression within the prior up‑channel.
🥣 Weekly base: Rounded‑bottom pattern remains intact, but momentum has cooled; a catalyst is needed for a decisive break.
📊 Fundamentals snapshot
🇲🇾 MPOB Aug: End‑stocks rose to ~2.20 Mt (+4.18% m/m), the sixth straight build, tempering immediate upside until exports accelerate.
Demand cushion: India’s Aug palm oil imports jumped ~16% to a 13‑month high ahead of festivals, aiding near‑term offtake.
🔄 Cross‑market: FCPO frequently tracks DCE olein and rival oils intraday; keep DCE’s tone front‑of‑mind for range breaks.
🧭 Key FCPO levels
Resistance: 4,445–4,460 first, then 4,513; sustained acceptance opens 4,568–4,614 toward recent swing highs.
Support: 4,435/4,339 initial, then 4,262; a close below 4,262 risks a deeper test toward ~4,129 if DCE softens.
✅ Trading bias (1–2 weeks)
Base case: Range‑to‑slightly positive—follow DCE; a firm DCE close plus FCPO hold above 4,445/4,460 improves odds of a push through 4,513.
Risk checks: Another inventory build or weak DCE can extend consolidation; watch cargo‑surveyor exports for signs stocks are being worked down.

12/9/25 No FT Selling, Bulls Need Strong FT Buying
Thursday’s candlestick (Sept 11) was an inside bull bar closing in its upper half with a long tail below and a prominent tail above.
In our last report, we stated that traders would see if the bears could create a follow-through bear bar, or if the market would stall, and retest near the 20-day EMA instead.
The market traded lower, but there was no follow-through selling, reversing to close above the 20-day EMA.
The bulls want the 20-day EMA and the bull trend line to act as support.
They want the pullback to be weak and sideways, lacking follow-through selling, as has been the case with all recent pullbacks (Jul 1 and Aug 4).
They want it to form a higher low (Aug 29) followed by a reversal from a double bottom bull flag (Aug 29 and Sep 10).
They hope Wednesday's candlestick will form a bear trap and want the market to reverse above the 20-day EMA. If the bulls can create strong follow-through buying on Friday, the odds of this will increase.
They must create follow-through buying above the 20-day EMA to increase the odds of a retest and a breakout above the August high.
The bears view the recent move as forming a small double top bear flag (Sept 3 and Sept 9).
They need to create strong follow-through selling, trading below the 20-day EMA and the bear trend line to increase the odds of a sustained move.
So far, the bears haven’t been able to create follow-through selling below the 20-day EMA again.
If the market trades higher, they want the Sept 9 high area to be resistance, forming a wedge bear flag.
Production for Sept should be flat or down.
Refineries' appetite to buy remains decent.
Export: Sept: First 10 days -1% per ITS
So far, the market has been trading sideways with poor follow-through and frequent reversals. This is a hallmark of a trading range.
So far, the bears haven't been able to create follow-through selling below the 20-day EMA.
The bulls want a strong bull bar tomorrow so that the weekly candlestick will close near its high. If this is the case, it will increase the odds of next week trading at least a little higher.
The bears want tomorrow to close as a strong bear bar, so that the weekly candlestick will be bearish.
For tomorrow (Friday, Sept 11), traders will see if the bulls can create a follow-through bull bar above the 20-day EMA. If they can, the odds of a bear trap will increase.
Or will the move lack follow-through buying, resulting in a reversal below the 20-day EMA again?
Andrew

11/9/25 Can Bears Create FT Selling, or Bear Trap?
Wednesday’s candlestick (Sept 10) was a big bear bar closing in its lower half with a prominent tail below.
In our last report, we stated that traders would observe whether the bears could create strong follow-through selling, closing below the 20-day EMA, or if the market would trade slightly lower but stall, reversing to close above the 20-day EMA instead.
The market formed a retest of the Aug 29 low, closing as a bear bar below the 20-day EMA and a higher low so far.
The bulls want the 20-day EMA and the bull trend line to act as support.
They want the pullback to be weak and sideways, lacking follow-through selling, as has been the case with all recent pullbacks (Jul 1 and Aug 4).
They want it to form a higher low (Aug 29) followed by a reversal from a double bottom bull flag (Aug 29 and Sep 10).
They hope Wednesday's candlestick will form a bear trap and want the market to reverse above the 20-day EMA.
If the market trades lower, they want the Aug 29 low to act as support.
They must create follow-through buying above the 20-day EMA to increase the odds of a retest and a breakout above the August high.
The bears view the recent move as forming a small double top bear flag (Sept 3 and Sept 9).
They need to create strong follow-through selling, trading below the 20-day EMA and the bear trend line to increase the odds of a sustained move.
The next target for the bears is the Aug 29 low.
Production for Sept should be flat or down.
Refineries' appetite to buy remains decent.
Export: Sept: First 10 days -1% per ITS
So far, the market has been trading sideways with poor follow-through and frequent reversals. This is a hallmark of a trading range.
Traders want to see if the bears can create follow-through selling below the 20-day EMA.
Or will the market lack follow-through selling yet again, as it has in previous times, forming a bear trap?
For tomorrow (Thursday, Sept 11), traders will see if the bears can create a follow-through bear bar, closing below the 20-day EMA.
Or will the market stall, and retest near the 20-day EMA instead?
Andrew

Bearish Pressure Still ActiveFCPO remains under selling pressure after a strong breakdown. The current rebound looks temporary and may present an opportunity for continuation to the downside.
🎯 Opportunity zone: 4,439 – 4,466
→ Watch for rejection in this area as a potential continuation setup.
🎯 Downside targets: 4,400 → 4,326
🛑 Invalidation: If price breaks and sustains above 4,470.
Technical structure suggests the bias remains bearish as long as key resistance is not broken.
📌 This study is for educational and risk management purposes only.
Not a Buy Call, only for you to know how regarding Money Management, and how Setup is Work. Risk of Loss is there, Potential for Profit also there.

10/9/25 No Strong FT Buying Still, Can Bears Create FT Selling?
Tuesday’s candlestick (Sept 9) was a bear doji closing below the middle of its range.
In our last report, we stated that traders would assess whether the bulls could create strong follow-through buying over the next few days, or if the market would trade slightly higher but stall, forming long tails above candlesticks or bear bodies.
The market traded higher but lacked follow-through buying, turning lower in the second half of the afternoon.
The bulls want the 20-day EMA and the bull trend line to act as support.
They want the pullback to be weak and sideways, lacking follow-through selling, as has been the case with all recent pullbacks (Jul 1 and Aug 4).
They want it to form a higher low (Aug 29) followed by a reversal from a small double bottom bull flag (Sep 4 and Sep 10).
If the market trades lower, they want the Sept 4 or Aug 29 low to act as support.
They must create follow-through buying above the 20-day EMA to increase the odds of a retest and a breakout above the August high.
The bears view the current move as forming a small double top bear flag (Sept 3 and Sept 10).
They need to create strong follow-through selling, trading below the 20-day EMA and the bear trend line to increase the odds of a sustained move.
The next targets for the bears are the Sept 4 or Aug 29 low.
Production for Sept should be flat or down.
Refineries' appetite to buy remains decent.
Export: Sept: Seems like first 10 days +11% per ITS (Estimate)
So far, the market has been trading sideways with poor follow-through and frequent reversals. This is a hallmark of a trading range.
The 20-day EMA and bull trendline are currently acting as support.
For tomorrow (Wednesday, Sept 10), traders will see if the bears can create strong follow-through selling, closing below the 20-day EMA.
Or will the market trade slightly lower, but stall, reversing to close above the 20-day EMA instead?
Andrew
