FCPO Masih Bearish ...4080-4100 is support zone. now the support zone is breakout.
today price retest the SBR zone and go down.
maybe price can go up again to retest CBR lebel or RBS.
Related commodities

28/11/25 Bulls Want Strong Weekly Bar, Bears Want Tail Above
Thursday’s candlestick (Nov 27) was a follow-through bull bar closing near its high.
In our previous report, we stated that traders would watch to see if the bulls could create a consecutive bull bar closing near its high, or if the market would trade slightly higher, but the candlestick would

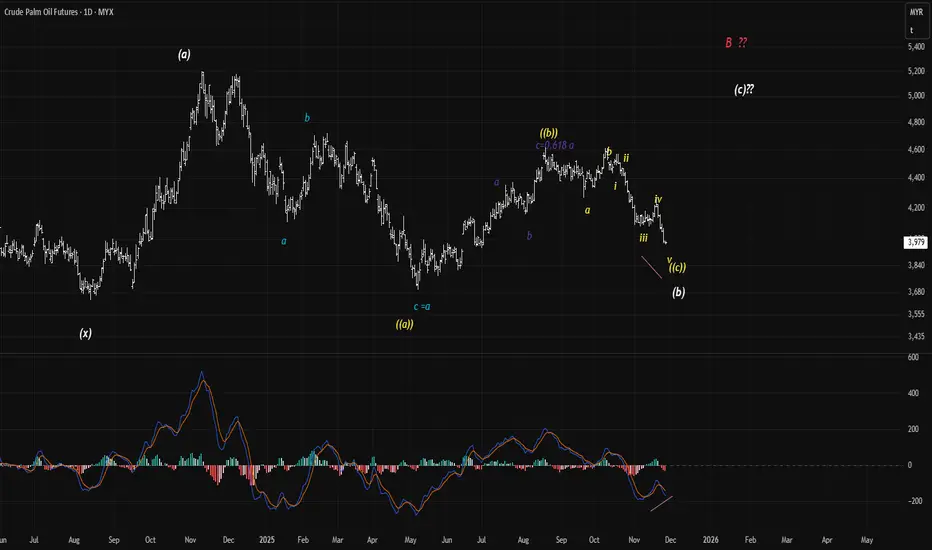
Change in count for FCPOWith the overlap in wave i at 3998, the previous count is negated and thus present an alternate count for wave (b) preceding an expected 5 wave formation of wave (c)to the upside for a major wave B (in red).
Sentiment remains weak but the presence of a divergence between price and MACD is indicative
27/11/25 Can Bulls Create a Strong Pullback?
Wednesday’s candlestick (Nov 26) was a bull bar closing in its upper half with a prominent tail above.
In our previous report, we stated that traders would watch to see if the bears could create more follow-through selling and extend the second leg sideways to down, or if the market would stall

26/11/25 Bears Want FT Selling, Bulls Want Pullback
Tuesday’s candlestick (Nov 25) was another follow-through small bear bar closing near its low with a small tail below.
In our previous report, we stated that traders would watch to see if the bears could create more follow-through selling and extend the second leg sideways to down, or if the ma

5/12/25 Can Bears Get FT Selling or Retest Above 20-Day EMA?
Thursday’s candlestick (Dec. 4) was a bear bar closing in its lower half with a small tail below.
In our previous report, we stated that traders would watch if the bears could create follow-through selling and close far below the 20-day EMA, or if the market would trade slightly lower but close

4/12/25 Can Bears Create Strong Retest of Nov 26 Low?
Wednesday’s candlestick (Dec. 3) was a bear doji closing near its low with a long tail above.
In our previous report, we stated that traders would watch if the bulls could create follow-through buying, or if the market would trade slightly higher but close with a long tail above, closing below

3/12/25 Can Bulls Create FT Buying Above the 20-Day EMA?
Tuesday’s candlestick (Dec. 2) was an outside bull bar closing near its high with a long tail below.
In our previous report, we stated that traders would see whether the bulls could create a retest and close above the 20-day EMA, or if the bears create a strong retest of the November low instea

FCPO Fibo 2.618now price at RM4,157.
Now price at resistant maybe price can break or pullback to level fibo 1.168 at TF H2.
if price break resistant maybe the price find another resistant.

2/12/25 Can Bulls Create A Strong PB, or Retest Nov Low?
Monday’s candlestick (Dec 1) was a bear bar closing near its low with a long tail above.
In our previous report, we stated that bulls wanted the candlestick to close near its high, so the weekly candlestick would close as a strong bull bar. This was the case.
The market traded slightly higher
See all ideas
Summarizing what the indicators are suggesting.
Neutral
SellBuy
Strong sellStrong buy
Strong sellSellNeutralBuyStrong buy
Neutral
SellBuy
Strong sellStrong buy
Strong sellSellNeutralBuyStrong buy
Neutral
SellBuy
Strong sellStrong buy
Strong sellSellNeutralBuyStrong buy
A representation of what an asset is worth today and what the market thinks it will be worth in the future.
Displays a symbol's price movements over previous years to identify recurring trends.
Frequently Asked Questions
The current price of USD Malaysian Crude Palm Oil Calendar Futures (Oct 2027) is 998.50 USD — it has risen 1.45% in the past 24 hours. Watch USD Malaysian Crude Palm Oil Calendar Futures (Oct 2027) price in more detail on the chart.
Track more important stats on the USD Malaysian Crude Palm Oil Calendar Futures (Oct 2027) chart.
The nearest expiration date for USD Malaysian Crude Palm Oil Calendar Futures (Oct 2027) is Oct 29, 2027.
Traders prefer to sell futures contracts when they've already made money on the investment, but still have plenty of time left before the expiration date. Thus, many consider it a good option to sell USD Malaysian Crude Palm Oil Calendar Futures (Oct 2027) before Oct 29, 2027.
Buying or selling futures contracts depends on many factors: season, underlying commodity, your own trading strategy. So mostly it's up to you, but if you look for some certain calculations to take into account, you can study technical analysis for USD Malaysian Crude Palm Oil Calendar Futures (Oct 2027). Today its technical rating is buy, but remember that market conditions change all the time, so it's always crucial to do your own research. See more of USD Malaysian Crude Palm Oil Calendar Futures (Oct 2027) technicals for a more comprehensive analysis.