NQX1! trade ideas

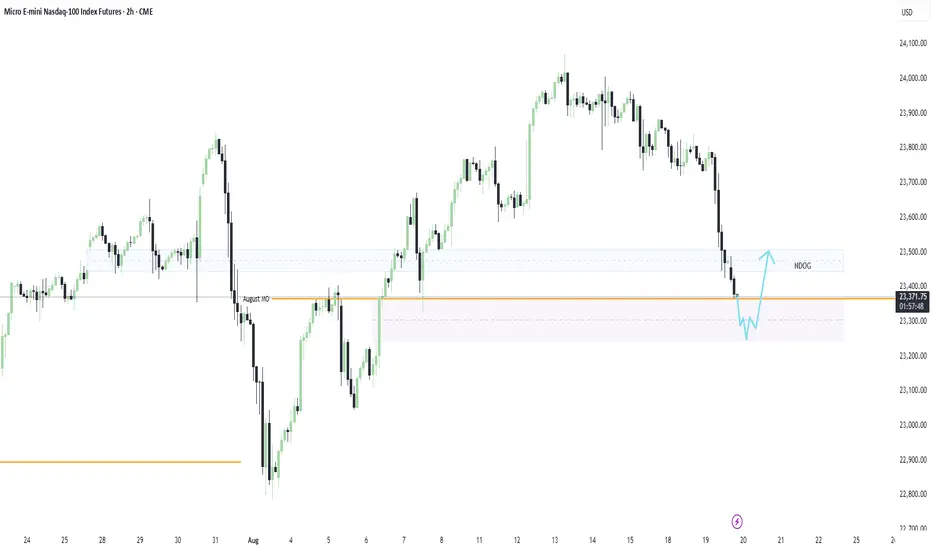
Gap Fill & Reversal Long IdeaI am anticipating a strong move through the August Monthly Open, with price sweeping the lows and targeting the 4H gap at 23,303.50. Once that level is tagged, I’ll be watching for signs of a reversal, ideally an inverse head and shoulders formation to shift bias back to the upside.
My target: a clean push toward the NDOG zone at 23,478.00
Nq ShortAfter taking a short position with the target I previously shared, I am now looking for a potential long opportunity — applying a scalping approach on Nasdaq.
⚠️ Disclaimer: This analysis reflects personal market observations and is for educational purposes only. It does not constitute financial advice.

NQ Long IdeaI am not a Indices guy this is my Idea for NQ/ES We have retraced to discounted levels and OTE levels with Premium Array

NQ short After yesterdays big move lower into the US open driven by under performing mega cap stock and possible profit taking ahead of Jackson Hole later this week, we've broken through the previous uptrends confirmed higher low and have left behind some nice levels to retrace back into.
Well confirmed hourly trendline
Low volume area and previous support turned resistance
Fibonacci retracement 50-61.8%
Lower timeframe entry/trigger (TBC)
This trade would need to be taken with caution and fairly strict in-trade management as price has entered a slightly higher TF fib retracement against the trade direction
Would only be looking to enter the trade if a clear entry point is provided and broken. This could be the break of a counter trendline or preferably the breakout of a 5min higher low and a retest of a short term fib retracement

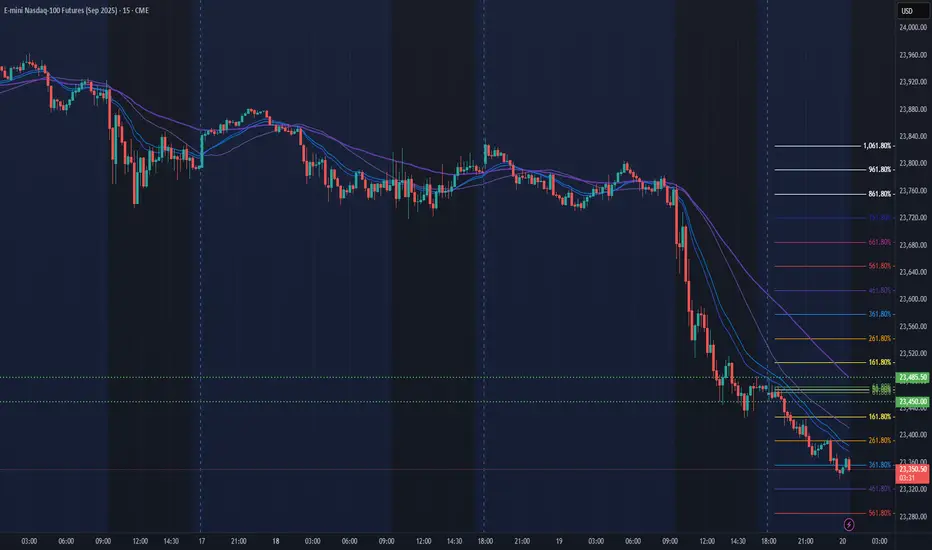
NQ Power Range Report with FIB Ext - 8/20/2025 SessionCME_MINI:NQU2025
- PR High: 23485.50
- PR Low: 23450.00
- NZ Spread: 79.5
Key scheduled economic events:
10:30 | Crude Oil Inventories
14:00 | FOMC Meeting Minutes
Session Open Stats (As of 12:35 AM 8/20)
- Session Open ATR: 282.07
- Volume: 38K
- Open Int: 287K
- Trend Grade: Long
- From BA ATH: -2.9% (Rounded)
Key Levels (Rounded - Think of these as ranges)
- Long: 24382
- Mid: 23239
- Short: 22096
Keep in mind this is not speculation or a prediction. Only a report of the Power Range with Fib extensions for target hunting. Do your DD! You determine your risk tolerance. You are fully capable of making your own decisions.
BA: Back Adjusted
BuZ/BeZ: Bull Zone / Bear Zone
NZ: Neutral Zone
19 August 2025Clean shorts presented several times today.
Same inversion FVGs.
For the first time I took 1h inversion short.
Need to focus on leaving the trades alone.

NQ 4H Bounce off the 200EMAI trade time based LQ primarily so the idea is pretty self explanatory. Hit me up if you want to talk about it

NQ: 237th trading session - recapNo scalp today either. I'm starting to worry again due to lack of trades. Some months I don't even trade at all, which is NOT GOOD.
I need to do something about that...
$MNQ - 08/19/2025H4 Close Below > Bearish
M15 -FVG > Bearish
M5 IFVG > Bearish
M1 FVG Entry > Bearish
Time > H4 10 AM Open

Future Analysis Nas & Dow 08/18/25Hey there ✌
Until now, I was mainly known among German-speaking traders, as I have been conducting my swing trades in Nasdaq futures (performance +110%, win rate 60%, average RR 2.83 in 42 trades) for about 7 months and my swing trades in Dow Jones futures (performance +103%, win rate 53%, average RR 6.58 in 19 trades) here at TV in an open, transparent manner and in advance.
For my analyses, I use a unique approach in which I embed price action and volume into a market mechanical structure to determine where institutional trading is most likely to have its average positions. I trade four different zones:
PDZ (Priority-Demand): Long-Level
PSZ (Priority-Supply): Short-Level
PDBZ (Priority-Demand-Break): Short-Level
PSBZ (Priority-Supply-Break): Long-Level
My approach only works when I have a crystal-clear market structure. I don't trade in ranges because I lack a clear market structure or market trend. True to the motto “It's better not to trade than to trade badly,” I only made 42 trades on the Nasdaq in seven months and 19 trades on the Dow in four months.
I also use the zones presented here as key levels for my intraday trading.
I love talking about the markets and exchanging ideas with other traders of all levels, and I know that there are many different approaches to successful trading. That's why I want to bring a little more positivity to the toxic trading industry, where everyone always thinks that only their own way works. So feel free to comment and ask me questions 🙌🙌
------------------------------------------------------------------
Performance Nasdaq (NQ/MNQ)
Total number of trades: 42
Starting Balance: $15'000.00
Net Gain/Loss: $16'531.74 (110.21%)
Balance: $31.531.74
Win: 59.52%
Average winning trade: $870.76
Average losing trade: -$308.07
------------------------------------------------------------------
Performance Dow Jones (YM/MYM)
Total number of trades: 19
Starting Balance: $5'000.00
Net Gain/Loss: $5'180.42103.61%)
Balance: $10'180.42
Win: 52.63%
Average winning trade: $600..13
Average losing trade: -$91.21
-------------------------------------------------------------------
You can find detailed journals of all trades from the two portfolios shown here, including links to the respective trade recommendations/analyses, in the link in my bio.

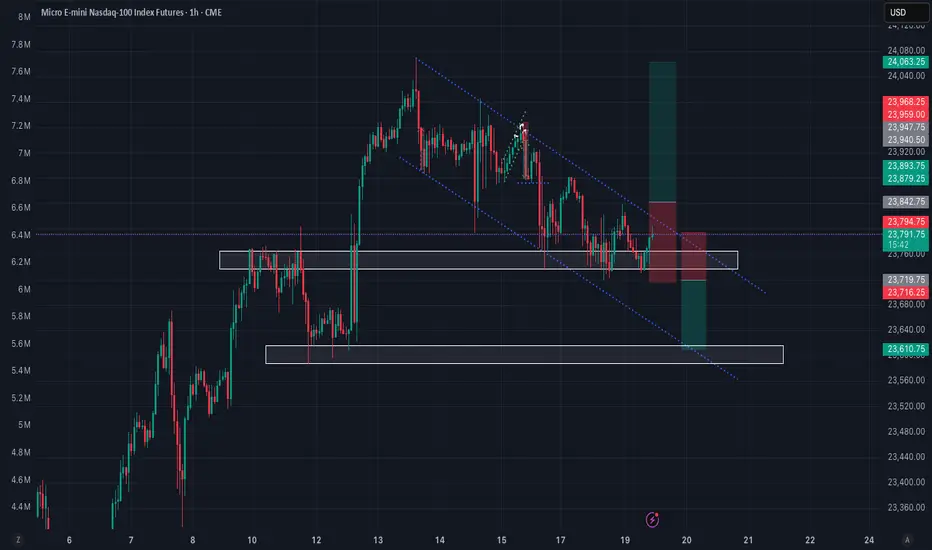
Nq & Es Key Levels 19-08-2025Good Morning everyone.
Looking at the charts today, we notice that the situation has not changed much compared to yesterday—we are still trading around the same levels. This means that directional bias remains unclear, making it important to see how the market opens at 09:30 in order to reassess.
We are currently in a zone where price could either rise sharply before falling, or drop first and then recover. Therefore, after the market opens:
If price moves down, I will look for long opportunities.
If price moves up into the key levels I have marked on the chart, I will look for short setups.
Things may become clearer after 10:00, where higher-probability setups could form.
At the moment, we are trading within a premium zone, which naturally favors short positions. However, caution is required as market conditions can shift quickly during the session.
On the chart, I’ve highlighted the sensitive key levels I’m watching.
I wish you all good and disciplined trading.

Breakout on NQNasdaq seem to be ready to break in either direction.
With the hourly counter trend failing to reach the lower end of the channel indicating a possible lack in bearish momentum.
Or a solid support level put in place with price creating lower highs (Descending triangle) to break lower.
FED talks towards the end of the week will likely be the deciding factor on which direction and the trigger to enter in either direction.
There are two main events this week for the FED: FOMC minutes on Wednesday and the Jackson Hole symposium from Thursday to Saturday with Jerome Powell speaking on Friday afternoon.
We'll be looking for Hawkish commentary to support higher rates for longer amid slightly elevated inflation and continued uncertainty around tariff implications. US equities down
Or further confirmation that the FED in ready to commit to a more dovish monetary policy stance. The recent FED meeting saw two committee members voting for a rate cut, against the majority and market are starting to pice in 3 cuts by year end amid a weaker labour market. US equities up
NQ Power Range Report with FIB Ext - 8/19/2025 SessionCME_MINI:NQU2025
- PR High: 23838.00
- PR Low: 23792.25
- NZ Spread: 102.25
No key scheduled economic events
Session Open Stats (As of 12:45 AM 8/19)
- Session Open ATR: 269.98
- Volume: 22K
- Open Int: 293K
- Trend Grade: Long
- From BA ATH: -1.3% (Rounded)
Key Levels (Rounded - Think of these as ranges)
- Long: 24382
- Mid: 23239
- Short: 22096
Keep in mind this is not speculation or a prediction. Only a report of the Power Range with Fib extensions for target hunting. Do your DD! You determine your risk tolerance. You are fully capable of making your own decisions.
BA: Back Adjusted
BuZ/BeZ: Bull Zone / Bear Zone
NZ: Neutral Zone
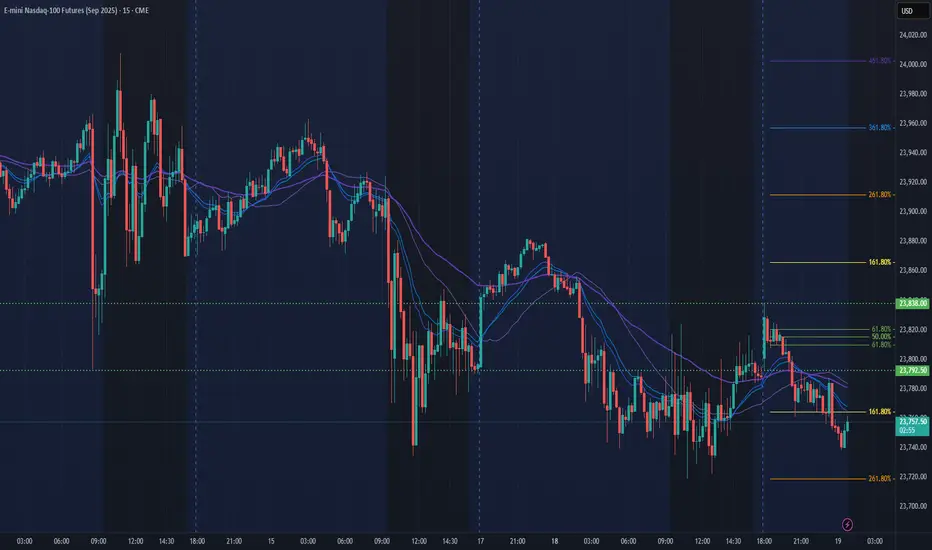
NQ Futures Daily Plan – August 19, 2025NQ Futures Daily Plan – August 19, 2025
NQ remains in a 3-day balance structure ahead of tomorrow’s housing data (8:30 ET) and this week’s Fed Symposium. Price continues to rotate inside balance, with 23,827 acting as the bull/bear pivot.
Key Levels:
• 🔼 23,980–24,000 → Breakout trigger
• 🔼 23,900–23,940 → Upside acceptance zone
• ⚖️ 23,827 → Line in the sand
• 🔽 23,760–23,770 → Weekly pivot support
• 🔽 23,742.50 → 3-day balance low
• 🔽 23,700 → Downside target if balance fails
Plan:
• Range trade between 23,770–23,940 = scalping zone.
• Break above 23,940 = target 24,000.
• Break below 23,742.50 = target 23,700.

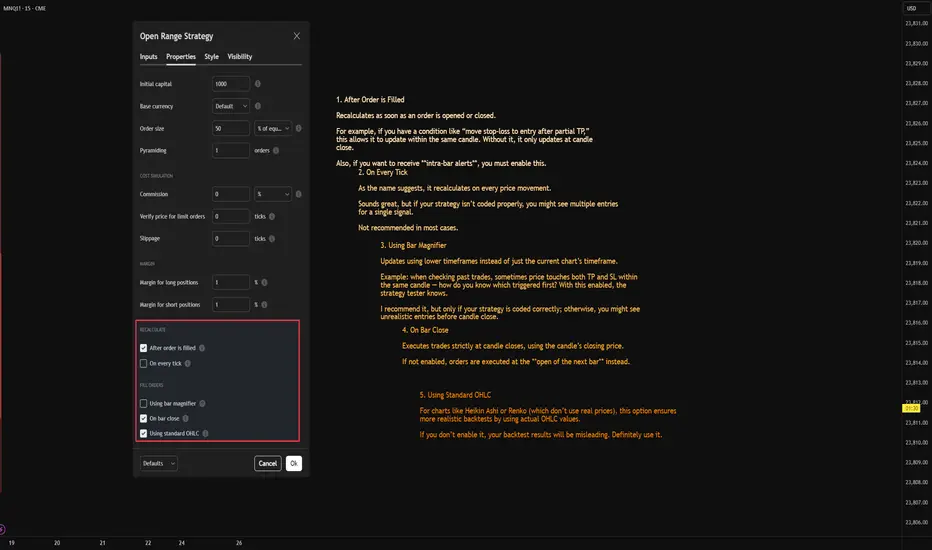
Do you really know what these Strategy Properties checkboxes do Hi everyone,
I'm a Pine script developer and i’ve noticed that many people don’t fully understand what the checkboxes in the **Strategy Properties** section of TradingView actually do. So I’d like to quickly explain them with practical examples:
1. After Order is Filled
Recalculates as soon as an order is opened or closed.
For example, if you have a condition like “move stop-loss to entry after partial TP,” this allows it to update within the same candle. Without it, it only updates at candle close.
Also, if you want to receive **intra-bar alerts**, you must enable this.
2. On Every Tick
As the name suggests, it recalculates on every price movement.
Sounds great, but if your strategy isn’t coded properly, you might see multiple entries for a single signal.
Not recommended in most cases.
3. Using Bar Magnifier
Updates using lower timeframes instead of just the current chart’s timeframe.
Example: when checking past trades, sometimes price touches both TP and SL within the same candle — how do you know which triggered first? With this enabled, the strategy tester knows.
I recommend it, but only if your strategy is coded correctly; otherwise, you might see unrealistic entries before candle close.
4. On Bar Close
Executes trades strictly at candle closes, using the candle’s closing price.
If not enabled, orders are executed at the **open of the next bar** instead.
5. Using Standard OHLC
For charts like Heikin Ashi or Renko (which don’t use real prices), this option ensures more realistic backtests by using actual OHLC values.
If you don’t enable it, your backtest results will be misleading. Definitely use it.
My suggestion:
- Always keep After Order is Filled and Using Standard OHLC enabled.
- If your past trades look clean (no strange early entries), also use Bar Magnifier for more accurate results.
Thanks for reading, stay safe out there!
18 AUGUST 20253 Trades today. I was not looking to take any trades today because of no news and price is very choppy on a no news day. However, few very clean setups were present on LTF.
SMT
1h FVG
Inversion

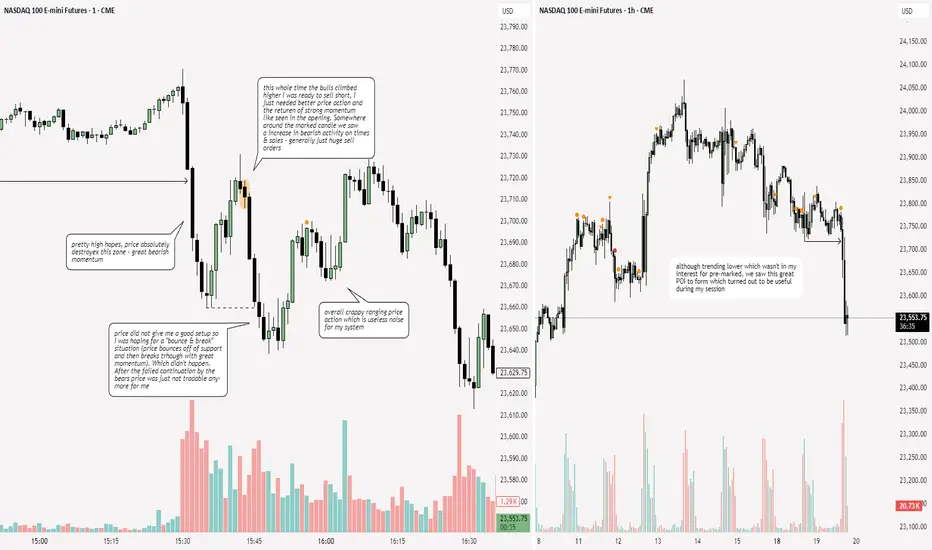
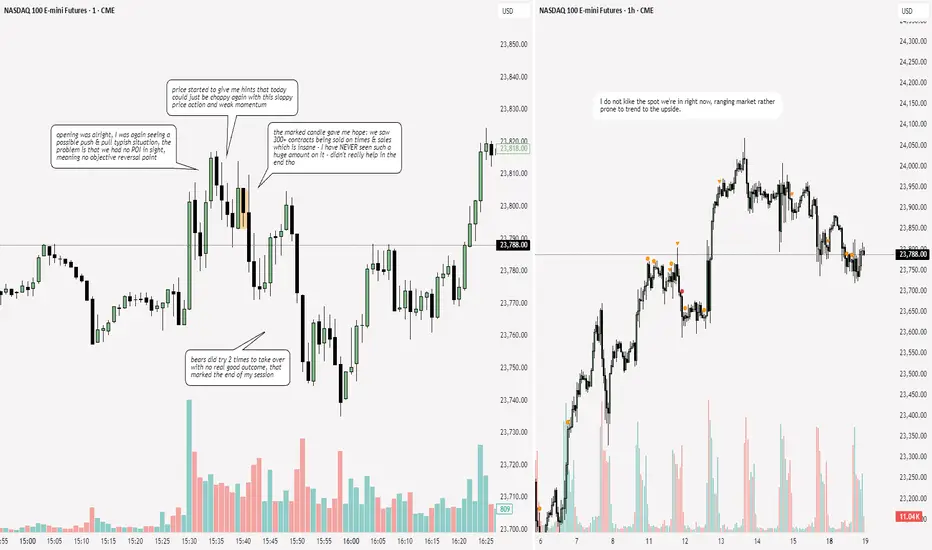
NQ: 236th trading session - recapGood session - usually mondays are boring ash, but twith the times & sales event it really made a difference. Too bad prica action was sloppy
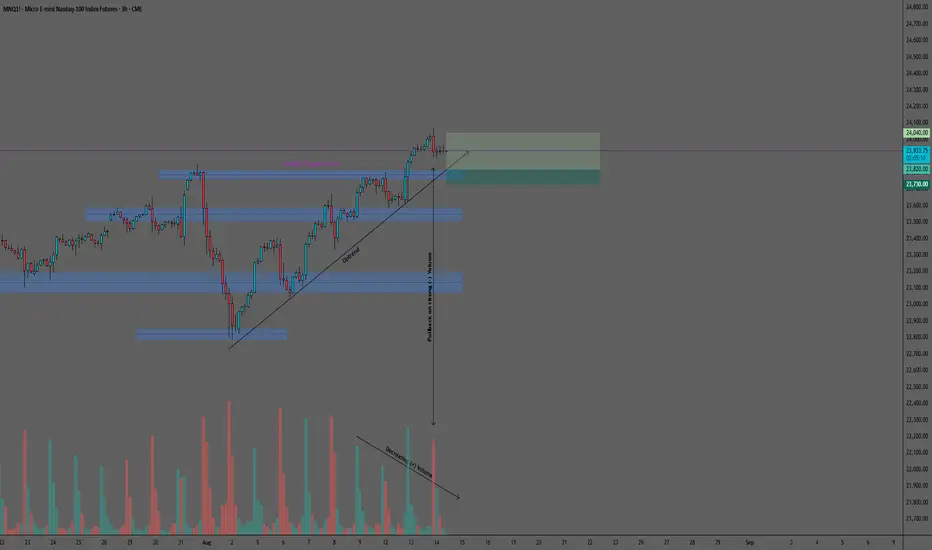
MNQ (Micro Nasdaq 100 Futures) Trade Setup – 3H TimeframeMNQ: Likely Retest of Nearest Support in Uptrend with Rebound Toward All-Time High
MNQ has been in a sustained uptrend since August 4, 2025, forming a clear sequence of higher highs and higher lows supported by constant positive volume inflow. On August 12, price broke above both the 23,800 resistance zone and the 23,848 all-time high following major news, with the breakout supported by strong buying volume.
The 3-hour chart shows that after the breakout, momentum has slowed and positive volume has gradually declined. A sharp spike in negative volume on August 13 suggests selling activity near the new high zone, increasing the likelihood of a pullback toward the 23,800 area—a strong liquidity level and former resistance now acting as support.
Illustrative Setup: A Buy Limit order at 23,820 positions the entry near the top of the 23,800 support zone, aiming to capture a rebound in line with the prevailing uptrend. A Stop Loss at 23,730 sits just below the support level, providing a clear invalidation point. The Take Profit target at 24,040 is set near the August 13 new all-time high (24,069), offering a favorable 2.44:1 reward-risk ratio.
Key considerations: The combination of an intact uptrend, a well-defined, strategic support zone, and the potential for a technical retest creates a bullish setup with multiple confirmations. However, given the proximity to all-time highs, traders should watch for volatility and / or potential consolidation before any new significant move takes place. Monitoring intraday volume dynamics can provide additional confirmation before entry.
This analysis is provided solely for educational and entertainment purposes and does not constitute any form of financial or investment advice. Always manage your risk and trade responsibly.
Nq & Es Analysis 18-08-2025Good evening everyone, I’m back to share some key levels and potential scenarios for NASDAQ and S&P.
We notice that price has recently made a small pullback after last week’s reaction at the all-time highs (ATHs). At the moment, there are multiple levels where price could react, and we are positioned in a very critical zone.
I have no directional bias for today. The best approach is to wait for confirmation of what the market is actually trying to show us, and observe how the opening session develops. This will help us better understand how to use the key levels I have highlighted on the chart.
⚖️ Remember:
In premium zones, we look for short setups.
In discount zones, we look for long setups.
For today, I am simply observing without giving any specific scenario. Trade carefully and I wish you all a successful session.

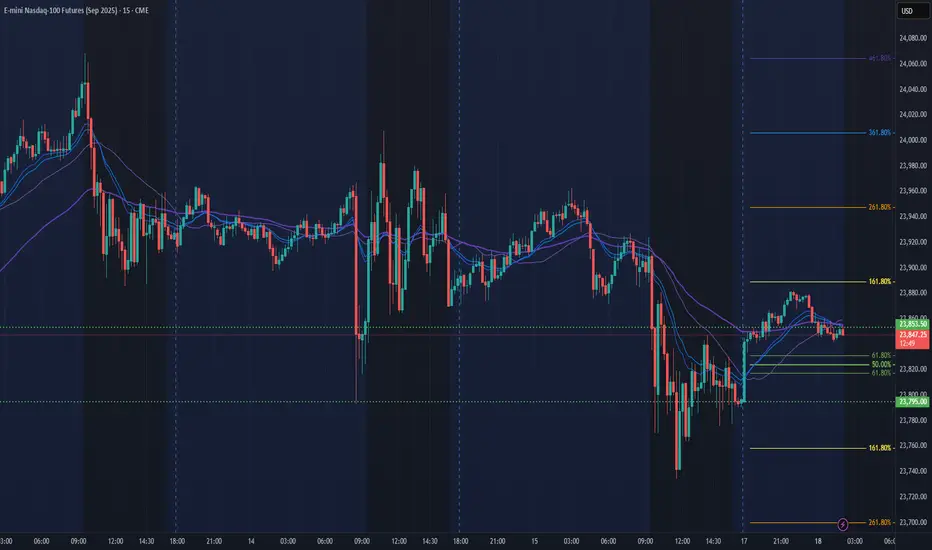
NQ Power Range Report with FIB Ext - 8/18/2025 SessionCME_MINI:NQU2025
- PR High: 23853.50
- PR Low: 23795.00
- NZ Spread: 131.0
No key scheduled economic events
Session Open Stats (As of 12:25 AM 8/18)
- Session Open ATR: 277.67
- Volume: 17K
- Open Int: 291K
- Trend Grade: Long
- From BA ATH: -0.9% (Rounded)
Key Levels (Rounded - Think of these as ranges)
- Long: 24382
- Mid: 23239
- Short: 22096
Keep in mind this is not speculation or a prediction. Only a report of the Power Range with Fib extensions for target hunting. Do your DD! You determine your risk tolerance. You are fully capable of making your own decisions.
BA: Back Adjusted
BuZ/BeZ: Bull Zone / Bear Zone
NZ: Neutral Zone
E-mini Nasdaq-100 Trading Setup for sellers ^)We have completed cup and handle pattern here...
So after the price is still high!
We may see some price gain additional, something like 13-18% .
So we have two option here for the sellers, wait and sell from marked point 1 or 2 .
P.S. This is very long time range position. ( Something like 200-800 day ).
Have a profit in your day!
Thanks.

Monday NQ Daily Plan | August 18, 2025NQ Daily Plan | August 18, 2025
Market Context & Key Levels for the Day Ahead
Market Context
On Friday, NQ continued to coil below 24,000, with an RTH profile that leaned b-shaped (long liquidation).
Overnight action set up balance around 23,750–23,950, echoing the broader multi-day consolidation following the CPI-driven breakout.
The 5D VPOC has shifted higher into the 23,875 area, which confirms short-term strength in the context of last week’s breakout. Value is moving higher with price — bullish unless acceptance back inside old balance occurs.
The current 3-day balance range runs from 23,750 up to 23,975–24,000 (balance high).
Balance Guidelines (Applied to NQ)
In balance, fade extremes (short near highs, long near lows) unless strong acceptance develops.
Breakouts:
Sustained trade above 24,000 = follow buyers higher into discovery.
Sustained trade below 23,750 = follow sellers lower toward downside magnets.
Failed Breakouts:
If price pokes outside balance but returns inside, bias shifts to target the opposite end of balance.
Key NQ Levels for Monday
Level Context / Bias
24,050 (FUT) Final Upside Target if breakout holds
23,975–24,000 (UT2) Balance High / Breakout Trigger
23,925–23,950 (UT1) First upside resistance / acceptance zone
23,800–23,825 Pivot Support (line in the sand)
23,750 Lower edge of 3-day balance
23,700–23,675 (DT1) Support if balance fails
23,550 (FDT) High Volume Node / Downside Magnet
🎯 Trade Scenarios
Bullish (Continuation of Breakout)
Hold above 23,800–23,825 → push into 23,925 → 23,975–24,000.
Acceptance above 24,000 opens 24,050+ (FUT).
Bearish (Failed Breakout / Breakdown)
Lose 23,800 / 23,750 → rotate down to 23,700–23,675.
Sustained selling opens test of 23,550 (FDT).
Neutral (Balance Rotation)
Between 23,750–23,950, expect chop → fade extremes until news or order flow confirms breakout.
Confirmation via VIX & Macro
Watch VIX 16.0 / 14.0 equivalents in NQ volatility measures.
A breakout above 24,000 with volatility compressing = stronger confirmation.
Breakdown below 23,750 with volatility expanding = confirmation of weakness.
Monday’s NAHB Housing Index (10 AM ET) and overnight China/Japan data may provide early catalysts.
Summary for Monday:
NQ sits inside a 3-day balance (23,750–23,975).
Above 24,000 → breakout continuation toward 24,050+.
Below 23,750 → sellers target 23,700 then 23,550.
Expect rotations within balance until housing data or broader macro headlines provide direction.
