Elliott Wave View: Nikkei Still Missing Wave 5Short Term Elliott Wave view on Nikkei Futures suggests the pullback to 20704 ended wave (2). The Index then resumed higher in wave (3) which ended at 21985. The internal of wave (3) subdivided as an impulse Elliott Wave structure. Up from 20704, wave 1 ended at 21415, wave 2 ended at 20985, wave 3 ended at 21765, wave 4 ended at 21490, and wave 5 of (3) ended at 21985. We can also see the internal of wave 1, 3, and 5 all subdivide as an impulse (5 waves) of lesser degree. This is an illustration of fractal within Elliott Wave where each wave consists of smaller waves and the pattern repeats indefinitely.
Wave (4) dips appears complete after a 3 waves pullback ended at 21588+ blue box area. The internal of wave (4) unfolded as a zigzag Elliott Wave structure where wave A ended at 21735, wave B ended at 21835, and wave C ended at 21565. At this stage, Nikkei still needs to break above wave (3) at 21985 to avoid a double correction in wave (4). While dips continue to stay above wave (2) low at 20704, expect Index to extend higher in wave (5). If bounce from the blue box fails to break above (3) high and it breaks the recent low, then structure of wave (4) should become a double three Elliott Wave structure and would be labelled as WXY. We would be able to define the next blue box area for a bounce if the bounce does fail and breaks the recent low.
Trade ideas

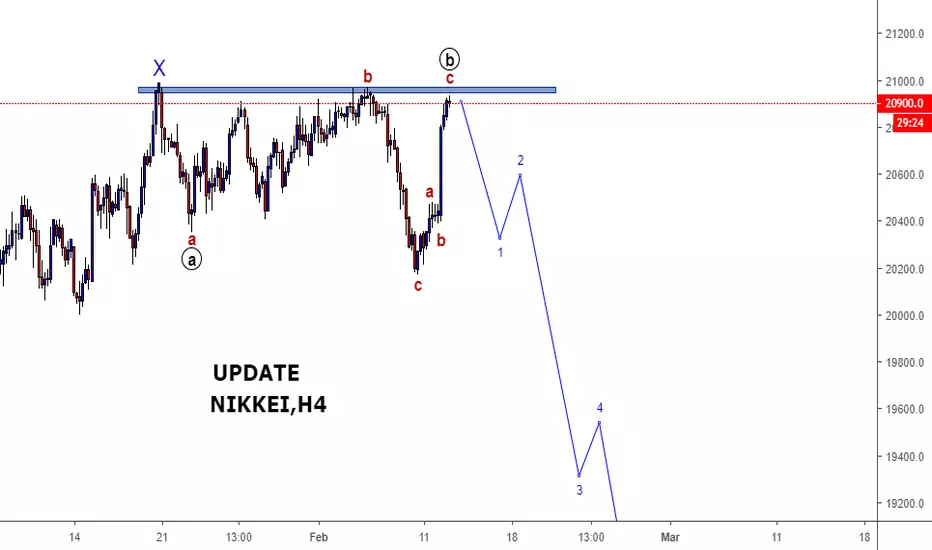
Elliott Wave View: Nikkei Rally Likely Fails for DownsideElliott Wave view is calling an end to Nikkei’s rally from December 26, 2018 low with wave X at 21884. The Index should resume the move lower and should eventually break below wave December 26, 2018 low. Or at minimum, the Index should do a larger 3 waves pullback to correct the cycle from 19055 low. Down from wave X at 21884, the decline is unfolding as a zigzag Elliott Wave structure where wave ((a)) ended at 20680. Internal of wave ((a)) subdivides as a 5 waves impulse.
Wave ((b)) bounce is currently in progress as a Flat Elliott Wave structure. Up from 20680, wave (a) ended at 21520 and wave (b) ended at 20705. Internal of wave (a) unfolded as a double three Elliott Wave structure. Up from 21520 low, wave w ended at 21410, wave x ended at 21015, and wave y of (a) ended at 21520. Internal of wave (b) ended as a zigzag at 20705. Wave a of (b) ended at 21160, wave b of (b) ended at 21505, and wave c of (b) ended at 20705. Wave (c) of ((b)) is in progress as a 5 waves impulse. The rally should fail below March 4 high at 21884 for further downside. We don’t like buying the Index and expect rally to fail for further downside as far as pivot at 21884 high stays intact.


Elliott Wave View: Further Rally in Nikkei FavoredShort-term Elliott wave view in Nikkei suggests that the Index has ended correction at 20169 as wave ((X)) and starts a new leg higher. Decline to 20169 on 8 February took the form of an Elliott Wave Expanded Flat. An Elliott Wave Flat structure has an ABC label with subdivision of 3-3-5. We can see from the 1 hour chart wave (B) of this FLAT ended at 20970 and wave (C) ended at 20169. Subdivision of wave (C) unfolded as a 5 waves Impulse Elliott Wave structure. Down from 20970, wave 1 ended at 20815, and wave 2 ended at 20895. Wave 3 ended at 20270, wave 4 ended at 20370, and wave 5 ended at 20169.
The Index has since rallied and broke above the previous high on February 5th, suggesting the next leg higher has started. Rally from Feb 9th low (20169) is unfolding as a 5 waves Impulse structure. Up from 20169, wave 1 ended at 20480 and wave 2 ended at 20390, wave 3 at 21198 and wave 4 at 21060 low. Expect ideally 1 more leg higher in the Index to end the 5 waves up. Afterwards, it should pullback to correct the cycle from Feb 9 low within wave (B) in 3, 7, or 11 swing. As far as pullback stays above 20390 low, expect the Index to extend higher. We don’t like selling the Index.

Risk on catching market off guard,high conviction Long Nikkei225Weekly Insidebar pushing higher towards 22500 level.
Risk on continues, JGB yields bottomed. Path higher is clear

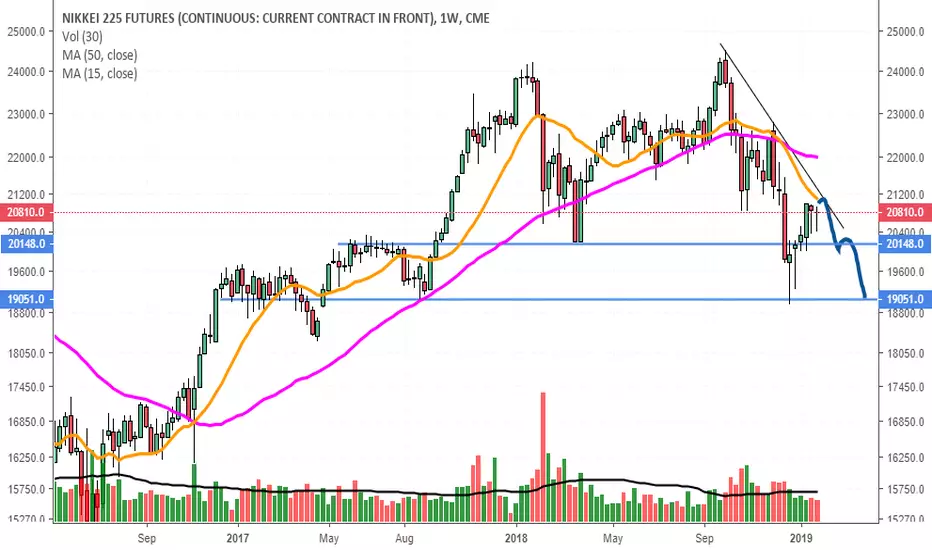
bear flag in the nikkeiHeaded for continued downtrend. Moving down in tandem with all global markets

NIKKEI 225 FUTURES (MAR 2019), 1D, CMETrading Signal
Short Position (EP) : 20815
Stop Loss (SL) : 20990
Take Profit (TP) : 20465
Description
NYH2019 formed Double Repo Sell at 1d time frame. Trade setup with Sell Limit at 0.382 Level (20815) and place stop after 0.618 level (20990). Once the position was hit, place take profit before an agreement (20465)
Money Management
Money in portfolio : $280,000
Risk Management (1%) : $2,800
Position Sizing
5 = +-$25
Commission fee = -$3.02/contract (Standard)
EP to SL = $175 = -$875/contract (STD)
Contract size to open = 3 standard contracts
EP to TP = $350 = +$1,750 (STD)
Expected Result
Commission Fee = -$18.12
Loss = -$2,625
Gain = +$5,250
Risk/Reward Ratio = 1.98

NIKKEI 225 FUTURES (MAR 2019), 1D, CMETrading Signal
Long Position (EP) : 19740
Stop Loss (SL) : 19445
Take Profit (TP) : 20455, 21290
Description
NYH2019 formed Double Repo Buy at 1d time frame. Trade setup with Buy Limit at 0.382 Level (19740) and place stop after 0.618 level (19445). Once the position was hit, place take profit before an agreement (20455) and 21290
Money Management
Money in portfolio : $280,000
Risk Management (1%) : $2,800
Position Sizing
5 = +-$25
Commission fee = -$3.02/contract (Standard)
EP to SL = $295 = -$1,475/contract (STD)
Contract size to open = 2 standard contracts
EP to TP#1 = $715 = +$3,575 (STD)
EP to TP#2 = $1550 = +$7,750 (STD)
Expected Result
Commission Fee = -$12.08
Loss = -$2,950
Gain#1 = +$3,575
Gain#2 = +$7,750
Total Gain = +$11,325
Risk/Reward Ratio = 3.82


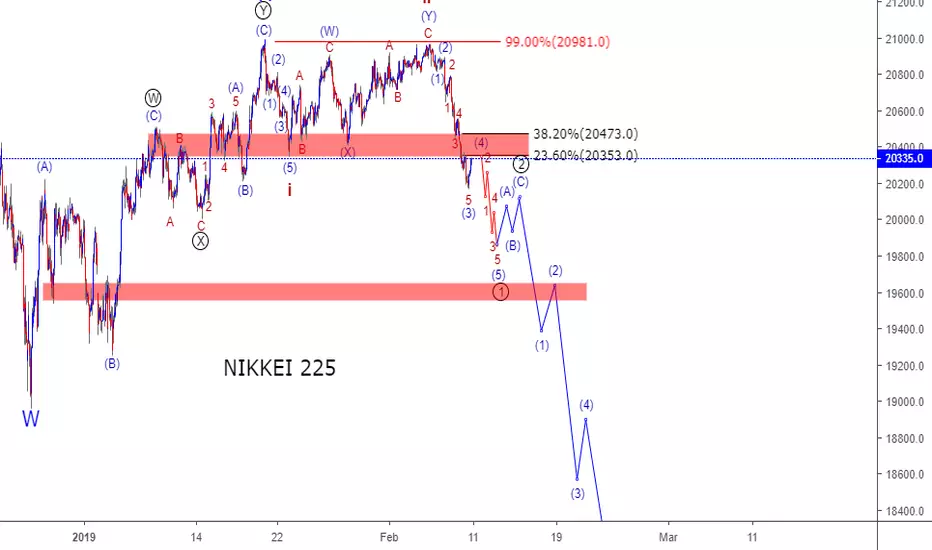
Can Aggressive Elliott Wave View In Nikkei Will Play Out?Nikkei short-term Elliott wave view suggests that the cycle from 10/01/2018 peak is showing 5 swings bearish sequence. This favor more downside to 19073-16773 100%-123.6% Fibonacci extension area to be reached in 7 swings before support for bigger 3 wave bounce is seen at least. The decline from 10/01 peak is showing overlapping price action thus suggests that decline is unfolding in a corrective sequence i.e could be unfolding as double three structure.
Currently, the decline to 21075 low blue wave (W) lower. Above from there, a bounce in blue wave (X) took place as a Flat correction where red wave A ended at 21735 high. Wave B ended at 20950 low and red wave C ended at 21923 high which also completed blue wave (X). Down from there, blue wave (Y) can be completed at 19278 low. Above from there the index is expected to do a bounce in 3, 7 or 11 swings within blue (X)(X) of a possible triple correction lower. We expect short-term sellers to appear in 3, 7 or 11 swings on a bounce in blue wave (X)(X).

Time GuesstimateWe are watching a bearish movement based on the drive of the time target. A probable uptrend after the second time target and then downtrend after the third time target.

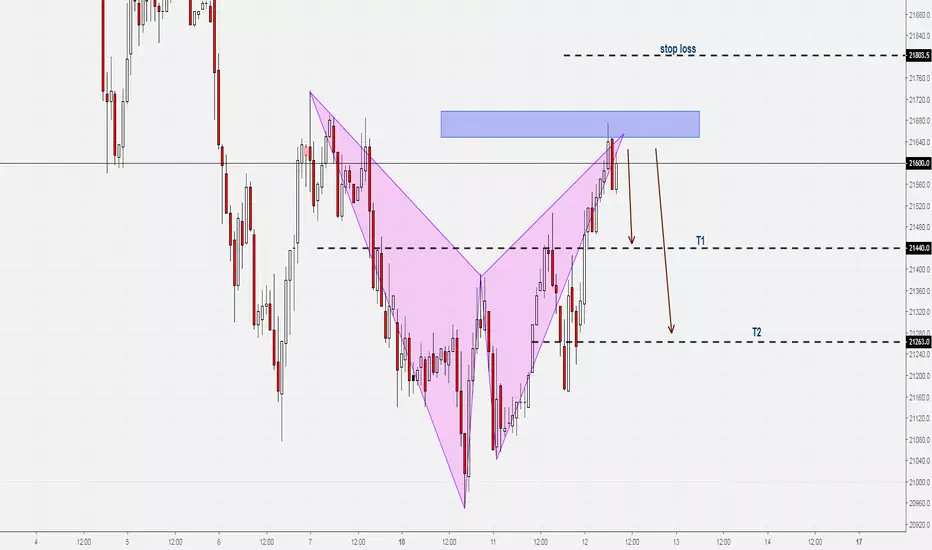
Nikkei Futures / H1 / Technical ChartNikkei Futures / H1 / Technical Chart
Bat Pattern was trigger at 21680 levels
good luck

Nikkei225 i H&S Perfect inverse hs in forming, if breaking 21660 successfully, it will hit 21900 and form a bigger I H&S which is targeting 22700


LionTrade Nikkei 225 December Futures Contract Nikkei 225 is currently trading at the 21860 level
Analysing the hourly chart, we can see a head and shoulders pattern has formed, with the neckline at the 22000 to 22250 level. When measuring the price from the head to the right shoulder, we can see a downward movement of 1543 points. When measuring this 1543 points downward movement from the shoulder downward, we see a drop from 21860 (current price) to 21591
Trading a USD account with LionTrade where the domestic currency is ZAR (Rand)
IMR:
1 lot * 1 contract * 0.005 IMR * 21860 current price = JPY 109.30
JPY 109.30 / USDJPY 113.13 = USD 0.97
USD 0.97 * USDZAR 14.68 = ZAR 14.18 required margin
Potential profit is:
* 1 contract = $ 13.6391 * 14.68 USDZAR
$ 13.6391 * 14.68 USDZAR = R200 profit
Potential Return:
* 100 = 1362%
www.liontrade.co.za
Learn to Trade

Nikkei225 shortFalling wedge formed
Divergence formed
Major resistance hit
USDJPY facing greatest resistance.
All information leads to short.
TP 21200
SL 21850


Nikkei - support area I am watching. Dollar (which is still in uptrend) should help a possible Nikkei rebound in highlighted area. Will look for setup in 4h to 30min chart. Remember:no setup no trade.
