Potential Bullish ContinuationPreference:
On the H4, with price bouncing off the ichimoku cloud and moving in an ascending trend channel, we have a bullish bias that price will continue to rise from the pivot at 26880 in line with the pullback support and 50% fibonacci retracement to the 1st resistance at 28410 in line with the multiple swing high and 100% fibonacci projection.
Alternative Scenario:
Alternatively, price may reverse off the pivot and drop to the 1st support at 26000 in line with the pullback support .
Any opinions, news, research, analyses, prices, other information, or links to third-party sites contained on this website are provided on an "as-is" basis, as general market commentary, and do not constitute investment advice. The market commentary has not been prepared in accordance with legal requirements designed to promote the independence of investment research, and it is therefore not subject to any prohibition on dealing ahead of dissemination. Although this commentary is not produced by an independent source, FXCM takes all sufficient steps to eliminate or prevent any conflicts of interest arising out of the production and dissemination of this communication. The employees of FXCM commit to acting in the clients' best interests and represent their views without misleading, deceiving, or otherwise impairing the clients' ability to make informed investment decisions. For more information about the FXCM's internal organizational and administrative arrangements for the prevention of conflicts, please refer to the Firms' Managing Conflicts Policy. Please ensure that you read and understand our Full Disclaimer and Liability provision concerning the foregoing Information, which can be accessed on the website.
Trade ideas

Elliott Wave View: Nikkei Zigzag Rally Approaching TargetShort term Elliott Wave view in Nikkei suggests the decline from 3/29/2022 peak is unfolding as a zigzag Elliott Wave structure. A Zigzag is a corrective structure labelled as ABC with 5-3-5 subdivision. Down from 3/29/2022 peak, wave A ended at 25555 and rally in wave B ended at 28401. Wave C lower is in progress as a 5 waves impulse. Down from wave B, wave (i) ended at 26195 and rally in wave (ii) ended at 26960. Index then resumes lower in wave (iii) towards 25615, wave (iv) ended at 26235 and final wave (v) ended at 25525. This completed wave ((i)) of C. Wave ((ii)) of C is now in progress to correct cycle from 6/9/2022 high before the decline resumes.
Internal subdivision of wave ((ii)) is unfolding as a zigzag structure in lesser degree. Up from wave ((i)), wave (a) ended at 26555 and dips in wave (b) ended at 26005. Wave (c) higher is in progress to complete wave ((ii)) before the decline resumes. Potential target for wave ((ii)) is 100% – 161.8% fibonacci extension of wave (a) which comes at 27040 – 27675 area. Index should then resume lower or pullback in 3 waves at least. Near term, as far as pivot at 28401 high remains intact, expect rally to fail in 3, 7, or 11 swing for further downside.

Nikkei225 +415points, What Next?In this update we review the recent price action in the Nikkei225 futures contract and update the trade strategy and price objectives to target

Potential Bullish BounceOn the H4, with price recently breaking the descending trendline and price ascending on the RSI, we have a bullish bias that price will rise from the buy entry at 26100 in line with the 38.2% fibonacci retracement to the 1st pullback resistance at 27130 in line with the 78.6% fibonacci projection and 61.8% fibonacci retracement. Alternatively, price may break the support at entry and drop to the 2nd support at 25550 in line with the 61.8% fibonacci projection amd horizontal multiple swing lows.
Any opinions, news, research, analyses, prices, other information, or links to third-party sites contained on this website are provided on an "as-is" basis, as general market commentary, and do not constitute investment advice. The market commentary has not been prepared in accordance with legal requirements designed to promote the independence of investment research, and it is therefore not subject to any prohibition on dealing ahead of dissemination. Although this commentary is not produced by an independent source, FXCM takes all sufficient steps to eliminate or prevent any conflicts of interest arising out of the production and dissemination of this communication. The employees of FXCM commit to acting in the clients' best interests and represent their views without misleading, deceiving, or otherwise impairing the clients' ability to make informed investment decisions. For more information about the FXCM's internal organizational and administrative arrangements for the prevention of conflicts, please refer to the Firms' Managing Conflicts Policy. Please ensure that you read and understand our Full Disclaimer and Liability provision concerning the foregoing Information, which can be accessed on the website.

Potential Bearish Continuationon the H4, with price moving below the ichimoku cloud, we have a bearish bias that price will drop from the pivot at 26110 in line with the 100% fibonacci projection and overlap support to the 1st support at 24830 in line with the horizontal swing low.
alternatively, price may rise from the pivot to the 1st pullback resistance at 26900 in line with 78.6% fibonacci projection and 50% fibonacci retracement.

Nikkei Pivotal Trend TestIn this update we review the recent price action in the Japanese Nikkei futures contract and identify the high probability trading opportunity and price objectives to target

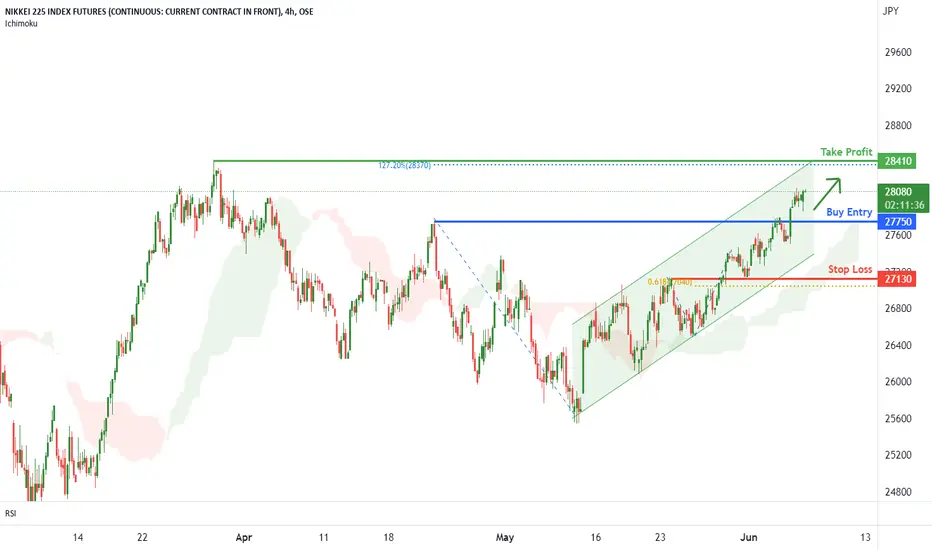
Nikkei 225 Potential Bullish ContinuationOn the H4, with price moving above the ichimoku cloud and within the ascending trend channel, we have a bullish bias that price will continue to rise from our entry at 27760 in line with the overlap swing high to our take profit at 28410 in line with the 127.20% fibonacci expansion at the swing high. Alternatively, price may reverse and break the support level at our entry and drop to our stop loss at 27130 in line with the 61.8% fibonacci projection .
Any opinions, news, research, analyses, prices, other information, or links to third-party sites contained on this website are provided on an "as-is" basis, as general market commentary, and do not constitute investment advice. The market commentary has not been prepared in accordance with legal requirements designed to promote the independence of investment research, and it is therefore not subject to any prohibition on dealing ahead of dissemination. Although this commentary is not produced by an independent source, FXCM takes all sufficient steps to eliminate or prevent any conflicts of interest arising out of the production and dissemination of this communication. The employees of FXCM commit to acting in the clients' best interests and represent their views without misleading, deceiving, or otherwise impairing the clients' ability to make informed investment decisions. For more information about the FXCM's internal organizational and administrative arrangements for the prevention of conflicts, please refer to the Firms' Managing Conflicts Policy. Please ensure that you read and understand our Full Disclaimer and Liability provision concerning the foregoing Information, which can be accessed on the website.

Potential Bullish ContinuationOn the H4, with price moving above the ichimoku cloud and within the ascending trend channel, we have a bullish bias that price will continue to rise from our entry at 27760 in line with the overlap swing high to our take profit at 28410 in line with the 127.20% fibonacci expansion at the swing high. Alternatively, price may reverse and break the support level at our entry and drop to our stop loss at 27130 in line with the 61.8% fibonacci projection.
Any opinions, news, research, analyses, prices, other information, or links to third-party sites contained on this website are provided on an "as-is" basis, as general market commentary, and do not constitute investment advice. The market commentary has not been prepared in accordance with legal requirements designed to promote the independence of investment research, and it is therefore not subject to any prohibition on dealing ahead of dissemination. Although this commentary is not produced by an independent source, FXCM takes all sufficient steps to eliminate or prevent any conflicts of interest arising out of the production and dissemination of this communication. The employees of FXCM commit to acting in the clients' best interests and represent their views without misleading, deceiving, or otherwise impairing the clients' ability to make informed investment decisions. For more information about the FXCM's internal organizational and administrative arrangements for the prevention of conflicts, please refer to the Firms' Managing Conflicts Policy. Please ensure that you read and understand our Full Disclaimer and Liability provision concerning the foregoing Information, which can be accessed on the website.
Potential Bullish Momentum On the H4, with price moving above the ichimoku cloud , we have a bullish bias that price will; rise from pivot at 27370 in line with the overlap support to the 1st resistance at 27740 in line with the 127.2% fibonacci extension and horizontal swing high.
Alternatively, price may break the pivot and support structure and drop to the 1st support at 27140 in line with the 78.6% fibonacci projection .

Potential for Bullish ContinuationOn the H4, price is moving above the ichimoku cloud and within the ascending trendline which supports bullish bias that price will rise from our pivot at 26610 in line with the 38.2% fibonacci retracement to the resistance at 27740 in line with the 78.6% fibonacci retracement and swing high. Additionally, the presence of bullish pressure shown on the MACD indicator further supports our bullish bias.
alternatively, price may reverse and break the pivot and drop to our support level at 25660 in line with the 78.6% fibonacci projection.

E-Mini Nickel Commodity USA Sun Storm Investment Trading Desk & NexGen Wealth Management Service Present's: SSITD & NexGen Portfolio of the Week Series
Focus: Worldwide
By Sun Storm Investment Research & NexGen Wealth Management Service
A Profit & Solutions Strategy & Research
Trading | Investment | Stocks | ETF | Mutual Funds | Crypto | Bonds | Options | Dividend | Futures |
USA | Canada | UK | Germany | France | Italy | Rest of Europe | Mexico | India
Disclaimer: Sun Storm Investment and NexGen are not registered financial advisors, so please do your own research before trading & investing anything. This is information is for only research purposes not for actual trading & investing decision.
#debadipb #profitsolutions

NIKKEI Weekly TrackingPublishing chart to track the NI225 .
Currently trading on a channel. Bouncing off the lows in early 2022, it is approaching the mid-range of the channel, while also forming a wedge.
With the Yen going through such a rough time, it's possible people pile into stocks to shield from inflation – US equities might not be much help.

The cloud comes the rescue ?30min Ichimoku cloud looks to be a solid support for CME Yen NK225 M2 futures. Note that the market had bounced off from its recent contact to the cloud (TKY 20:30). The elevated implied ichimoku cloud seen head would most likely lift the market as the US market starts to find its calmness. Moreover, VZO/PZO oscillator indicated below heading support line, suggesting weakening market is getting attractive to get lifted sooner than later..
Will see
NK Radio

Nikkei Playing The WXY PatternIn this update we review the recent price action in the Nikkei futures contract and identify the next high probability trading opportunity and price objectives to target

Nikkei225 Long Strategy Working WellIn this update we review the recent price action in the Nikkei225 futures contract and identify the next high probability trading opportunities and price objectives to target.

Nikkei Pitchfork PlayIn this update we review the recent price action in the Nikkei and identify the next high probability trading opportunity and price objectives to target.

Nikkei Momentum Loss To Be AddressedIn this update we review the recent price action in the Nikkei (futures contract) and identify the next high probability trading opportunity and price objective to target.

Nikkei225 Trading The Bullish SequenceIn this update we review the recent price action in the Nikkei (futures contract( and identify the next high probability trading opportunities and price objectives to target.

Elliott Wave View: Nikkei (NKD) Looking to End 5 Waves ImpulseRally in Nikkei Futures (NKD) from March 8, 2022 low (24510) is in progress as a 5 waves impulse Elliott Wave structure. Up from March 8 low, wave 1 ended at 25580 and pullback in wave 2 ended at 24790. Wave 3 has ended at 27910 with internal subdivision as a 5 waves in lesser degree. Up from wave 2, wave ((i)) ended at 25570 and wave ((ii)) pullback ended at 24895. Index then resumes higher in wave ((iii)) towards 27190 and dips in wave ((iv)) ended at 27120. Final leg higher wave ((v)) ended at 27190 which also completes wave 3.
Pullback in wave 4 has ended at 27400. Near term, while pivot at 24914 low stays intact, expect Index to extend higher in 5 waves to end wave 5. This will complete wave (1) in higher degree and end cycle from March 8 low. Afterwards, it should pullback in wave (2) in larger degree 3 waves to correct cycle from March 8 low before the rally resumes. As far as pivot at March 8 low (24510) stays intact, wave (2) pullback should find support in the sequence of 3, 7, or 11 swing for further upside.

Nikkei225 Wave Sequence TradeIn this update we review the recent price action in the Nikkei225 (futures contract) and identify the next high probability trade location and price objectives to target.

Weekly Rectangle + Symmetrical Triangle + Possible Failure H&S
Possible Failure H&S below 26935 will confirm Breakout of Major Pattern Rectangle??


Elliott Wave View: Nikkei (NKD) Searching for SupportNikkei Futures (NKD) is presently at the 100% – 161.8% Fibonacci extension from February 16, 2021 high and the Index is searching for support. Short Term view suggests that the decline from November 16, 2021 high is unfolding as a 5 waves impulse structure. Down from November 16, 2021 high, wave 1 ended at 27390 and rally in wave 2 ended at 29420. The Index then resumed lower in wave 3 towards 26050 and wave 4 bounce ended at 27897. Wave 5 is now in progress with internal subdivision as another impulse in lesser degree.
Down from wave 4, wave (i) ended at 26845 and rally in wave (ii) ended at 27555. Index then resumed lower in wave (iii) towards 26550 and rally in wave (iv) ended at 27025. Index is expected to complete wave (v) soon and this should complete wave ((i)) in higher degree. Afterwards, Index should rally in wave ((ii)) to correct cycle from February 10, 2022 high before the decline resumes. Near term, as far as pivot at 27897 high stays intact, expect rally to fail in 3, 7, or 11 swing for further downside. Potential target for wave 5 lower is 123.6 – 161.8% external retracement of wave 4 at 24905 – 25615 area.
