Day 58 — Trading Only S&P Futures | +$304 & Easy FOMC GainsRecap & Trades
Day 58 — clean and easy.
We had some conflicting signals early, but once the structure aligned, it became a straightforward session.
The key takeaway today was how FOMC movement tends to cap between 30–60 points, which makes it easy to plan trades if you size stops properly.
Overall,
Related futures

Trading Rejection Strategy- A Visual Backtest💡 Overview
Here is everything you need to know about the strategy. But before you study it any further, all the visuals are at the end of this post- so don't miss that part.
This setup is built upon simple beliefs:
▶Price always remembers its key levels- Previous Day’s High (PDH), Previous Day’s
Day 60 — Trading Only S&P Futures | 10-for-10 Green TradesStick around — at the end, I’ll break down the key levels I’m watching for tomorrow. Let’s go.
Recap & Trades
Day 60 — another clean session.
We started the day with a bearish structure, so my plan was simple: wait for price to reach the 1-minute MOB and short it.
Every trade lined up with VX Algo

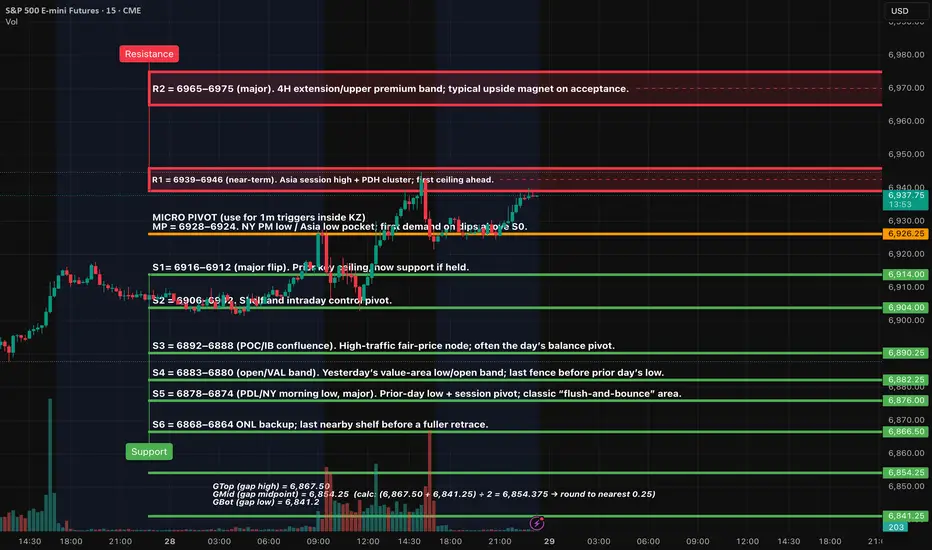
ES (SPX, SPY) Analysis, Key Levels, Setups for Wed (Oct 29)As we look at the current market conditions, the price is hovering just below the 6939-6946 resistance level. We should anticipate a test of this ceiling soon. A solid acceptance above 6946 on the 15-minute chart would likely trigger a movement towards the 6965-6975 range, which we can expect to see
ES UpdateNo rate cut in December? WHo cares? META missed earnings? Who cares? MSFT down after earnings? WHo cares?
The melt up must continue until the daily gets overbought, lol. Gotta set up for the China trade deal news.
You can see that the algos did sell some today, but futures are flat right now

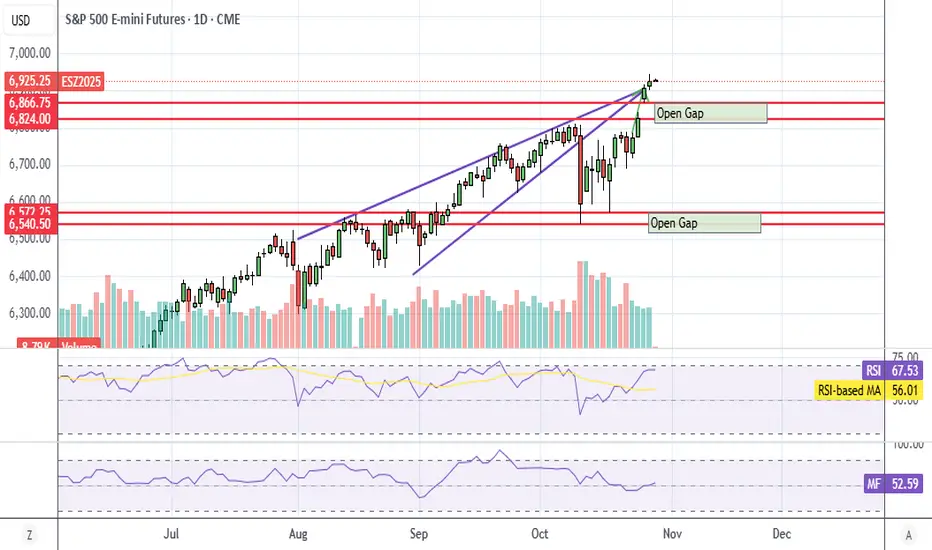
ES Daily Chart - Not Overbought YetLooks the ES is not overbought on the daily yet, so believe it or not, there's still room for a Fed pump or a China trade deal pump.
Wow.
I looked because futures are slightly green right now. Probably best not to short anything until after the Fed meeting. Watch out for China trade news Thu nig
ES UpdateRTY filled the gap, ES left open a small 1 pt gap, and NQ did not fill the gap at all. Really strange.
Anyways, 3 hr indicators moving up and Europe rallying. I'm not bullish though, might just take the week off.

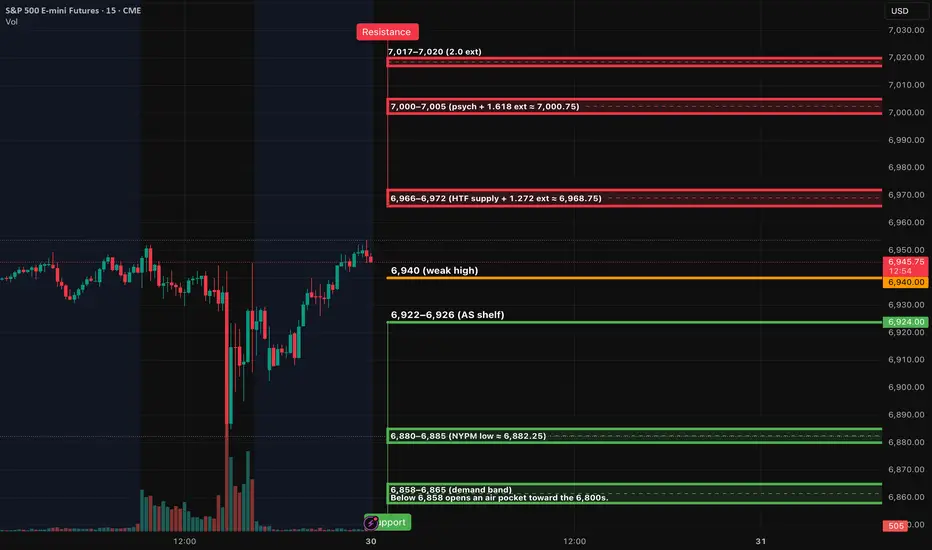
ES (SPX, SPY) Analysis, Key Zones, Setups for Thur (Oct 30th)Bias: Neutral → mild-bullish while 6,922 holds; momentum unlocks only on acceptance above the 6,966–6,972 pocket.
Setups — Rejection Fade (short): Tag 6,966–6,972 and print a 15m rejection close back inside, then a 5m re-close lower with a lower high, then take the 1m first-pullback fail. Stop =
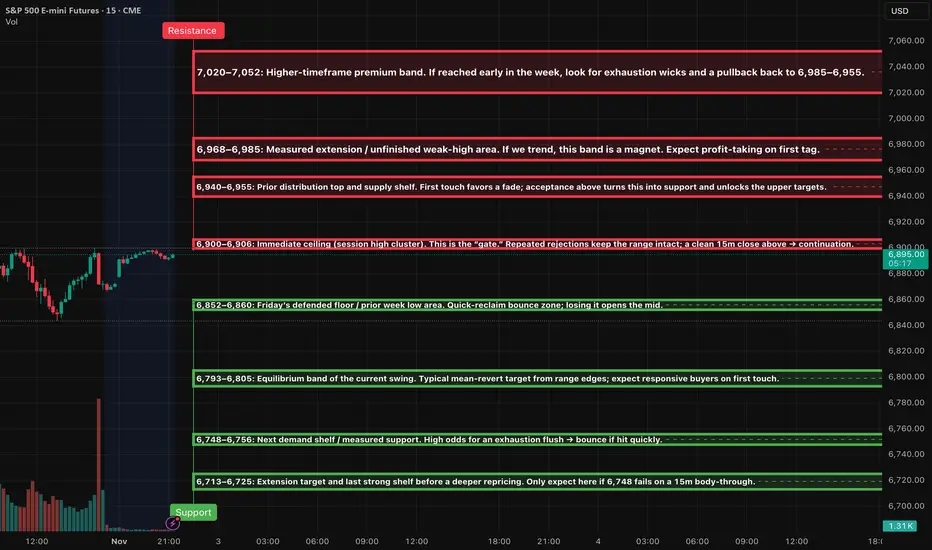
ES (SPX, SPY) Week Ahead Analysis, Nov 3rd - Nov 7thMarket Context
The price is currently positioned just below a key near-term resistance level at 6,900–6,906, following a sharp reversal on Friday from around 6,845. The daily and 4-hour structures indicate an incomplete "weak-high" area above, but the 1-hour momentum has just shifted upward from ov
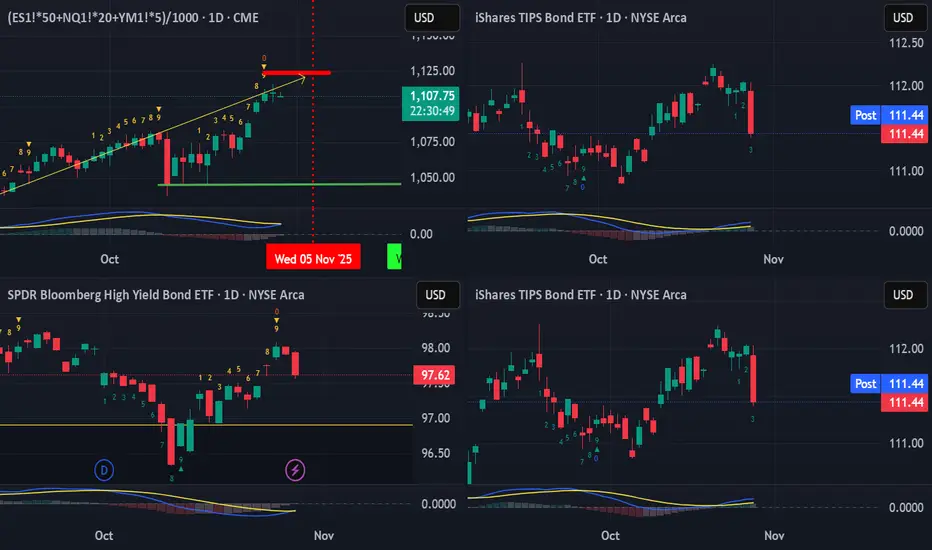
US Equities have this week left... Part IISo, yesterday heads up was given that the US Equities (and pretty much global equities generally) have this week left of bullishness.
This was observed with a TD Bear Setup perfected completion, coming into a stall. What was not mentioned was that the leading indicators of JNK, TIP and TLT were alre
See all ideas
Summarizing what the indicators are suggesting.
Neutral
SellBuy
Strong sellStrong buy
Strong sellSellNeutralBuyStrong buy
Neutral
SellBuy
Strong sellStrong buy
Strong sellSellNeutralBuyStrong buy
Neutral
SellBuy
Strong sellStrong buy
Strong sellSellNeutralBuyStrong buy
A representation of what an asset is worth today and what the market thinks it will be worth in the future.
Displays a symbol's price movements over previous years to identify recurring trends.
Frequently Asked Questions
The current price of E-mini S&P 500 Futures (Sep 2029) is 7,641.00 USD — it has risen 0.11% in the past 24 hours. Watch E-mini S&P 500 Futures (Sep 2029) price in more detail on the chart.
Track more important stats on the E-mini S&P 500 Futures (Sep 2029) chart.
The nearest expiration date for E-mini S&P 500 Futures (Sep 2029) is Sep 21, 2029.
Traders prefer to sell futures contracts when they've already made money on the investment, but still have plenty of time left before the expiration date. Thus, many consider it a good option to sell E-mini S&P 500 Futures (Sep 2029) before Sep 21, 2029.
Buying or selling futures contracts depends on many factors: season, underlying commodity, your own trading strategy. So mostly it's up to you, but if you look for some certain calculations to take into account, you can study technical analysis for E-mini S&P 500 Futures (Sep 2029). Today its technical rating is buy, but remember that market conditions change all the time, so it's always crucial to do your own research. See more of E-mini S&P 500 Futures (Sep 2029) technicals for a more comprehensive analysis.