NASDAQ 100 Recovery imminent! Nasdaq 100 Technical Analysis: The index maintains a solid bullish structure, with projections toward the target zone of 25,500 points, supported by positive momentum and strength in the main technological components.
Trade ideas

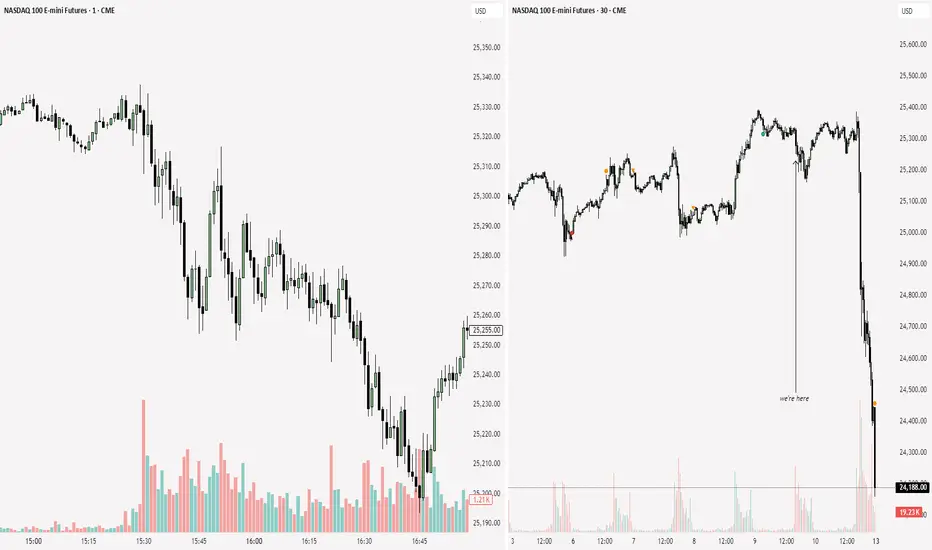
Tape and Trade excecution (DEMO), calling levels.Calling levels and taking demo trades on what I would've taken with Live funds, NFI!

Target areas - NQ price for Market open.10/17/25 - These are the target areas - NQ price for Market open depending if price moves up or down. Will look for trades into these areas.

NQ Power Range Report with FIB Ext - 10/17/2025 SessionCME_MINI:NQZ2025
- PR High: 24858.50
- PR Low: 24740.25
- NZ Spread: 263.5
Key scheduled economic events:
08:30 | Nonfarm Payrolls
- Average Hourly Earnings
- Unemployment Rate
Session Open Stats (As of 12:45 AM)
- Session Open ATR: 391.21
- Volume: 43K
- Open Int: 283K
- Trend Grade: Long
- From BA ATH: -2.7% (Rounded)
Key Levels (Rounded - Think of these as ranges)
- Long: 26020
- Mid: 23571
- Short: 21939
Keep in mind this is not speculation or a prediction. Only a report of the Power Range with Fib extensions for target hunting. Do your DD! You determine your risk tolerance. You are fully capable of making your own decisions.
BA: Back Adjusted
BuZ/BeZ: Bull Zone / Bear Zone
NZ: Neutral Zone
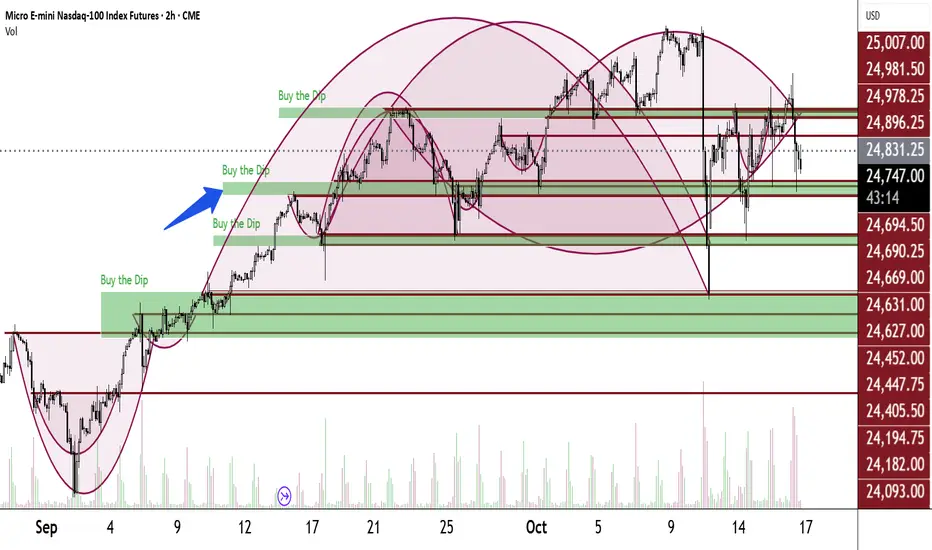
Cup ComplexA different view. It's easy to see strong support and resistance on this chart.
The horizontal lines are cup rims. Where they congregate you will meet buyers and sellers.
When the PX comes down to a green Buy the Dip area and bounces I buy back a Pawn and start a new Pawn for a King trade. Typically, I will only buy it back if I get a minimum 200-point pullback.
Today I bought back several Pawns in the indicated area and pocketed $$$. I'm still holding several in case the PX goes lower. I also pocketed $$$ from the Breakout aspect of A Pawn for a King trade plan.
This is how it works -when it bounces, above the high of the bounce I sell one Pawn and Buy two Kings. Whether the PX goes up or down I will profit. As a bonus, I also pocket $$$ from BTD trades and Pivot trades.
I nearly always have several A Pawn for a King trades going on. Today I started a new one @ 12:50:35. Using a 2/1 ratio, I bought 2 @ 24840 and sold 1 @ 24839.5. Using a 19.5-point profit target, I had 7 profit-taking trades. (I also had 15 additional profit-takers earlier in the day, all from A Pawn for a King trade plan.)
The PX pulled back and I started a 2nd Pawn for a King trade. I sold 1 @ 24759.5 @ 14:43:41 and bot 2 @ 24760 @ 14:43:42. Using the same 19.5-point profit-taker I pocketed 4 more. .5 points above each profit-taker I buy 2 more. I climb the profit-ladder all the while having a Pawn to buy back. I try to get a 200-point pullback and bounce before buying back a Pawn. Sometimes I get more. Sometimes less (but not much less).
I hope all this detail doesn't make it sound complicated. It's not. It is very simple. Demo trade it and see for yourself.
For these trade plans view my prior published ideas. Make them yours. Demo trade them. Get good at them.
It's a very simple, profitable plan.
My mind glazes over when I write numbers. Hope I wrote them all correctly. If I flubbed, forgive me.
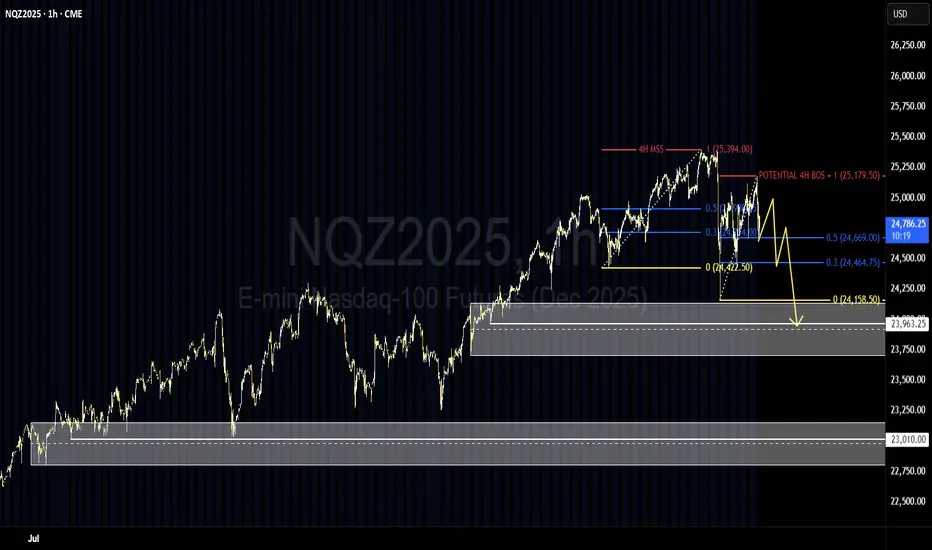
NQ 4H MSS and setting up for a potential 4H BOSWe’ve confirmed a 4H bearish market structure shift (MSS) and appear to be setting up for a bearish break of structure (BOS).
I’m watching for short setups on my entry timeframes — so far, the cleaner days have offered solid opportunities. I’m keeping my focus on scalps, as the market remains heavily news-driven, but I can’t shake the sense that a key event could trigger a liquidity sweep of the lows.
That said, this could just as easily be another classic NQ pullback before a strong recovery. I trade what’s in front of me, but this is my higher-timeframe perspective built from my lower timeframe analysis.
Time will tell…
NQ: 271st trading session - recapI was hella tired but we still ended up having a great session. It is really just about staying patient and stuff...
Forty Years in the WildernessWe'll get to The Promised Land. Winnowing happens. It purges the chaff.
Of traders it is said that it ''shakes out weak hands.''
We know how to read charts, manage margin and we have four trading plans. We are the grain, the staff of life, that remains after the winnowing.
Familiarize yourselves with the four trading plans I have published. Practice them. Become proficient with them.
There is great potential in the chart you are viewing.


NQ - 10/16The red box is yesterday's candle showing the high, median and low range.
within the daily candle is a 15min ladder that creates a 1hr FrontSide(FS) level in yellow.
The Inv,FS in blue above price is the 15min resistance level.
Inv. stands for Inverse. They are the inverse of the other levels labels BS or FS.
BS or FS = support levels unless marked as a solid line.
Inv.BS or Inv.FS = resistance unless marked as solid line,
The grey box is last week high, median and low range.
The green lines are some 5min timeframe levels.

tomorrows chart markupsshould i start going live??? Im really dope in this market.
So I posted chart markups for tomorrow. Its 8am and i LITERALLY WAS IN THE MARKET FOR 6 mins and 54 secs. profited double my daily profit on my funded account ($1200). I know what im doing and I know what I see in these markets. I dont need indicators telling me anything. Shoutout to the NAKED traders. Follow me, until tomorrow young bulls!!!
keep going bullish until it hit my blue zone. then make a decision

GET IN WHERE YOU FIT INGO check the post i posted about the chart markups today and where price was going to go... you eat between the lines... price was between levels and it broke a support zone and retested it. Good thing about it, some of yall can profit off the picture post if you trade off the 1 minute timeframe because I gave yall the sauce.
PRICE DIDNT EVEN HIT THIT THE NECKLINE FROM THE DOUBLE TOP PATTERM CREATED LAST WEEK BEFORE THE MAJOR DROP. READ THE CANDLES, IT SHOWS YOU HOW TO PRINT MONEY.

GO LOOK AT MY PREVIOUS POST.....i ate off this!! trade took no time to hit... switched betwenn regular candles and heiken-ashi
BIG WIN TODAY

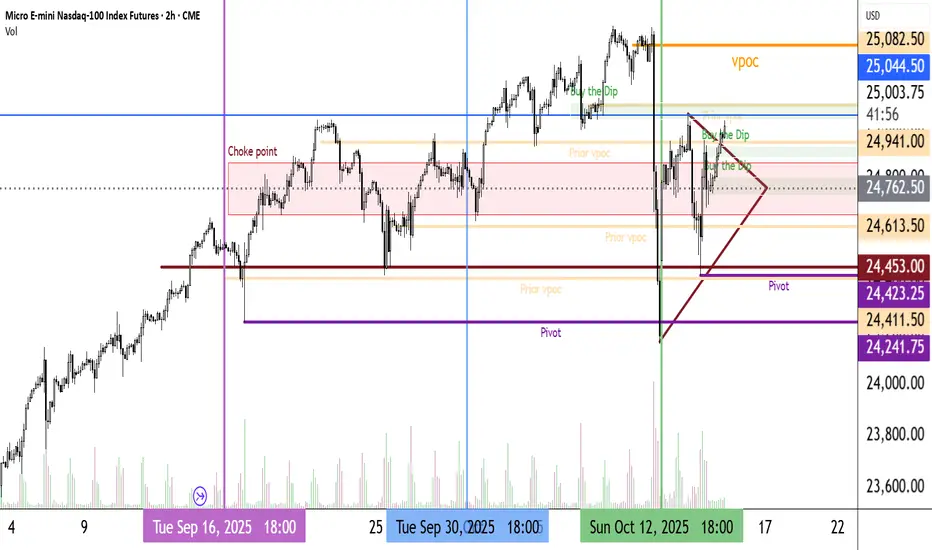
Very Busy ChartNecessary to see all support, resistance, Buy the Dip areas and other important features.
Key areas to note.
1.PX cleared the choke point
2.PX broke out of the coil
3.Buy the Dip areas
4.Resistance at prior vpoc 25082.5
If we close above that I will add to my position.
Much more could be said. I'm catching some market news and clearing my head a bit.
NQ Power Range Report with FIB Ext - 10/15/2025 SessionCME_MINI:NQZ2025
- PR High: 24816.25
- PR Low: 24750.50
- NZ Spread: 147.0
CPI rescheduled to Friday per AMP Futures update
Session Open Stats (As of 12:15 AM)
- Session Open ATR: 375.60
- Volume: 30K
- Open Int: 279K
- Trend Grade: Long
- From BA ATH: -2.4% (Rounded)
Key Levels (Rounded - Think of these as ranges)
- Long: 26020
- Mid: 23571
- Short: 21939
Keep in mind this is not speculation or a prediction. Only a report of the Power Range with Fib extensions for target hunting. Do your DD! You determine your risk tolerance. You are fully capable of making your own decisions.
BA: Back Adjusted
BuZ/BeZ: Bull Zone / Bear Zone
NZ: Neutral Zone
SpitballingLet's say you buy 3 MNQs @ 24680. Every 20 points you buy 3 all the way up to 24940.
Every 19.5 points you sell three - i.e. you take profit off the table.
If my quick off the top of my head math is right you will have made about $1,450.02 profit, or thereabouts.
Now at 24939.50 you sell 1 MNQ and you continue with the above pattern buying 3 contracts every 20 points all the while taking profit off the table every 19.5 points.
Wait for a pullback of at least 200 points less than where you sold that 1 MNQ @ 24939.50. Make sure you get a good bounce. Buy back the one you sold. Start your ladder again - buying 3 MNQs every 20 points and taking profit every 19.5 points.
This is a bull market. One must trade accordingly.
It all comes down to a very hard word - commit.
I just looked up the dictionary meaning of the word commit. It says pledge or bind a person or an organization to a certain course or policy

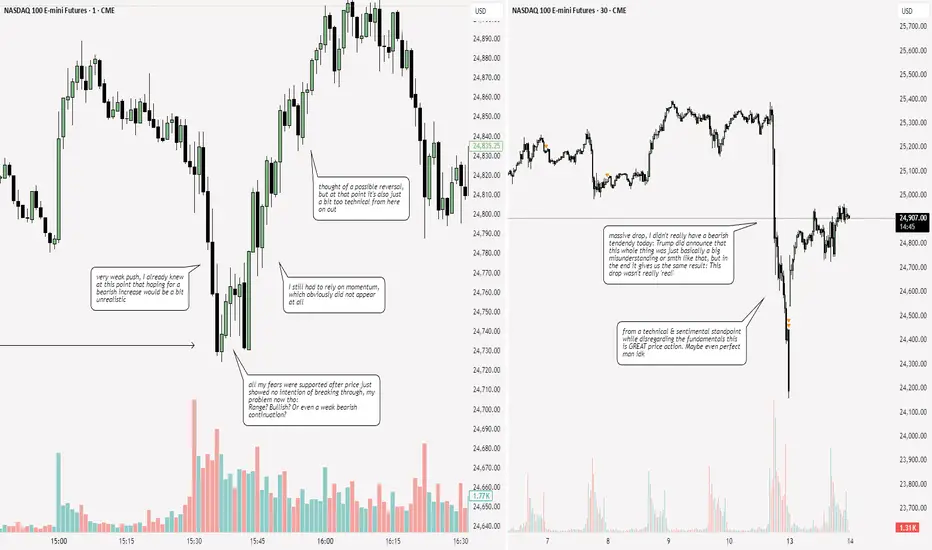
NQ: 269th trading session - recapDefinitely a more exciting day, didn't know what to think of though. The whole Trump dilemma is just again clouding my judgement. I don't really like that, surprise.
NQ & ES Premarket Comment Monday 13-10-2025 Good morning everyone,
Following the recent market crash, we’re now left with unfilled gaps both above and below current price levels. As a result, the market is currently trading within an equilibrium zone — a balanced range — after opening significantly higher and leaving a large imbalance behind.
Personally, I don’t expect further downside from here. However, given that today is a U.S. market holiday, I wouldn’t advise active trading. Still, since I’m committed to providing analysis on every open session, here are the scenarios I’m watching:
____________________________________
Daily Bias: Neutral
Possible Scenarios:
1. Scenario One: At the open, price could pull back to find support near the NWOG level. As this unfolds, we’ll likely notice bearish price action showing short-term weakness — breaking through support levels while struggling to gain acceptance above resistance zones. This will signal that the market is testing liquidity pockets before making its true directional move. Once the initial volatility fades and the noise settles, the price action should reveal its true intention. If price then reclaims the equilibrium point (purple line) with conviction, we could see a bullish reversal to the upside.
2. Scenario Two: Alternatively, price may continue to grind higher gradually without offering meaningful pullbacks or discounted entries.
If the first scenario unfolds, we’ll be looking for short opportunities down into the purple line, and then transition to long setups once we see a clean reclaim below and back above that equilibrium area.
If the second scenario plays out, we’ll remain on the sidelines, as any participation under such structure would expose us to unnecessary risk.
________________________________
Trade Focus
Try to capture either the red (bearish) move or the blue (bullish) move — and leave everything else aside.
Avoid forcing trades in the middle of the range; stay patient and let the market commit to a clear directional bias before engaging.
________________________________
Technical Guidance
As the market opens, we’ll monitor the initial price action closely. After the recent volatility and structural resets, today’s best move may simply be to observe. Let the market show its hand first — watch how liquidity is engineered and absorbed.
Smart traders avoid overtrading on days like this — just as a cat avoids a dog.
Remember: it’s always better to have a day with no profits than a day with losses. Stay disciplined, remove ego from decision-making, and use today as a learning opportunity — both for your trading career and your personal development.
Don’t get influenced by social media noise — most traders out there are still lost in volatility. Be patient, stay sharp, and wait for the market to present clean, high-probability setups aligned with your plan.
PF

NDX/NQ1 - Futures in Trouble!Good Morning Every,
Hope all is well. On Friday we say a 3 1/2 drop on the NASDAQ. Not a good sign, that is a large drop for a daily. This all in response to the turf war between China & USA that could revive itself. This morning futures rebounded however the lack of conviction had them bounce off the 9EMA and travelling downwards again. This suggest that investors sentiment is still airing on the side of caution.
I am short-term short until trends show otherwise.
Trade safely!
Enjoy

NQ Power Range Report with FIB Ext - 10/13/2025 SessionCME_MINI:NQZ2025
- PR High: 24752.25
- PR Low: 24541.75
- NZ Spread: 470.25
No key scheduled economic events
+0.4% weekend gap up retracing 50% of Friday's 892 point range
Session Open Stats (As of 12:15 AM)
- Session Open ATR: 370.30
- Volume: 75K
- Open Int: 284K
- Trend Grade: Long
- From BA ATH: -2.3% (Rounded)
Key Levels (Rounded - Think of these as ranges)
- Long: 26020
- Mid: 23571
- Short: 21939
Keep in mind this is not speculation or a prediction. Only a report of the Power Range with Fib extensions for target hunting. Do your DD! You determine your risk tolerance. You are fully capable of making your own decisions.
BA: Back Adjusted
BuZ/BeZ: Bull Zone / Bear Zone
NZ: Neutral Zone
NQ: 268th trading session - recapAlso just for the books - FORGOT TO DO IT. Im not happy with myself lmao
NQ: 267th trading session - recapNothing important happened - this is just for the books. Totally forgot tho which is not good