NQ/ES Overnight Short PotentialWatching for an overnight setup on NQ/ES.
Waiting for ES to take PDH liquidity
Bias is for a move lower after the sweep, provided we don’t drop prematurely.
Targets are into the call wall / gamma zones below.
MNQM2019 trade ideas

Nasdaq 100 (NQ) - Technical Analysis Report - 20250908Analysis Date: September 8, 2025
Current Price: 23,671
Market Session: Post-Market Analysis
---
Executive Summary
Nasdaq 100 presents a moderately extended equity position requiring defensive management, but with meaningful institutional support structure revealed through 3-quarter volume profile analysis. While trading above recent institutional accumulation, the presence of multiple quarterly POCs creates a more robust support framework than initially assessed. This positioning requires cautious defensive strategies rather than emergency liquidation, with clear institutional reference levels for risk management.
---
Quarterly Volume Profile Analysis
3-Quarter Institutional Positioning Intelligence
The 3-quarter volume profile (Q1-Q3 2025) reveals a complex but supportive institutional positioning pattern across multiple price ranges:
Multi-Quarter Institutional Activity Zones:
Q1 2025: Heavy blue institutional accumulation at 21,800-22,200 range
Q2 2025: Substantial blue volume during correction at 19,800-20,500 range
Q3 2025: Fresh institutional activity developing at 22,000-22,400 levels
Current price (23,671) moderately extended above most recent institutional positioning
Comprehensive Support Structure:
Primary Support: 22,000-22,400 (Q1/Q3 institutional convergence zone)
Secondary Support: 20,200-20,500 (Q2 correction accumulation)
Extended Support: 19,500-20,000 (historical institutional floor)
Current Extension: 6-8% above primary institutional zones (manageable vs. catastrophic)
Institutional Pattern Analysis:
21,800-22,200: Q1 original institutional positioning validates current levels
19,800-20,500: Q2 correction buying shows institutional conviction during weakness
22,000-22,400: Q3 re-engagement demonstrates continued institutional participation
Above 23,000: Moderate extension requiring defensive positioning
Price Structure Context
Historical Pattern Recognition:
The 3-quarter analysis reveals continuous institutional engagement rather than abandonment, indicating healthy market structure with multiple layers of smart money support. This pattern suggests institutional rotation and repositioning rather than wholesale exit from technology exposure.
Revised Risk Assessment:
Moderate Extension: 6-8% above institutional levels vs. previously assessed 18%+
Multiple Support Layers: Three quarterly POCs provide robust institutional framework
Institutional Continuity: Ongoing smart money participation throughout 2025
Risk Definition: Clear institutional boundaries at multiple levels for defensive management
Sector Composition and Market Leadership
Technology Sector Positioning:
Artificial intelligence leadership driving institutional reallocation
Mega-cap concentration providing stability and institutional interest
Innovation premium supporting elevated valuation multiples
Defensive technology characteristics during uncertain economic cycles
---
Execution Chart Technical Analysis
Current Technical Configuration - MIXED SIGNALS
DEMA Analysis - MOMENTUM CONCERNS:
Black Line (Fast DEMA 12): Currently at 23,671
Orange Line (Slow DEMA 20): Currently at 23,597
Configuration: Bullish but showing momentum deceleration
Trend Bias: Technical momentum weakening despite continued bullish bias
DMI/ADX Assessment - TREND MATURITY:
ADX Level: Declining from previous highs, indicating mature trend phase
+DI vs -DI: +DI maintaining slight edge but margin narrowing
Momentum Direction: Signs of trend maturation after extended advance
Trend Strength: Weakening ADX suggests institutional repositioning phase
Stochastic Analysis - OVERBOUGHT BUT NOT EXTREME:
Tactical Stochastic (5,3,3): Overbought with some negative divergence
Strategic Stochastic (50,3,3): Extended levels but within historical norms
Divergence Analysis: Moderate negative divergences suggesting consolidation need
Support and Resistance Levels
Critical Technical Levels:
Current Resistance: 24,000 (psychological and technical barrier)
Immediate Support: 23,400 (DEMA cluster support)
Key Support: 22,800 (recent consolidation boundary)
Major Support: 22,200 (Q1/Q3 institutional convergence)
Critical Support: 20,500 (Q2 institutional accumulation)
Ultimate Support: 19,500-20,000 (historical institutional floor)
---
Trading Scenarios and Setup Criteria
Scenario 1: Defensive Profit-Taking Setup (PRIMARY)
Recommended Position Management:
Systematic reduction of existing positions by 50-75%
Profit-taking priority given moderate extension above institutional levels
Maintain small tactical exposure with tight risk management
Capital reallocation to higher-conviction institutional accumulation opportunities
Profit-Taking Protocol:
Primary Action: Reduce positions by 50-75% at current levels
Secondary Reduction: Complete exit on failure to hold 22,500 support
Stop Management: Trail stops using 22,200 institutional support
Cash Allocation: Redirect capital to commodity opportunities with stronger institutional backing
Scenario 2: Tactical Range Trading (SECONDARY)
Range-Bound Management:
Defined range: 22,200-23,800 (institutional support to resistance)
Small position tactical trading within institutional boundaries
Quick profit-taking on bounces toward 23,500-23,800
Defensive positioning on approaches to 22,200 support
Range Parameters:
Long Zone: 22,200-22,500 (institutional support approach)
Short Zone: 23,600-23,800 (resistance approach)
Stop Distance: 400-600 points maximum
Position Size: Reduced allocation (1% account risk maximum)
Scenario 3: Breakdown Management (DEFENSIVE)
Support Violation Protocol:
Break below 22,200 requires immediate position liquidation
Institutional support violation indicates potential deeper correction
Target return to 20,200-20,500 Q2 institutional accumulation
Complete avoidance until clear institutional re-engagement
Breakdown Parameters:
Critical Level: 22,200 (institutional support)
Action Required: Immediate exit of all positions
Targets: 20,500, 20,000, 19,500 (institutional accumulation zones)
Re-entry Criteria: New institutional accumulation evidence required
---
Risk Management Protocols
Position Sizing Guidelines
Defensive Approach (Recommended):
Maximum Risk: 1.5% of account (reduced from standard due to extension)
Contract Calculation: Account Size × 0.015 ÷ (Stop Distance × $5)
Example: $100,000 account with 500-point stop = 40 contracts maximum
Rationale: Extended positioning requires conservative allocation
Stop Loss Hierarchy
Tactical Stop: 23,200 (execution chart support cluster)
Strategic Stop: 22,200 (institutional support boundary)
Emergency Stop: 20,500 (Q2 institutional accumulation violation)
Portfolio Management Framework
Defensive Positioning Strategy:
Current Holdings: Reduce exposure by 50-75%
New Positions: Limited tactical exposure only
Capital Reallocation: Redirect to institutional accumulation opportunities (NG, CL, 6E)
Monitoring Frequency: Daily assessment of institutional level respect
---
Market Context and External Factors
Technology Sector Fundamental Assessment
Supporting Factors:
Artificial intelligence revolution driving institutional reallocation
Productivity gains supporting elevated valuation multiples
Defensive growth characteristics during economic uncertainty
Innovation leadership providing competitive advantages
Risk Factors:
Interest rate sensitivity affecting growth stock premiums
Regulatory scrutiny on mega-cap technology companies
Valuation concerns at current extension levels
Economic cycle sensitivity for discretionary technology spending
Institutional Investment Trends
Smart Money Positioning:
Continued institutional engagement evidenced by Q3 volume activity
Rotation within technology rather than wholesale sector exit
Quality focus on mega-cap names with defensive characteristics
AI theme driving strategic institutional reallocation
---
Monitoring Checklist and Alert Levels
Daily Monitoring Requirements
Institutional Respect: Monitor behavior at 22,200 support boundary
DEMA Configuration: Watch for momentum deterioration or bearish crossover
Volume Analysis: Track institutional activity at current levels
Sector Rotation: Monitor technology vs defensive sector performance
Policy Impact: Federal Reserve decisions affecting growth stock valuations
Critical Alert Levels
Risk Escalation Alerts:
Break below 22,200 institutional support with volume
DEMA bearish crossover below 23,400
ADX declining below 20 with -DI gaining dominance
Technology sector rotation accelerating toward defensives
Defensive Action Triggers:
Multiple failures to break above 24,000 resistance
Volume decline on any rally attempts above 23,500
Institutional selling evidence (yellow volume) at current levels
Federal Reserve policy shifts affecting interest rate outlook
---
Strategic Outlook and Risk Assessment
Risk/Reward Analysis
Moderate Risk Profile:
Upside Potential: Limited 500-1,000 points to major resistance
Downside Risk: 1,500-3,000 points to institutional accumulation zones
Risk/Reward Ratio: Unfavorable 1:2+ downside bias
Probability Assessment: Moderate (35%) for further upside, High (65%) for correction
Portfolio Allocation Recommendation
Defensive Management Required
Nasdaq 100 requires defensive positioning due to moderate extension above institutional levels, but the presence of multiple quarterly POCs provides meaningful support structure. While not emergency territory, the asymmetric risk profile favors systematic profit-taking and capital reallocation to higher-conviction opportunities with stronger institutional backing. The 3-quarter analysis reveals ongoing institutional engagement, allowing for tactical exposure with proper risk management.
Allocation Framework:
Current Portfolio Weight: Reduce to 8-12% maximum (from higher previous levels)
Entry Method: Limited tactical positions only until institutional re-accumulation
Hold Period: Short-term tactical only, systematic profit-taking
Exit Strategy: Defensive reduction with 22,200 as critical support
---
Conclusion and Strategic Assessment
Nasdaq 100 analysis demonstrates the importance of comprehensive timeframe evaluation in institutional intelligence assessment. The 3-quarter volume profile reveals a more nuanced risk picture than initially assessed, showing continued institutional engagement across multiple price levels. While defensive positioning remains appropriate due to moderate extension, the presence of multiple institutional support layers allows for tactical exposure rather than complete avoidance. Current conditions warrant systematic profit-taking with clear institutional boundaries for risk management.
Strategic Priority: Defensive positioning with systematic profit-taking while respecting institutional support levels at 22,200 and 20,500 as critical risk management boundaries.
Next Review: Daily monitoring of institutional level respect and momentum indicators
Position Management: Systematic reduction with defensive stops at institutional boundaries
---
Important Disclaimer
Risk Warning and Educational Purpose Statement
This analysis is provided for educational and informational purposes only and does not constitute financial advice, investment recommendations, or trading signals. All trading and investment decisions are solely the responsibility of the individual trader or investor.
Key Risk Considerations:
Futures trading involves substantial risk of loss and is not suitable for all investors
Past performance does not guarantee future results
Market conditions can change rapidly, invalidating any analysis
Leverage can amplify both profits and losses significantly
Individual financial circumstances and risk tolerance vary greatly
Professional Guidance: Before making any trading decisions, consult with qualified financial advisors, conduct your own research, and ensure you fully understand the risks involved. Only trade with capital you can afford to lose.
Methodology Limitations: Volume profile analysis and technical indicators are tools for market assessment but are not infallible predictors of future price movement. Market dynamics include numerous variables that cannot be fully captured in any single analytical framework.
The views and analysis presented represent one interpretation of market data and should be considered alongside other forms of analysis and individual judgment.
upMost moving averages—from MA20 through MA200—are pointing “Buy”. Only the very short-term MA5 and MA10 remain bearish
Investing.com
.
This indicates that, while short-term momentum may be cooling, the medium-to-longer-term trend remains firmly bullish.

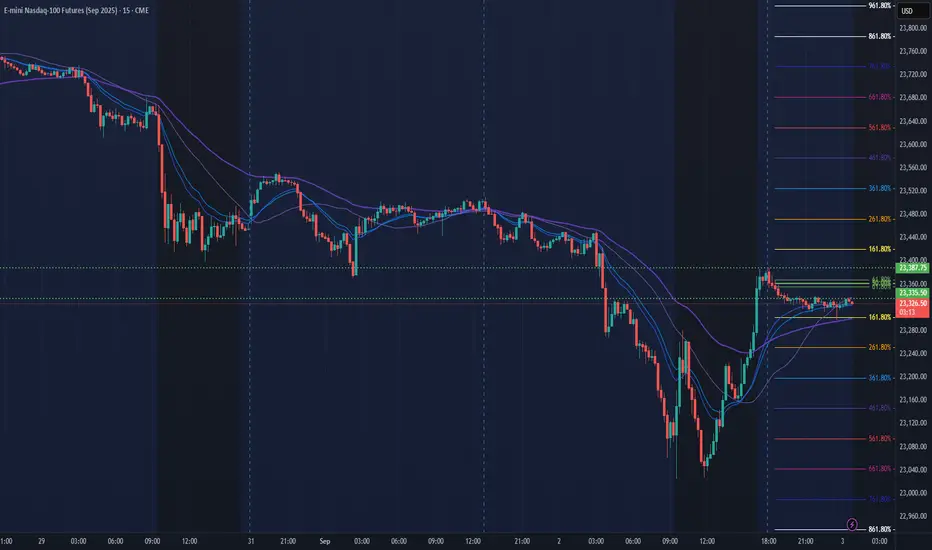
return to proven sellers provides cheap sell entry 1->4 : return to proven sellers
next ?
* bearish divergence
* bb obv upper deviation
* similar to #2 drop
* bearish candle pattern needed

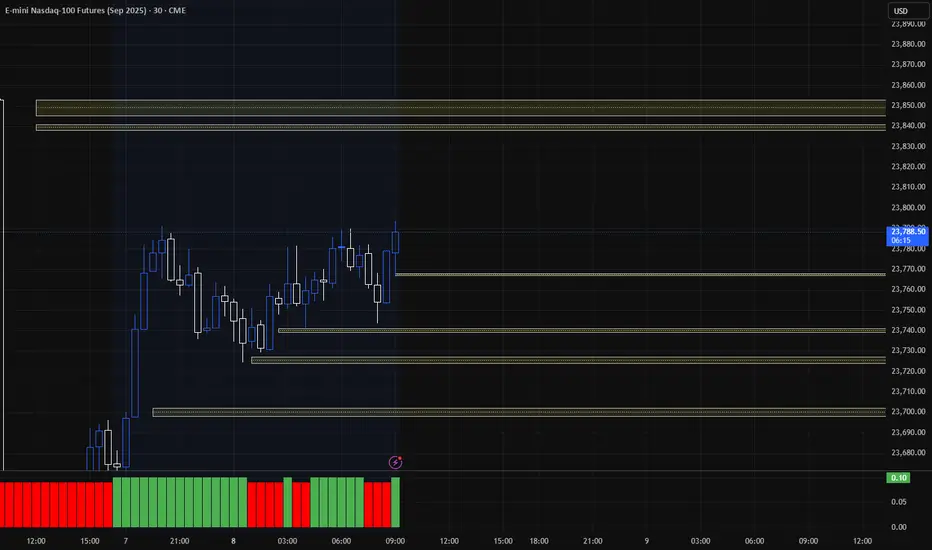
Target areas above and below current NQ price for Market open. 9/8/2025 - Target areas above and below current NQ price for Market open.
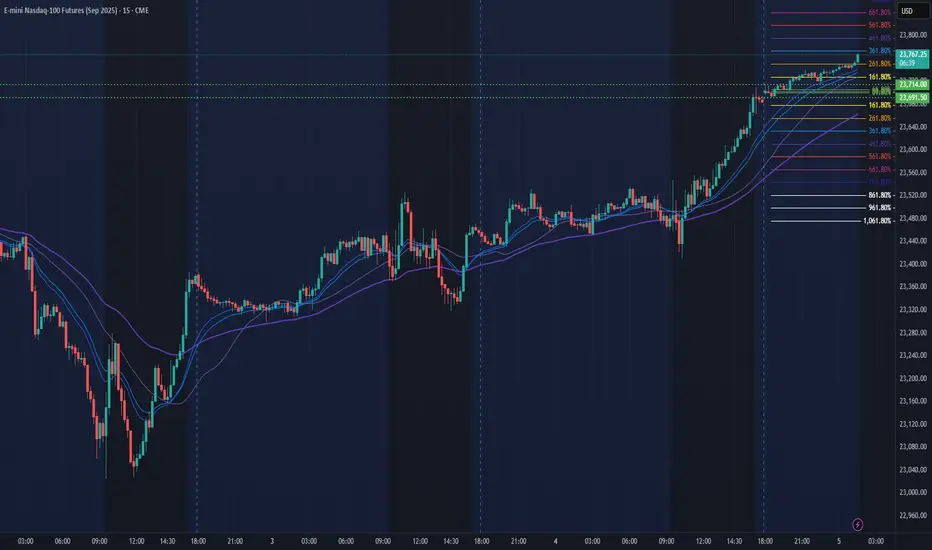
NQ - Upside remains, but time is tickingSEED_ALEXDRAYM_SHORTINTEREST2:NQ #NQ Further upside remains likely, as price is approaches the completion of both the W harmonic and #Elliottwave structures, with a fifth wave still in progress. However, the timing for this move appears limited, as price is nearing major resistance marked by the blue Earth/Mars synodic and pink Venus/Mars synodic planetary lines—these astro lines suggest a high-probability reversal or exhaustion zone is near.
CME_MINI:NQ1!

NQ Power Range Report with FIB Ext - 9/5/2025 SessionCME_MINI:NQU2025
- PR High: 23713.75
- PR Low: 23691.75
- NZ Spread: 49.0
Key scheduled economic events:
08:30 | Average Hourly Earnings
- Nonfarm Payrolls
- Unemployment Rate
AMP temp margins increase for pre-RTH jobs reports
Session Open Stats (As of 1:25 AM 9/5)
- Session Open ATR: 296.83
- Volume: 20K
- Open Int: 283K
- Trend Grade: Long
- From BA ATH: -1.3% (Rounded)
Key Levels (Rounded - Think of these as ranges)
- Long: 24382
- Mid: 23239
- Short: 22096
Keep in mind this is not speculation or a prediction. Only a report of the Power Range with Fib extensions for target hunting. Do your DD! You determine your risk tolerance. You are fully capable of making your own decisions.
BA: Back Adjusted
BuZ/BeZ: Bull Zone / Bear Zone
NZ: Neutral Zone
NQ: 246th trading session - recapI'll need to get back on my track - I know what my plan is, I just gotta push myself to actually write every part out and follow it
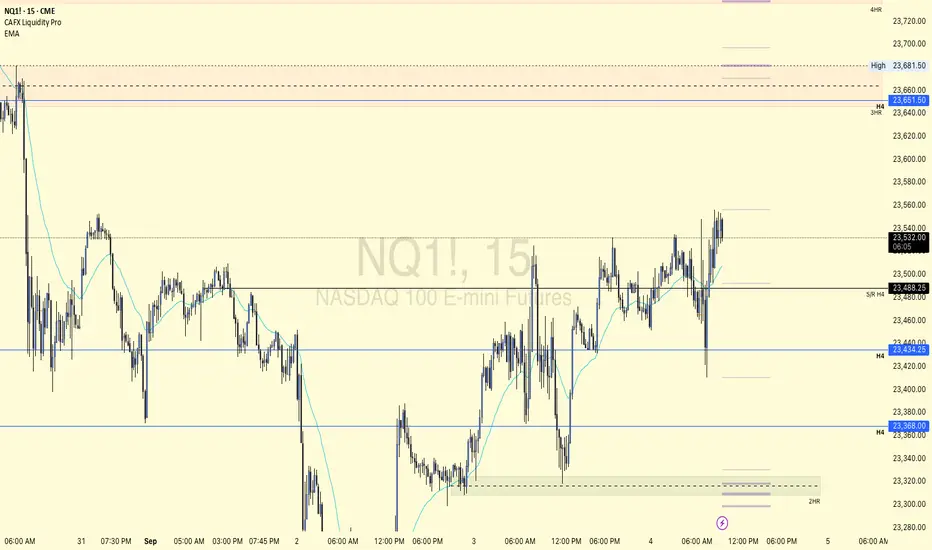
Fixed Range Volume Profile use it We are looking to retest top 23,525 NQ but if we fall below 23,427 NQ we going to the down side & short. I think we have a higher chance of going up to 23,700 NQ before Monday. I just want to take the time to thank the crazy Patrick Wieland and this cheap $200 course.
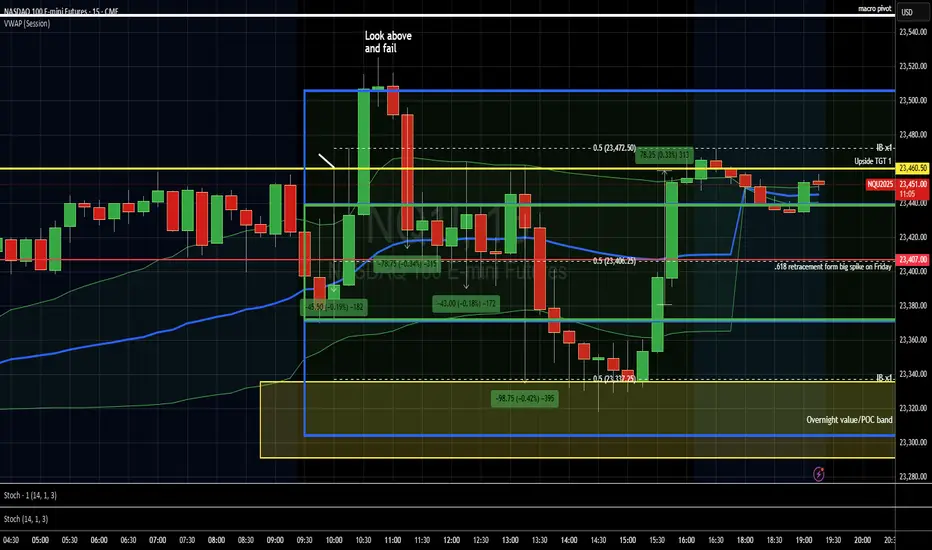
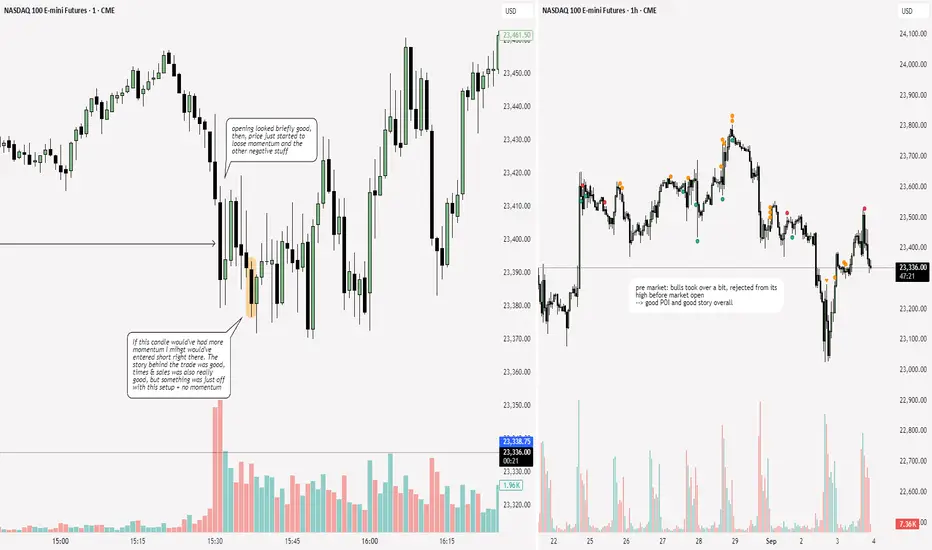
Nasdaq Futures: A Textbook Day of Balance and Precision PlaysNQ Recap - Sep 3, 2025: A masterclass in balance! Weaker JOLTS data sparked a relief rally, easing yields and lifting stocks, though markets zigzagged. Best trades? Confirmed breakouts or "look-above-and-fail" fades at 23,460.5 (IB high). Price held 23,407 support, squeezed late to 23,460, stalling at 23,472. Lower JOLTS signaled a cooling job market, hinting at eased inflation and Fed rate cuts—fuel for stocks, but recession fears loomed.
Tomorrow: Watch 23,407 & 23,460-72; break above targets 23,495-550, rejection eyes 23,3472.
#TradingView #Nasdaq #Futures #JOLTS #DayTrading
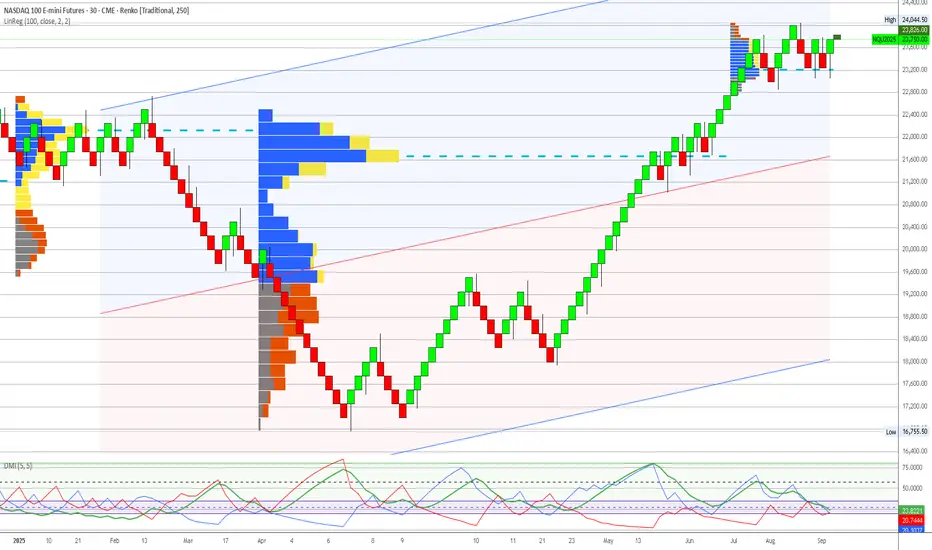
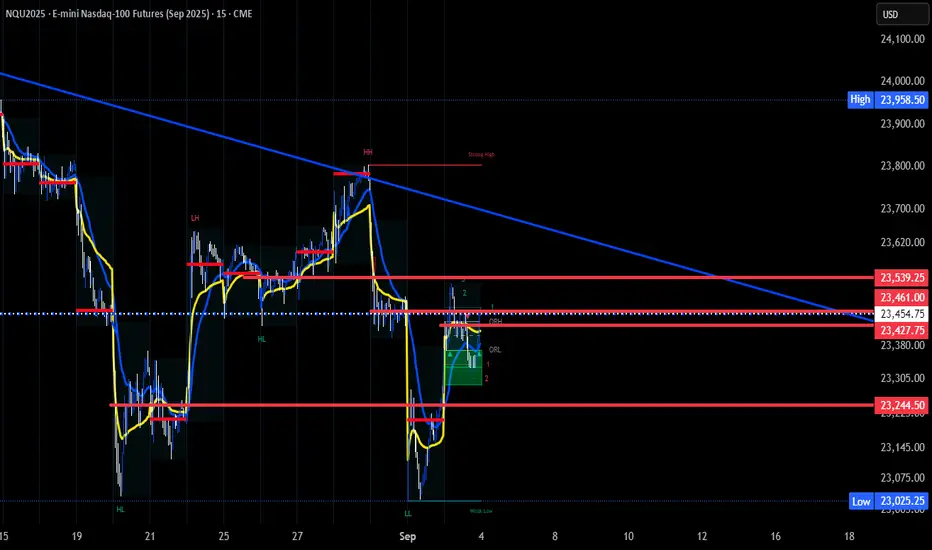
NQ HnS/Ranging Possible Head and shoulders pattern on the daily with right shoulder forming.
Price is sitting within the middle if the weekly range after rejecting the high of the range at 23,845.00.
Price is also consolidating within a triangle pattern. (Meaning a long term direction is yet determined.)
I expect price to break down to at least retest the low of the range and possibly the long term trend line that was previously reclaimed during April/May rally.
For added confluence Jeanius is displaying sideways movement in price for the daily and weekly charts. The month is still up.

NQ: 425th trading session - recapToday was alright, was a bit too tired and overstimulated, gotta change something tomorrow, definitely will...
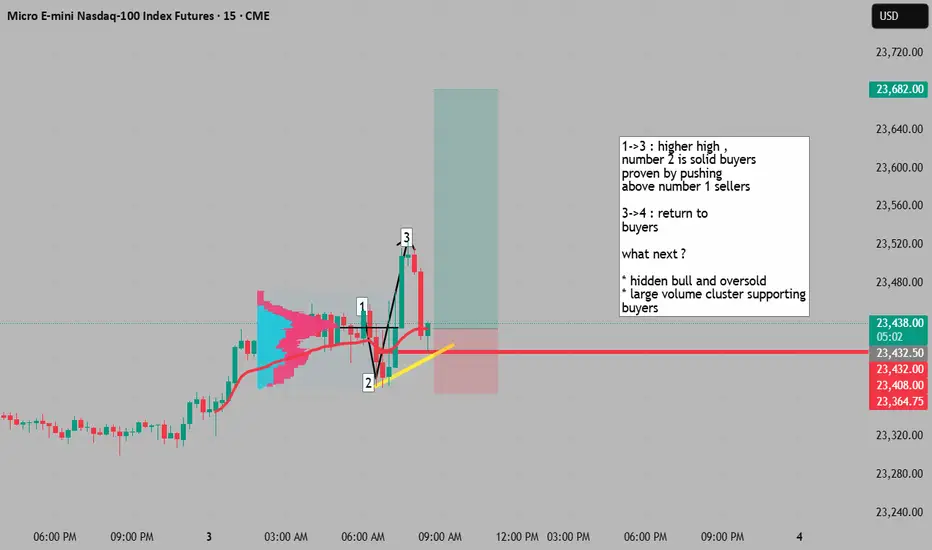
long opportunity with multiple confluences 1->3 : higher high ,
number 2 is solid buyers
proven by pushing
above number 1 sellers
3->4 : return to
buyers
what next ?
* hidden bull and oversold
* large volume cluster supporting
buyers
Targets above and below current price for US market open.Targets above and below current price for US market open.

NQ Power Range Report with FIB Ext - 9/3/2025 SessionCME_MINI:NQU2025
- PR High: 23387.75
- PR Low: 23335.25
- NZ Spread: 117.5
Key scheduled economic events:
10:00 | JOLTS Job Openings
Session Open Stats (As of 12:25 AM 9/3)
- Session Open ATR: 305.21
- Volume: 29K
- Open Int: 276K
- Trend Grade: Long
- From BA ATH: -2.4% (Rounded)
Key Levels (Rounded - Think of these as ranges)
- Long: 24382
- Mid: 23239
- Short: 22096
Keep in mind this is not speculation or a prediction. Only a report of the Power Range with Fib extensions for target hunting. Do your DD! You determine your risk tolerance. You are fully capable of making your own decisions.
BA: Back Adjusted
BuZ/BeZ: Bull Zone / Bear Zone
NZ: Neutral Zone
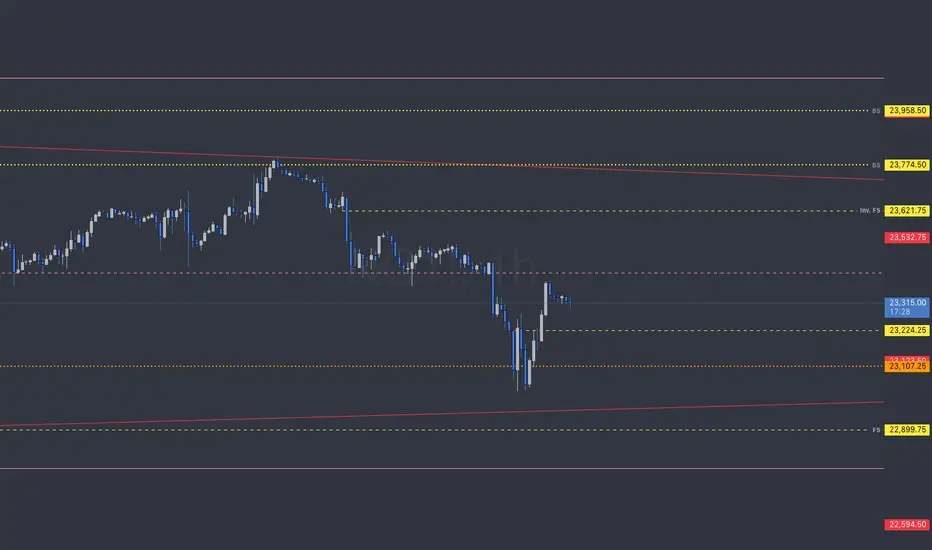
NQ = September There are 4 candles which create 6 levels.
3 levels are found in Distribution Ranges. The other 3 found in Accumulation ranges.
A Range is 2 or more consecutive candles of the same color.
The first distribution candle in the range is referred to as the "BackSide" candle. This is because is it behind the FrontSide candle.
We mark the top of this candle (wick or body) with the horizontal ray tool,
color it based on the timeframe color code, label it BS for BackSide,
select the line type then organize it's visibility based on timeframe to keep chart scrolling neat. *part of mental analysis and have a clean chart, clean mind, clean desk while in the zone.
The last distribution candle in a range is the "FrontSide" candle. It contains the last two levels. We mark the top of the candle (wick or body) with the horizontal ray tool, label it FS for FrontSide, color it based on the timeframe color code, select the line type and timeframe visibility.
The SwingLow is marked with a horizontal ray tool on the bottom of the FrontSide candle. Mark the wick, not the body. These levels I only mark with solid lines because the represent the boundary of the range.
Once price gets inside a range, it likes to bounce inside of it, testing its fractal ranges on other timeframes. Sometimes we'll see a 4hr level bounce to a 4hr level. Othertime's price stops after a 4hr level at 1hr level (plus 1, minus 1 theory) maybe we'll see it this month.
Happy September
BEARISH ON THE WEEKPrice inverted the bullish FVG so we will go lower for the week as predicted
look for shorts tomorrow. do not buy into the market all moves higher is a fake out.

9/2/25 Key Levels and Supply/Demand ZonesLink to chart: www.tradingview.com
Posting for the YT community fam.

Futures - Commodities / Financial: Nasdaq case (MNQ)+ Strong overnight support zone / ask increasing in volume at the zone. Contrarian trade.
Standard approach:
Applying A+ setup, volume profile (high volume nodes, low volume nodes day and intra-day and possibly extended to swing probability), smart money concept, numerical volume buy/sell side. trend confirmation, tick charts.

NQ - Sept 2, 2025 - 11AMWere moving lower. Trend lines broke, strong selling overnight.
FUNDAMENTALS: ISM manufacturing came out weak, employment weak but prices were also lower which is a good sign for inflation. Thursday we will get ISM-Non manufacturing data & Friday we will get Non-Farm Payrolls (NFP). This should let us know if we get a rate cut in September.
TECHNICALS: Trend lines all broke, were slowly grinding lower. NVIDIA has been seeing some profit taking since the last earnings a few days ago. Levels to watch in NQ! will be 23,000 and if we can break that, than 22,775.
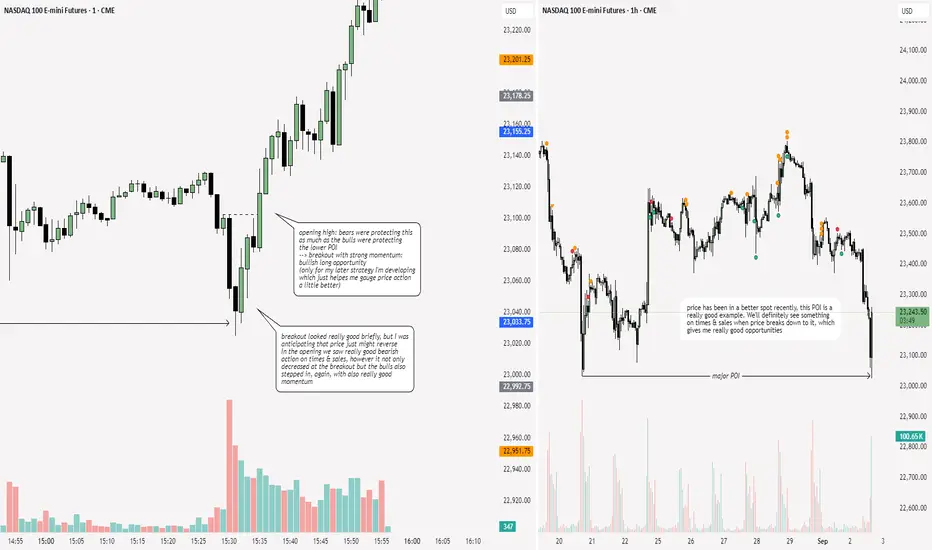
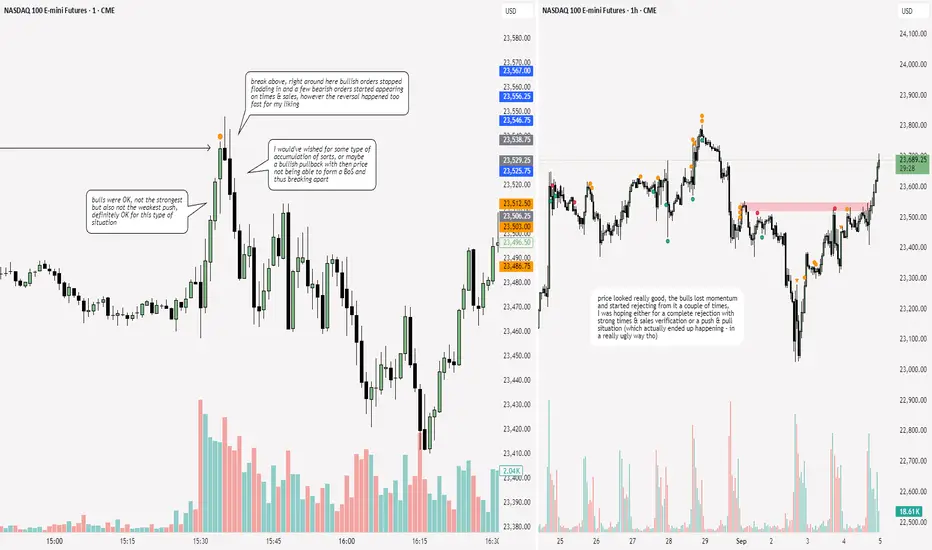
Good trading!

NQ: 424th trading session - recapGood day today, atleast price action wasn't ugly - it just was not on my side. But that's OK since I am developing something and overall just expanding my knowledge - also gotta focus on the bulls obviously, since when I trade bearish identifying bullish movement and understanding it as well as I do twith the bears could help me making better decisions