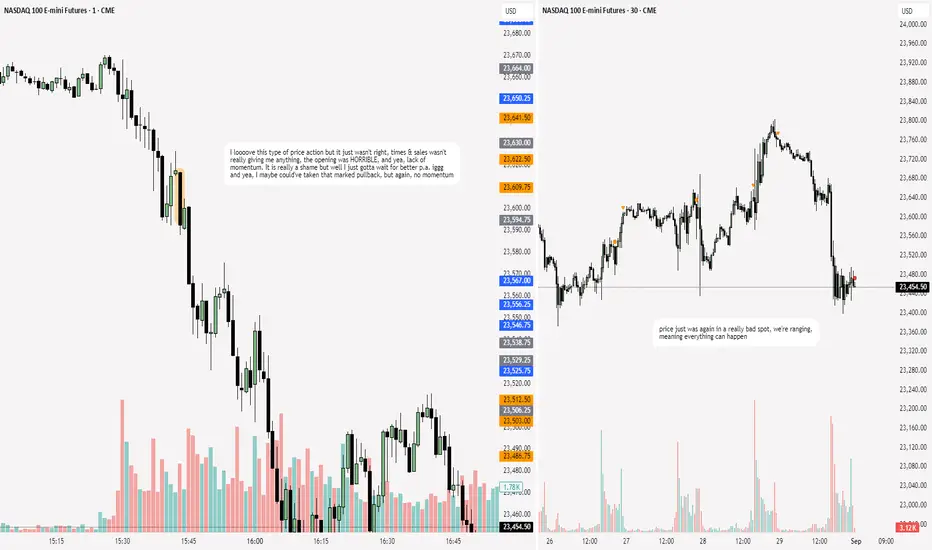
NQ: 243rd trading session - recapI gotta lock back in, summer holidays have me sooo locked out I can't describe it
NQ2! trade ideas
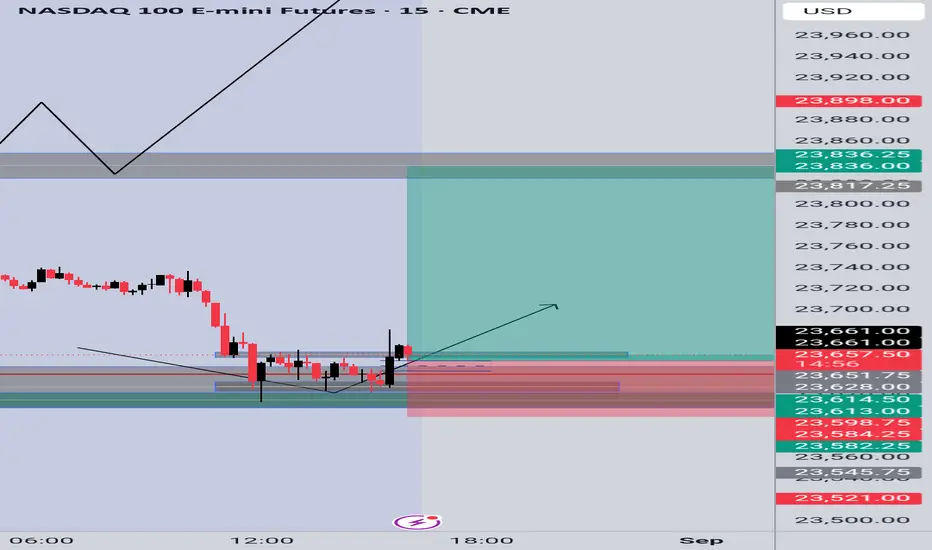
NASDAQ100 - Update As anticipated, price returned to key support. I've, added more on a retest of the demand zone. Patience pays.
NQ - August 29, 2025 - Before the openThe trend is your friend in my opinion. Dips keep being bought.
PCE came out inline with expectations this morning. We sold off overnight but I expect this to be bought back. Were waiting for employment data next week to see what happens with the FED.
Good trading!

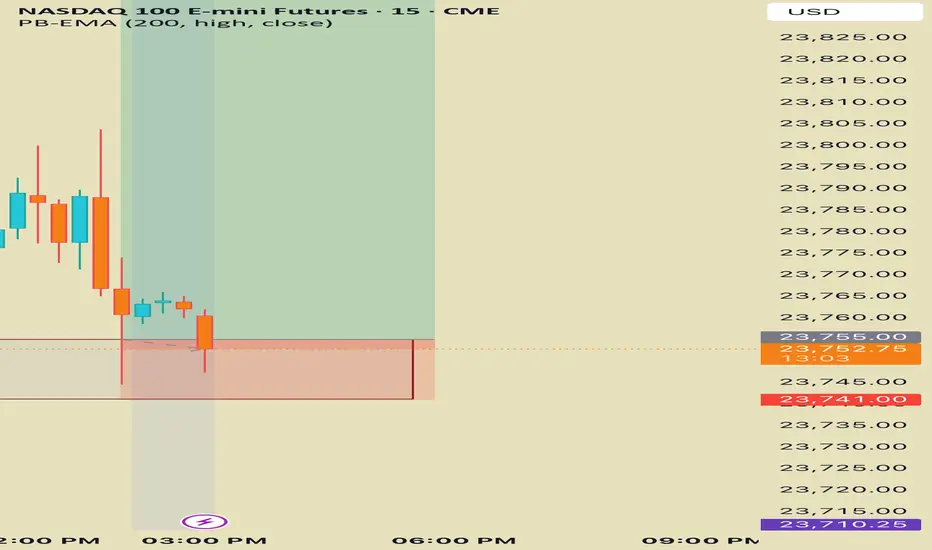
NQ Power Range Report with FIB Ext - 8/29/2025 Session (Correct)CME_MINI:NQU2025
- PR High: 23762.00
- PR Low: 23735.00
- NZ Spread: 60.5
Key scheduled economic events:
08:30 | Core PCE Price Index (YoY|MoM)
09:45 | Chicago PMI
Month end ahead of early close Monday
Session Open Stats (As of 12:45 AM 8/29)
- Session Open ATR: 283.13
- Volume: 16K
- Open Int: 286K
- Trend Grade: Long
- From BA ATH: -1.4% (Rounded)
Key Levels (Rounded - Think of these as ranges)
- Long: 24382
- Mid: 23239
- Short: 22096
Keep in mind this is not speculation or a prediction. Only a report of the Power Range with Fib extensions for target hunting. Do your DD! You determine your risk tolerance. You are fully capable of making your own decisions.
BA: Back Adjusted
BuZ/BeZ: Bull Zone / Bear Zone
NZ: Neutral Zone
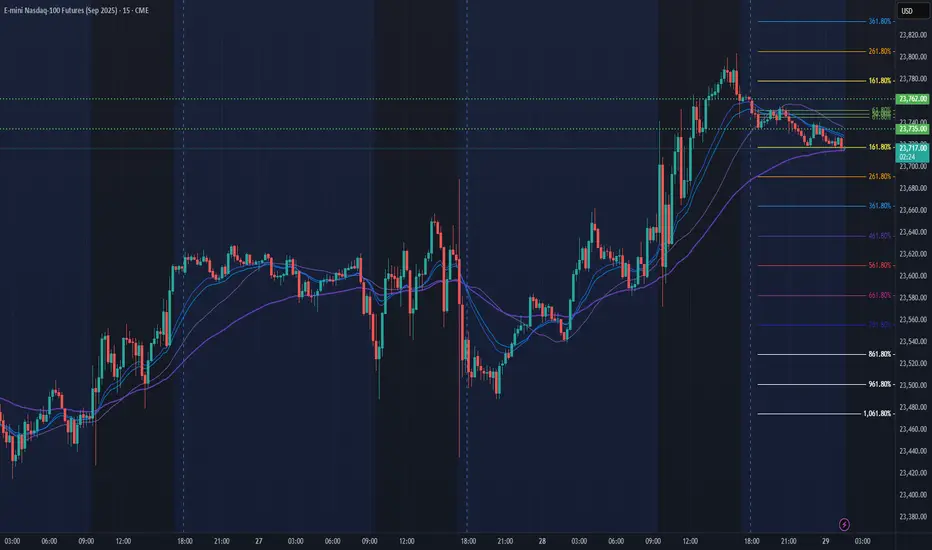
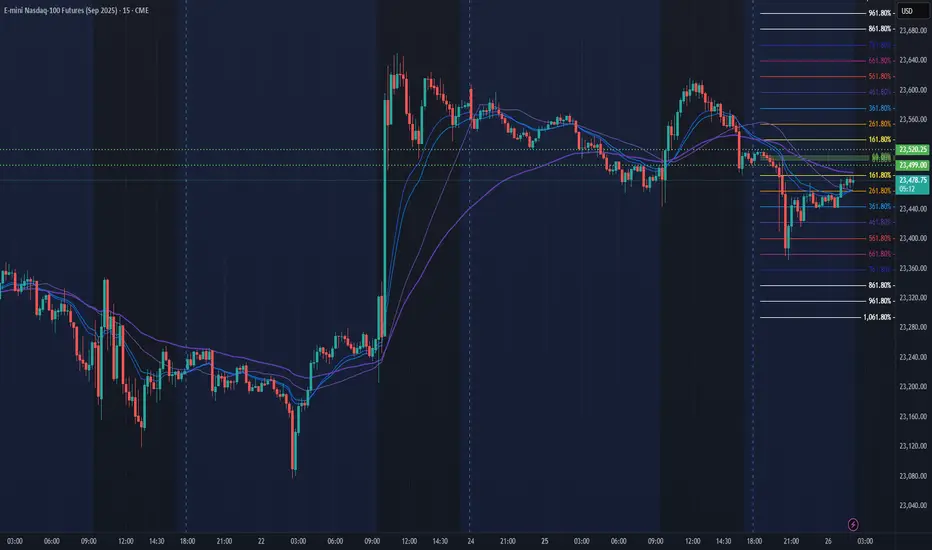
IFVG NQ LONGbullish bias here going into Asia / Tokyo session, Looking At the 15m and 5m FVG to get into a long position, slight EMA Bias NQ & ES keep ranging above the 15m 200ema, Predicting it respects the $23,843.00 price range and uses that as the draw to buy side liquidity (BSL)
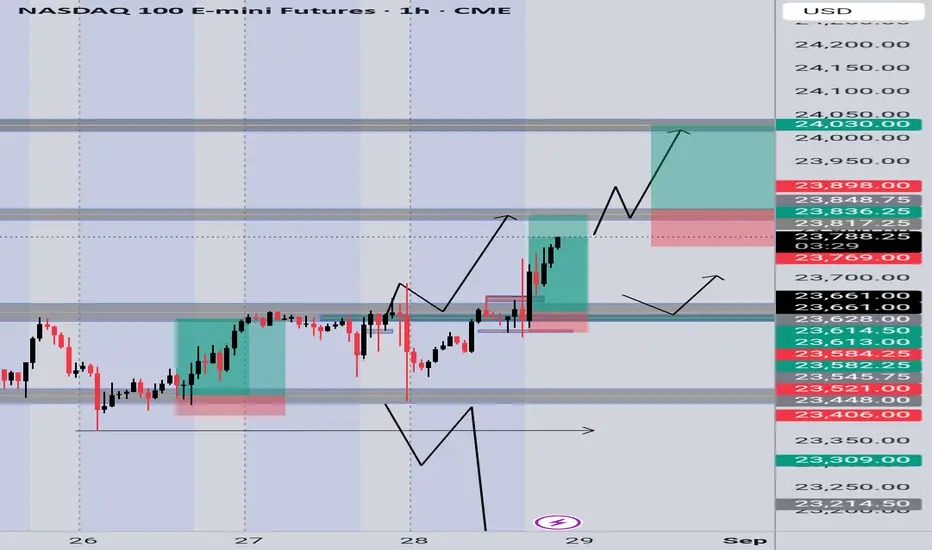
NASDAQ100 Update✅ Congratulations to everyone who caught the resistance breakout 🎉 – that level has now flipped into support 🔄.
📌 My plan:
Looking to buy more on continuation if we break higher 🔼
Or wait for a retest back to support to load more longs 💹
Bias remains bullish as long as support holds
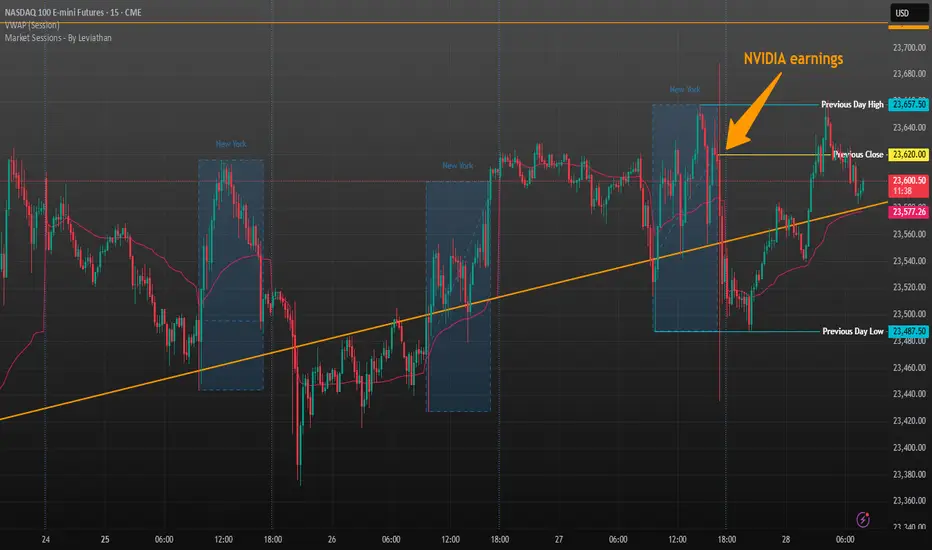
NQ - August 29, 2025 - Before the openYesterday after the close was NVIDIA earnings. Overall they were decent but the market didn't seem impressed. NVIDIA dipped a bit after the report.
Nasdaq still battling the long-term trend line as seen in the chart above.
Overnight it seems the dip was bought back. So far the theme seems to remain to buy the dip on Nasdaq and I believe it will remain this way until we get some inflation (PCE this Friday) & employment (NFP next Friday) numbers.
Good trading!
NQ Power Range Report with FIB Ext - 8/29/2025 SessionCME_MINI:NQU2025
- PR High: 23550.25
- PR Low: 23498.00
- NZ Spread: 116.75
Key scheduled economic events:
08:30 | Initial Jobless Claims
- GDP
Session Open Stats (As of 12:25 AM 8/29)
- Session Open ATR: 285.83
- Volume: 26K
- Open Int: 278K
- Trend Grade: Long
- From BA ATH: -2.1% (Rounded)
Key Levels (Rounded - Think of these as ranges)
- Long: 24382
- Mid: 23239
- Short: 22096
Keep in mind this is not speculation or a prediction. Only a report of the Power Range with Fib extensions for target hunting. Do your DD! You determine your risk tolerance. You are fully capable of making your own decisions.
BA: Back Adjusted
BuZ/BeZ: Bull Zone / Bear Zone
NZ: Neutral Zone
NQ - August 27, 2025 - After the closeMarket isn't loving the NVIDIA earnings. A bit odd considering the earnings weren't bad and they announced share buybacks.

Nq & Es After hours comment 27-08-2028 Good evening everyone,
As you can clearly see, the target has been achieved exactly as anticipated. Price dipped slightly, then provided solid long opportunities, and afterward rallied strongly to the upside.
See you all tomorrow here, shortly before the market open, for the daily outlook.
Wishing you a good evening.
⚠️ Disclaimer: This analysis reflects personal market observations and is for educational purposes only. It does not constitute financial advice.

Nq & Es Premarket Comment 27-08-2025Good morning everyone,
My overall bias remains bullish, and I will once again be looking for long opportunities, with the main target being the high I have highlighted on the chart.
We are currently in a premium zone, which means price may seek lower levels before continuing higher. If that happens, it could offer fresh opportunities to re-enter long positions. However, there is also the possibility that price may simply continue its upward rally without a deeper pullback.
Personally, I prefer to wait for the market open at 09:30 NY time and observe the initial reaction before making any trading decisions.
Despite intraday fluctuations, my broader expectation is for both indices to eventually push above their ATHs.
Wishing everyone a successful trading session.
⚠️ Disclaimer: This analysis reflects personal market observations and is for educational purposes only. It does not constitute financial advice.

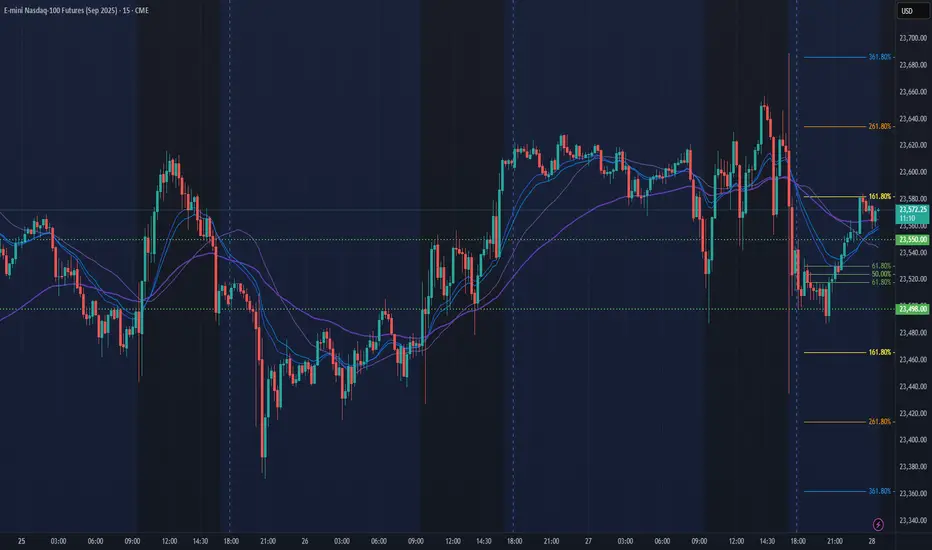
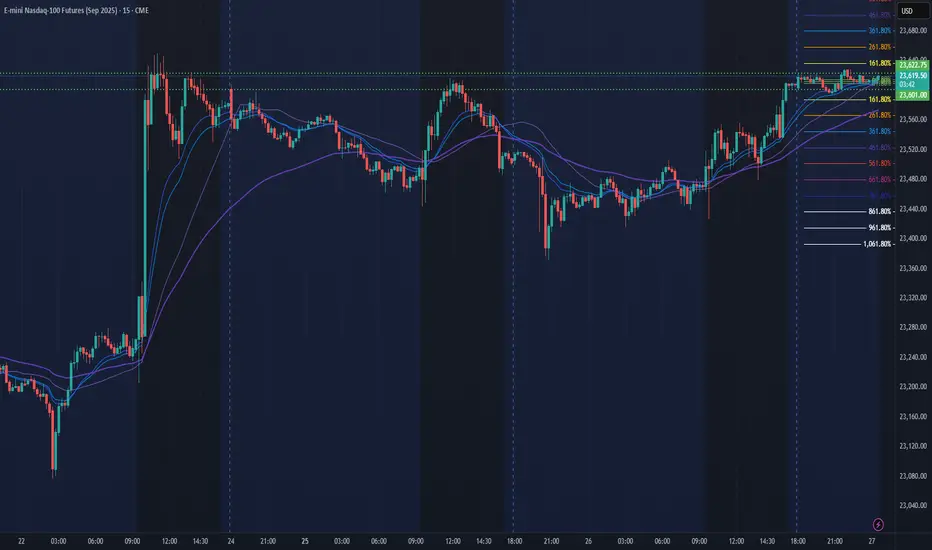
NQ - August 27 - afternoonSince the Powell speech and rally on Friday the 22nd, the easier trade has remained to buy dips.
As we can see in image above we had broke below the longterm trendline and Friday brought us back above it.
And though we drifted below the trendline during the overnight session Monday, we've held above it and its been bought during the NY session everyday since, as seen below.
AFTER THE CLOSE: We have Nvidia earnings which will important for tomorrows trading session.
ECONOMIC CALENDAR: We have GDP tomorrow as well as PCE and Michigan consumer sentiment on Friday. I dont thing GDP will be very market moving but PCE will be quite important for inflation data, as that is what the FED uses. If Inflation is lower than expected and with Powell's most recent comments, its fair to assume a cut in September will be fully baked in.
Good trading! Wishing you all green PnL's :)

NASDAQ 100 TYRING TO CARVE OUR HEAD AND SHOULDERS TOP? Hey traders so today looking at Nasdaq 100 looking like it's trying to form a top. More importantly a Head & Shoulders Top.
For those new to trading and understanding technical analysis I highly recommend you learn chart formations like Head & Shoulders.
Technical Analysis is a little bit like art what one trader sees not all other traders will see. However if alot of traders see it then it is becoming more significant.
So basically you have a left shoulder formed at top of rally 23,847. Then you have head or highest peak formed at 24,100. Then you have a neckline formed at 22,758. Finally you have the right shoulder which has not been completed yet. If you read about the Head & Shoulders it normally has a 90% probability or being accurate.
So is the market topping out?
No one knows for sure but we do know that historically September and October are the worst months of the year seasonally for the stock market. This definetly shows that the bearish case is stronger.
Scenario Time
Bullish- knowing that seasonally the market could weaken in September and we are right around the corner I would say wait for the sell off and buy back in November.
Bearish- The way you trade the Head & Shoulders pattern is if the right shoulder completes then you wait for the market to break below the neckline under 22,775 and then place your sell order. Then you place a stop above the right shoulder after if forms.
COT- Commitment of Traders report still showing the funds are holding Long Positions and even somewhat crowded on the long side. But last week they closed some of them could this be a bearish sign closing long positions? Most likely yes but lets see what happens in tommorows report.
Good Luck & Always use Risk Management!
(Just in we are wrong in our analysis most experts recommend never to risk more than 2% of your account equity on any given trade.)
Hope This Helps Your Trading 😃
Clifford
RISK DISCLOSURE
TRADING IN THE FUTURES AND FOREX MARKET INVOLVES SIGNIFICANT RISK. ALWAYS CONSULT A FINANCIAL ADVISOR AS HIGH RISK ASSET CLASSES MAY NOT BE SUITABLE FOR ALL INVESTORS. THIS IS NOT A RECOMMENDATION TO BUY OR SELL ANY ASSETS. ALL IDEAS ARE MADE FOR EDUCATIONAL PURPOSES. PAST PERFORMANCE DOES NOT GUARANTEE FUTURE RESULTS.
CFTC RULE 4.41 – HYPOTHETICAL OR SIMULATED PERFORMANCE RESULTS HAVE CERTAIN LIMITATIONS. UNLIKE AN ACTUAL PERFORMANCE RECORD, SIMULATED RESULTS DO NOT REPRESENT ACTUAL TRADING.

US30- SetupWatching breakout of key zone 23646.25 – 23607.00. If confirmed, price may push towards targets at 23849.00 and 23824.75.

NQ Power Range Report with FIB Ext - 8/28/2025 SessionCME_MINI:NQU2025
- PR High: 23622.75
- PR Low: 23601.25
- NZ Spread: 48.0
No key scheduled economic events
Session Open Stats (As of 12:25 AM 8/28)
- Session Open ATR: 284.71
- Volume: 15K
- Open Int: 280K
- Trend Grade: Long
- From BA ATH: -1.8% (Rounded)
Key Levels (Rounded - Think of these as ranges)
- Long: 24382
- Mid: 23239
- Short: 22096
Keep in mind this is not speculation or a prediction. Only a report of the Power Range with Fib extensions for target hunting. Do your DD! You determine your risk tolerance. You are fully capable of making your own decisions.
BA: Back Adjusted
BuZ/BeZ: Bull Zone / Bear Zone
NZ: Neutral Zone
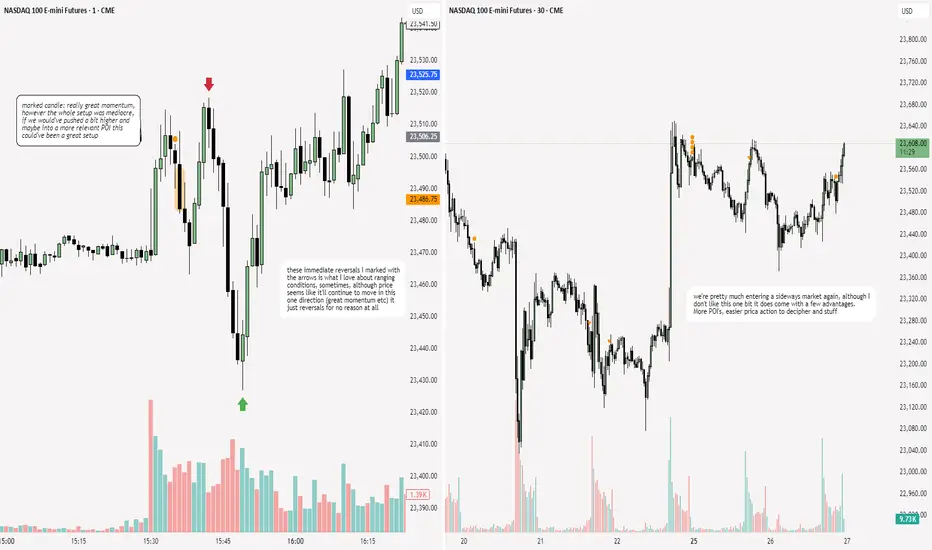
26 August 2025Reasons why you should not trade no news day or trade with low size.
Couple of clean setups at 9:30 but price was very choppy after that.

NQ: 240th trading session - recapBetter session today, I was focused etc. Also got my grip and my plan back on route.
This just needs to get better and better now for the next few months

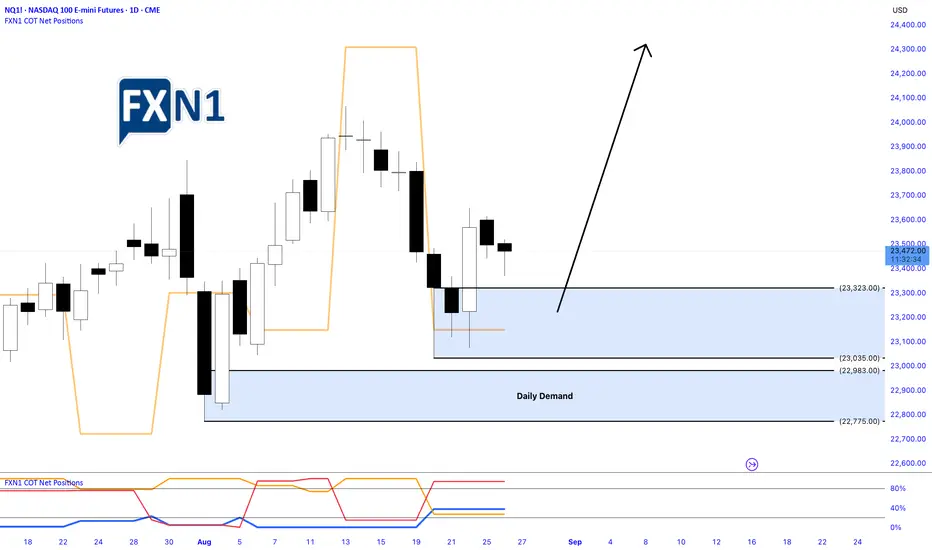
Nasdaq Pulls Back After Friday’s Rally: Identifying Demand ZoneYesterday, the Nasdaq underwent a pullback following a robust bullish surge on Friday. During this correction, a fresh Daily Demand Zone emerged on the chart, signaling potential support levels. Traders are now eyeing this area as an opportunity to position for a possible new high, should the market retrace further today. The current outlook favors a long setup, with anticipation of a continued upward move contingent on the price respecting the identified demand zone.
✅ Please share your thoughts about NQ1! in the comments section below and HIT LIKE if you appreciate my analysis. Don't forget to FOLLOW ME; you will help us a lot with this small contribution.
NQ Power Range Report with FIB Ext - 8/27/2025 SessionCME_MINI:NQU2025
- PR High: 23520.25
- PR Low: 23499.00
- NZ Spread: 47.75
Key scheduled economic events:
08:30 | Durable Goods Orders
10:00 | CB Consumer Confidence
Session Open Stats (As of 12:25 AM 8/27)
- Session Open ATR: 297.44
- Volume: 43K
- Open Int: 281K
- Trend Grade: Long
- From BA ATH: -2.6% (Rounded)
Key Levels (Rounded - Think of these as ranges)
- Long: 24382
- Mid: 23239
- Short: 22096
Keep in mind this is not speculation or a prediction. Only a report of the Power Range with Fib extensions for target hunting. Do your DD! You determine your risk tolerance. You are fully capable of making your own decisions.
BA: Back Adjusted
BuZ/BeZ: Bull Zone / Bear Zone
NZ: Neutral Zone
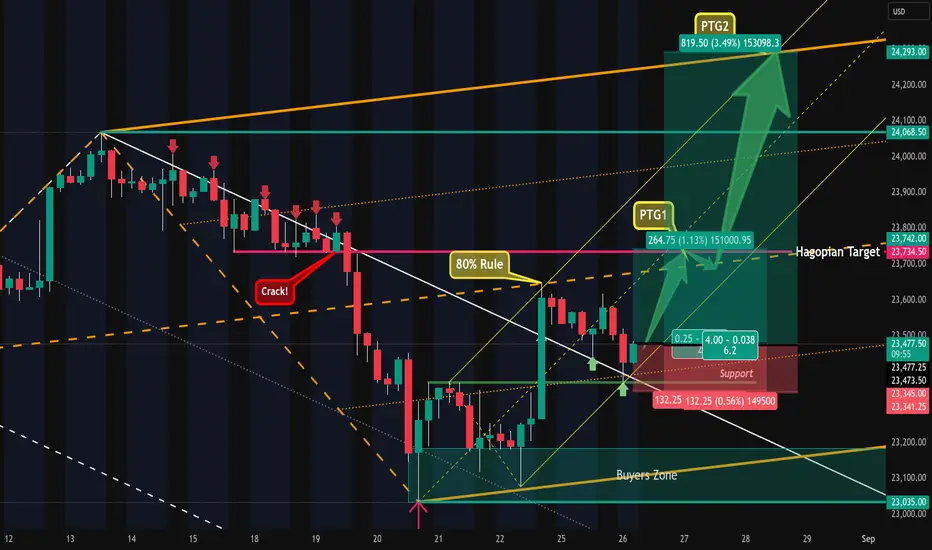
Nasdaq - Intraday Setup & Potential TradePrice was not abel to trade out of the white forks U-MLH and got constantly rejected.
It cracked the little support and fell down, but missed the white Centerline, creating a HAGOPIAN.
Then price traded outside of the white fork, following a textbook test/retest at the white U-MLH and found support.
The yellow fork points upwards, showing us the most probable path of price.
Going long near the white U-MLH gives us several potential targets:
1. the orange Centerline
2 the yellow Centerline
3. the HAGOPIAN target line.
4. the orange U-MLH
Stops would be below the last red bars low, because this, as of the time of writing, is the best structural level to hide behind.
I'm off to the mountains, have a happy trading day!
NQ Plan (A++) — Tue, Aug 26. Analyses and Setups At-a-glance
• Structure: Daily uptrend but capped below 23,585–23,615 supply; late-day dump then bounce.
• Pivot: ~23,50x shelf (intraday pivot).
• Plan: Acceptance Long above PDH (≥23,59x) OR Rejection Short on break ≤23,50x after a pop/fail.
Macro clock (ET)
• 8:30 — Durable Goods (Advance, Jul).
• 9:00 — S&P CoreLogic Case-Shiller (Jun).
• 10:00 — Conference Board Consumer Confidence (Aug).
• 11:30 — Dallas Fed Texas Service Sector Survey (publishing begins 9:30 a.m. CT).
• Afternoon — U.S. Treasury 2-Year Note auction (verify time live; typically 1:00 p.m. ET).
• Heads-up — NVDA earnings Wed, Aug 27 after the close.
HTF context
• Daily/4H: Buyers defend 23,44x → 23,41x; sellers active 23,585–23,615.
• 1H/30M: Sideways; 23,50x is the shelf to watch.
Key levels
• Resistance: R1 23,585–23,615 (PDH/supply); R2 23,650–23,680.
• Support: S1 23,485–23,505 (shelf/NYPM.L); S2 23,440–23,455; S3 23,405–23,415 (AS.L); S4 23,295–23,315 (Mon low area).
A) Acceptance Long (A++)
• Trigger: First 5-min close ≥23,590–23,600 with 15-min holding/printing HH.
• Targets: 23,650 → 23,680/23,700.
• Invalidation: Hard — 15-min close ≤23,580; Soft — no extension within 2×5-min bars.
B) Rejection Short (A++)
• Trigger: Rejection from 23,52x–23,56x then first 5-min close ≤23,498–23,505 (shelf break) with 15-min alignment.
• Targets: 23,455 → 23,410 → 23,305.
• Invalidation: Hard — 15-min close back above ~23,505; Soft — no extension within 2×5-min bars.
Execution rules (A++)
• MOS entry on confirming close; no retest required.
• Align 30m/15m/5m; go BE only after structure/through T1.
• Trade windows: 9:45–11:30 & 13:45–15:30 ET.
• Stand down if price chops inside 23,49x–23,56x without a decisive close.
Disqualifiers
• Trend conflict across 30m/15m/5m
• No 5-min confirming close
• Directly into 10:00 data or the afternoon auction
• Chop inside the pivot box

Nq & Es After hours comment 25-08-2025Good evening everyone,
As you noticed, price did not reach the lower levels we were anticipating, and therefore no valid long opportunities were triggered. This was always a possible outcome, and it simply means that we missed a trade — something that is part of everyday trading.
I had mentioned that I was expecting a temporary move down, but at no point did I suggest looking for short opportunities. The reason is exactly what we saw today: price did not need to drop significantly before moving higher.
For tomorrow, there is still a chance of a temporary decline before the market continues to push upward.
See you here again tomorrow, before the market open.
⚠️ Disclaimer: This analysis reflects personal market observations and is for educational purposes only. It does not constitute financial advice.
