Chart Mark-ups for tomorrow.I already know what Im looking for tomorrow morning. I hit my daily profit and now this is my chart set up for tomorrow morning. this is just showing you all how I trade and what I see in the market.
Trade ideas

Analysis every day on Nq $ EsHello everyone,
I’m offering a daily market analysis service featuring key technical levels, scenario-based strategies, and actionable trading plans for each potential setup that may unfold during the upcoming session — starting at 09:30 AM New York time.
Every morning, you’ll receive a concise daily bias outlook, technical insights, and trader psychology tips, designed to help you maintain consistency and discipline in your trading approach.
Stay tuned to the channel and bring structure and clarity to your daily analysis.
A new market commentary — complete with all the above elements clearly marked on the chart — will be posted 45 minutes before the market opens.
Additionally, a post-session review will follow after the close, evaluating what actually occurred during the trading day and assessing how accurately our scenarios played out.
Get ready to be surprised.
PF

All Time High in the crosshair...again1. Weekly Lows hit;
2. Repricing below Weekly Open and Monthly Open;
3. Large Displacement on the upside confirming reversal;
4. Monday's high, Daily FVG and ultimately ATH relative equal highs in the crosshair for the upcoming days/weeks (that is bullish bias until proven otherwise);

14 oct push down nasdaqas seen in the video.
we are going short.
dominant force of the day in short.
entry in blue.
stop in red
targets in green
Have fun
Elektra

A Pawn for a King: More DetailsHe fears that he failed at explaining this strategy in a crystal-clear manner the first time. So, he will attempt to explain it more carefully, more precisely. Any confusion is not the fault of the reader. It is the fault of the author.
He starts this at a bounce on a good strong support. This is a bull market strategy (plan), so it begins with a bto entry. What makes this plan work is that it is done in pairs. The pairs must be in a 1 to 2 ratio.
For example, let's say we just had a bounce on a strong support and we begin A Pawn for a King ladder. We just had such a bounce. So, he started a new ladder. Here it is.
NQ+1 @ 24820.50; fx:24820.75 @ 01:08:52///NQ-1 @ 24820.00; @ 01:08:43; -33.20
NQ+1 @ 24820.50; fx:24820.75 @ 01:08:52///NQ-1 @ 24842.00 @ 02:05:37; +406.80
NQ+1 @ 24842.50; fx: 24843.00 @ 02:05:37///NQ-1 @ 24842.00 @ 02:05:37; -38.20
NQ+1 @ 24842.50; fx: 24843.00 @ 02:05:37///NQ-1 @ 24864.00 @ 03:01:02; +401.80
NQ+1 @ 24864.50; fx: 24865.00 @ 03:01:02///NQ-1 @ 24864.00 @ 03:01:02; -38.20
NQ+1 @ 24864.50; fx: 24865.00 @ 03:01:02///NQ-1 @ 24886.00 @ 03:12:41; +401.80
NQ+1 @ 24886.50; fx: 24886.50 @ 03:12:41///NQ-1 @ 24886.00 @ 03:12:41; -28.20
NQ+1 @ 24886.50; fx: 24886.50 @ 03:12:41///NQ-1 @ 24908.00 @ 03:22:46; +411.80
NQ+1 @ 24908.50; fx: 24908.75 @ 03:23:07///NQ-1 @ 24908.00 @ 03:22:46; -33.20
NQ+1 @ 24908.50; fx: 24908.75 @ 03:23:07///NQ-1 @ 24930.00 @ 03:28:28; +406.80
NQ+1 @ 24930.50; fx: 24930.75 @ 03:28:30///NQ-1 @ 24930.00 @ 03:28:28; -33.20
NQ+1 @ 24930.50; fx: 24930.75 @ 03:28:30///NQ-1 @ 24952.00 @ 12:58:08; +406.80
NQ+1 @ 24952.50; fx: 24952.50 @ 12:58:08///NQ-1 @ 24952.00 @ 12:58:08; -28.20
NQ+1 @ 24952.50; fx: 24952.50 @ 12:58:08
That first line is highlighted in his ledger. This is the Pawn that he sacrifices to capture the King.
He subtracts 200 points from that entry and sets an alert on his chart. If / when that alert is triggered, he waits for a good bounce on a strong support and starts the process all over again.
He will buy 2 NQs and sell 1 NQ $.50 less. He will also buy back that first Pawn, the one he sold on the first line - -1NQ @ 24820.00. Going forward he now buys 3NQs and he sells 3NQs on the same ladder as above i.e. every 22 points he buys 3NQs and $.50 less he sells 3 NQs.
Anytime is a good time to paper trade this plan. Now is not an ideal time to start trading this plan with real $$$. The best time to start is at the beginning of a new quarter.
It is a very simple plan, but it does take a little time to get proficient.
It is a very powerful plan. It doesn't take long for it to become a locomotive any engineer would be proud of.
The fellow hopes he didn't make any typos. It is very tedious typing out all those numbers and all too easy to err.
He also hopes this makes the plan crystal clear. He apologizes if his first publication was not.

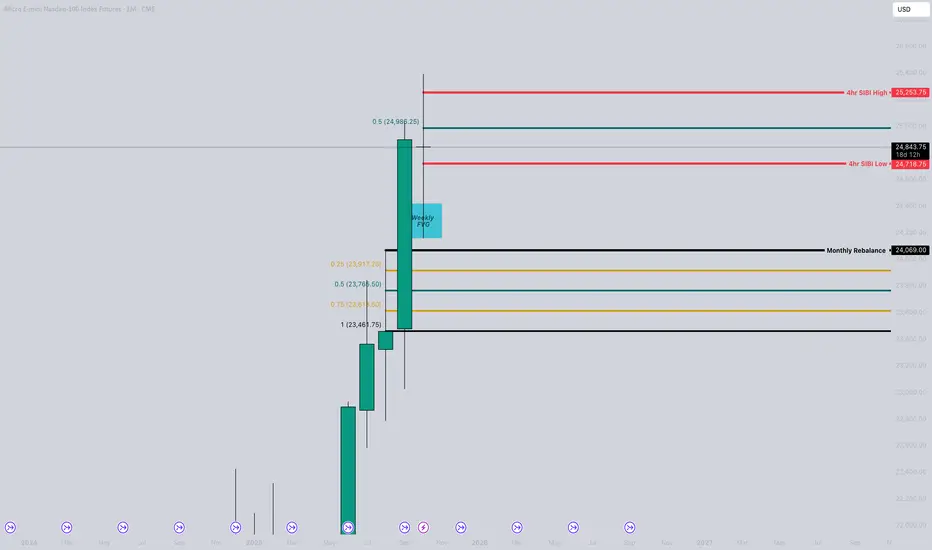
Could we see another drop before price starts to rise again?Price is currently resting inside a 4hr bearish FVG and I also have the 50% range of that 4hr imbalance in the dark green line. Aware of the completely filled weekly FVG that price is currently above and expecting for price to climb even lower below and leave a immediate rebalance on the monthly timeframe. Below that is the quadrant levels for previous months wick which would be from August price action. Those are levels that I would consider high probable to retrace to continue higher.
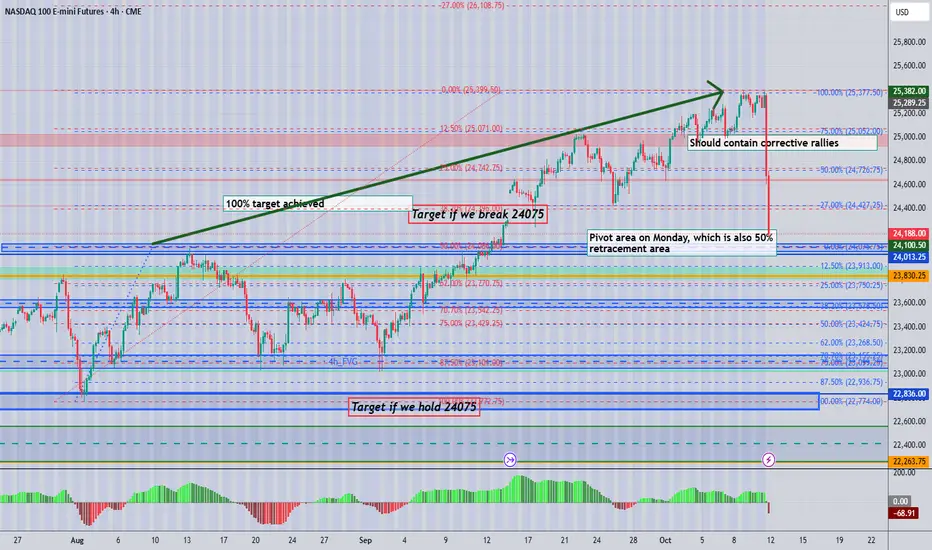
Key levels for reversals back to the upsideI’ve marked key levels where I believe the market could potentially reverse to the upside, allowing the bull run to resume. Of course, fundamentals and news can quickly change the market’s direction, but this represents my current technical analysis that I’ll be monitoring closely.
Weekly engulfing candle A Trump tariff announcement produced a huge engulfing candle, lets see what happens this week?
Trump's form is he always undo's his threats pretty quickly so be careful, but this market was over stretched and crying for a correction.
Is this enough?
will the buy the dip buyers return?
Earnings season is here and
we have interest rate cuts looming ...
So volatility is here for a while
be careful out there

MASSIVE CORRECTION IN PLAY This is my analysis for next week the Top on NQ is finally placed and once we close below the previous weeks low today. Shorts is the play next week aiming for all daily lows and old SIBI
Not financial advice just my opinion :)

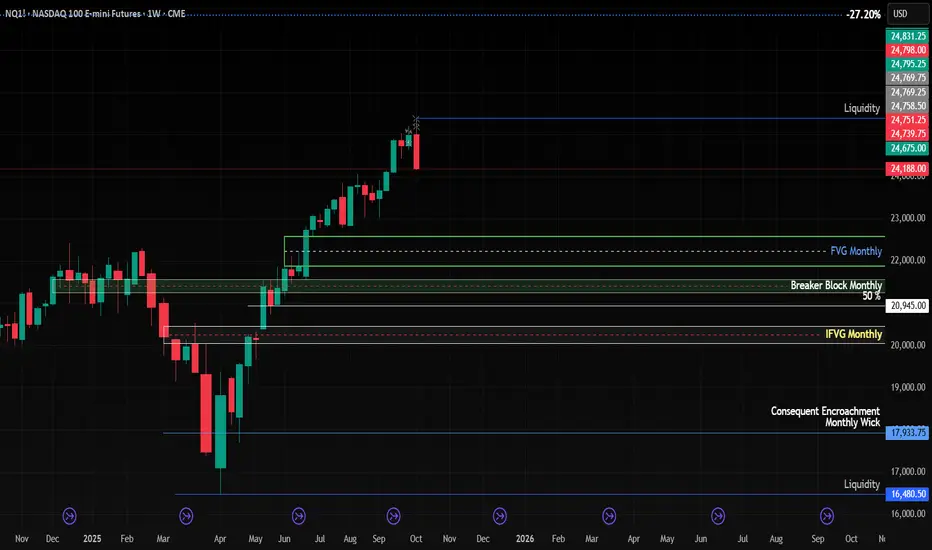
Bullish MONDAY Price dipped into the long term weekly FVG
And respected it now. My thoughts are Monday could be a bullish day where price start to rally back up because we are in a very deep discount right now and have lots of range to cover so I think we could see some upside objectives.
also if we open and Gap down then there’s a big change we continue lower but I hope that is not the case because it would become a full on market crash. this is a minor correction nothing major

Liquidity Sweep on 4H TF know to mark out all the session highs and lows, the one-hour highs and lows, and the four-hour highs and lows, and then wait for a liquidity sweep, then wait for a break of structure, inverse fair value gap, or a 79% extension closure? And then following that, look for a fair value gap getting filled, order block, breaker block, equilibrium getting filled, and then scale down to the one-minute time frame, look for a break of structure, inverse fair value gap, or 79% extension closure, looking for the trend to continue in the right direction, and then take profits at the previous draws on liquidity that haven't been hit yet

Could we potentially have another bearish day? We have no real market structure shift on the higher timeframe, and there are still plenty of PD arrays below that remain unvisited. Yesterday’s daily candle was also bearish!

LONG 1HOUR CHART - SL LOCAL LOWEntry long for 100 pips ... lets see.
SL LOCAL LOW
TP LOCAL TOP
SLM TRAILING

NQ Power Range Report with FIB Ext - 10/23/2025 SessionCME_MINI:NQZ2025
- PR High: 25059.50
- PR Low: 25000.25
- NZ Spread: 132.25
Key scheduled economic events:
08:30 | Initial Jobless Claims
10:00 | Existing Home Sales
Session Open Stats (As of 12:15 AM)
- Session Open ATR: 396.82
- Volume: 31K
- Open Int: 281K
- Trend Grade: Long
- From BA ATH: -1.1% (Rounded)
Key Levels (Rounded - Think of these as ranges)
- Long: 26020
- Mid: 23571
- Short: 21939
Keep in mind this is not speculation or a prediction. Only a report of the Power Range with Fib extensions for target hunting. Do your DD! You determine your risk tolerance. You are fully capable of making your own decisions.
BA: Back Adjusted
BuZ/BeZ: Bull Zone / Bear Zone
NZ: Neutral Zone

Forty Thousand Foot ViewCharles Payne recently said his favorite pattern is a Cup & Handle pattern. His guest agreed.
I use a chart like this to get the big picture. I want to emphasize several things.
1.Cup 1 is huge. It said, "Here is a foundation for building upon." You can see how it has fulfilled that bold statement and how strongly it has held fast.
2.Cups 2 & 3 are upside down, cup 3 higher than cup 2. These two cups are saying, "Things are going higher."
3.Cup 4, which is still forming, is saying, "Look here. We are building a new dance stage similar to Cup 1's dance stage and a whole lot of partying is going to happen when it is completed."
4.This is the most important takeaway for you. One Thousand ninety-three points separate the rims of cup 1 and cup 4. With the trading plans I have detailed in prior posts I have traded that 1,093 points many times over and so can you.
From 9/2 - 10/20 using these plans I grew my account by 44.7%. I'm not at all saying look how great I am. I am saying look what you can do.
Finding a trading plan that works is vital to success. It took me years and thousands and thousands of demo trades and live trades trying to replicate the trade ideas of others that I got from many and varied sources. The results were ever so disappointing.
One day I said, "Sidgate, you are a fellow of Common Sense. I challenge you to create a trading plan that works."
I took him up on that challenge and I share those results with you.
What's the catch? There has to be a hook here somewhere...
As corny as it may sound - it is indeed more blessed to give than to receive. I have found that as I have shared these plans and charts with you my trading results have improved. I don't think that would have happened had I not spent so many hours examining every little detail of my charts and trading plans in order to clearly communicate them to you.
I know I've made typos and simple math errors along the way. When I go back and see them, I cringe. Hopefully, you can learn despite those cringeworthy events.
Again, this is a 40,000-foot view. A very important view. For all entries and exits I use a 5-minute chart and 5-minute cups & handles. The 5-minute chart sure can get busy. I am very thankful Trading View gives us the option to hide drawings.
Just a little aside - today's low, the place where it bounced, was almost exactly on one of the handles of a 5-minute cup.
I am still a work in progress...

DEMO TRADE + REASONING AND EXCECUTION DEMO TRADE + REASONING AND EXCECUTION, My pre market analysis and trade excecution.

Target areas - NQ price for Market open.10/22/25 - These are the target areas - NQ price for Market open depending if price moves up or down. Will look for trades into these areas.

NQ Red boxes are the last 3 days
then I marked the 4hr trends and levels in orange before the 1hr levels in yellow.
I finished off with 15min blue levels and 1 green 5min level cause it was so clear and backed by 4hr trends.
The last 15min support level looks too good to pass up. I wonder when it will be visited.

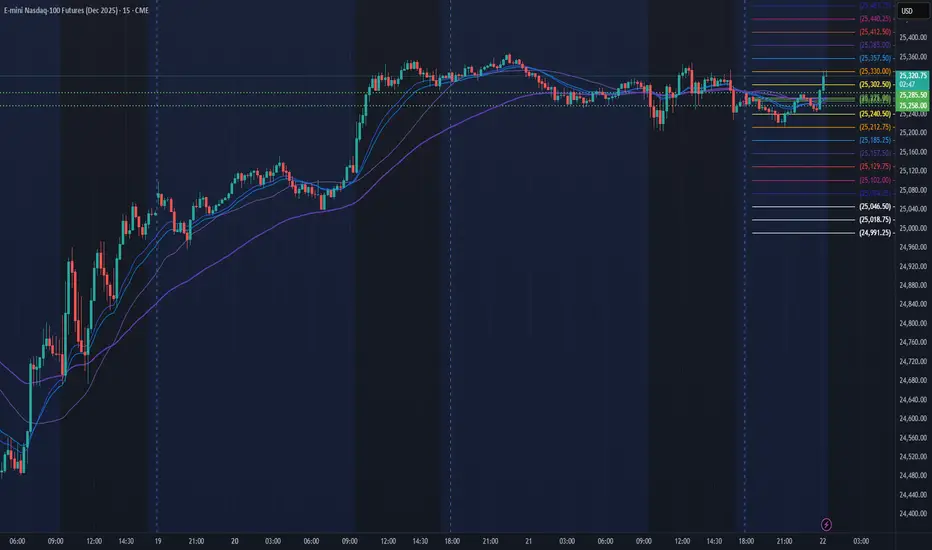
ATH RANGE TRADINGTODAYPlanning to trade the local range today, buy low sell high, it can be this easy. With luck it will break the pendant in the direction i am holding for the higher time frame trade.
Hopium is we rotate several more times in this range for distribution with a final big push up to squeeze shorts.

NQ Power Range Report with FIB Ext - 10/22/2025 SessionCME_MINI:NQZ2025
- PR High: 25285.50
- PR Low: 25257.75
- NZ Spread: 62.25
No key scheduled economic events
Quick dip and rotation back towards ATH
Session Open Stats (As of 12:15 AM)
- Session Open ATR: 385.15
- Volume: 24K
- Open Int: 290K
- Trend Grade: Long
- From BA ATH: -0.2% (Rounded)
Key Levels (Rounded - Think of these as ranges)
- Long: 26020
- Mid: 23571
- Short: 21939
Keep in mind this is not speculation or a prediction. Only a report of the Power Range with Fib extensions for target hunting. Do your DD! You determine your risk tolerance. You are fully capable of making your own decisions.
BA: Back Adjusted
BuZ/BeZ: Bull Zone / Bear Zone
NZ: Neutral Zone
Nasdaq reversal @ the VWAPWatched for the 9 EMA and 21 EMA on the 5 min chart cross(x) and also crossed the VWAP. Once I saw this, I was bullish for the next 30 min. Made $3,000 :)

NQ UpdateMFI heading down but RSI is not. That's a sign of a melt up.
Really odd with that huge gap below. NFLX earnings don't mean much to futures aside from being 2.77% of the index. 5% drop for 2.77% of the index is 35 points. NQ is down 37 pts right now.
Market needs big news to drop. Not sure I see anything on the horizon until Trump talks to China next week. We'll see tomorrow.
Also, gap direction depends on what Europe does, not NFLX.
