NQ Open GapFutures gapped up on election results in Japan (see Nikkei, wow), expecting gap to fill sooner than later. Guessing it's gonna be a whipsaw next day or two.
MFI almost oversold as well.
Trade ideas

Another Sell on MNQYou can see the ENTRY< SL AND TP level on the right side of the chart, I pointed with a arrow
With some time, I will figure out the best way to post these
2 trades in this pic

Sell on MNQThis one is lined up really good for a sell. Each of these ideas I have a 1:3 TP but they all have potential to go much further than that.
Calculate your position in advance so you can make the most of the trades!

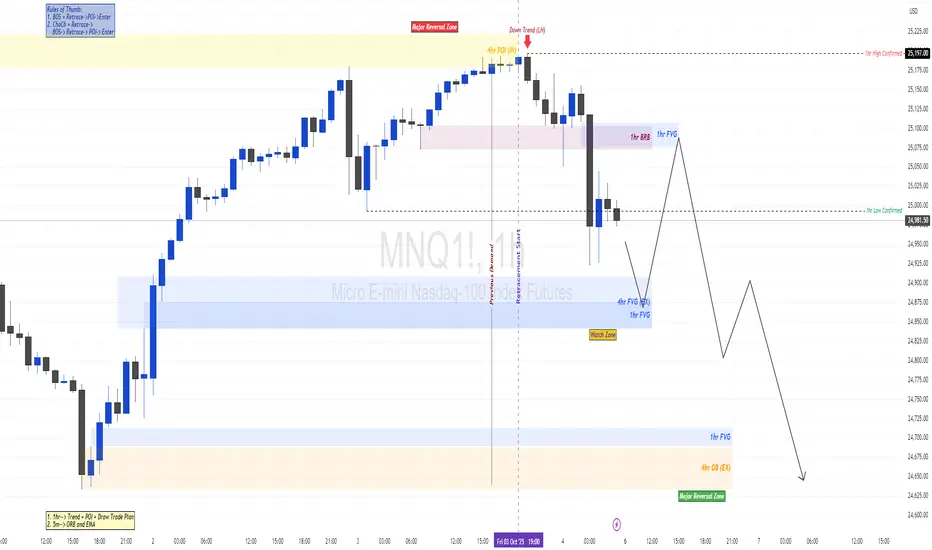
MNQ (NASDAQ Futures) – Bullish Setup Plan | 4H + 1H ConfluenceDescription / Analysis:
This is my structured outlook for MNQ (Micro E-mini Nasdaq-100 Futures) for the coming week.
4H Chart Outlook
The 4H trend remains in an uptrend (higher lows).
Price has reacted from a 4H supply zone and is now retracing lower.
Focus is on the overlap between 4H demand and 1H fair value gap as a potential bullish setup zone.
1H Chart Outlook
The 1H trend has shifted into a corrective move (downtrend after BOS).
A clean 1H fair value gap aligns with the 4H demand zone below current price.
Plan:
1.Wait for price to reach the 1H/4H overlap zone.
2.Look for 1H reversal confirmation before considering entry.
3.Refine entry on the 15M chart using BOS/CHOCH and retracement logic.
Trade Plan
1. Primary Setup (Bullish):
Entry: In the 4H + 1H demand/FVG overlap.
Confirmation: 1H reversal signs, refined on 5M.
Target: 1H FVG zone above (around 25,050–25,100).
2. Alternative Scenario:
If price first dips into the Major Bull Reversal Zone (24,600–24,700), wait for a 1H reversal before refining on 15M.
Confluence Rules Applied
4H context provides bias.
1H defines the reversal zone.
15M provides entry precision.
Structure: BOS → Retrace → POI → Entry.
Disclaimer
This analysis is for educational purposes only and reflects my personal view of the market. It is not financial advice. Please do your own research and manage risk responsibly.
NASDAQ – Short// [H1-M5]After the recent Change of Character (ChoCH) and breakdown into a lower low, the market has established a new dealing range and change of bias. When price action trades inside the premium retracement zone (62.5%–75%), where we identified two heavy negative delta clusters, suggesting aggressive sell-side interest, we have just to wait a trigger.
Internal Supply (H1): aligned with the 62.5%-75% retracement and negative delta.
External Supply (H1): positioned at the extreme premium retracement, acting as a structural resistance wall for the bearish bias.
Unless price achieves a clear breakout and acceptance above these zones, the bias remains bearish, with continuation favored in line with the newly established structure.

NQ - Week 39Should have posted this yesterday.
oh well
Color coded from the top down
grey - week
orange 4hr
yellow = 1 hr
blue - 15min

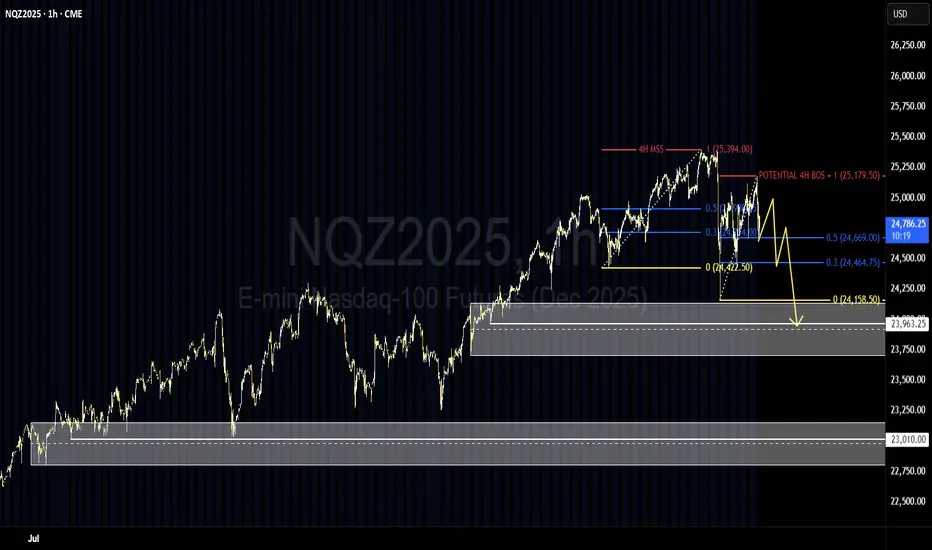
NQ 4H MSS and setting up for a potential 4H BOSWe’ve confirmed a 4H bearish market structure shift (MSS) and appear to be setting up for a bearish break of structure (BOS).
I’m watching for short setups on my entry timeframes — so far, the cleaner days have offered solid opportunities. I’m keeping my focus on scalps, as the market remains heavily news-driven, but I can’t shake the sense that a key event could trigger a liquidity sweep of the lows.
That said, this could just as easily be another classic NQ pullback before a strong recovery. I trade what’s in front of me, but this is my higher-timeframe perspective built from my lower timeframe analysis.
Time will tell…
NQ: 271st trading session - recapI was hella tired but we still ended up having a great session. It is really just about staying patient and stuff...
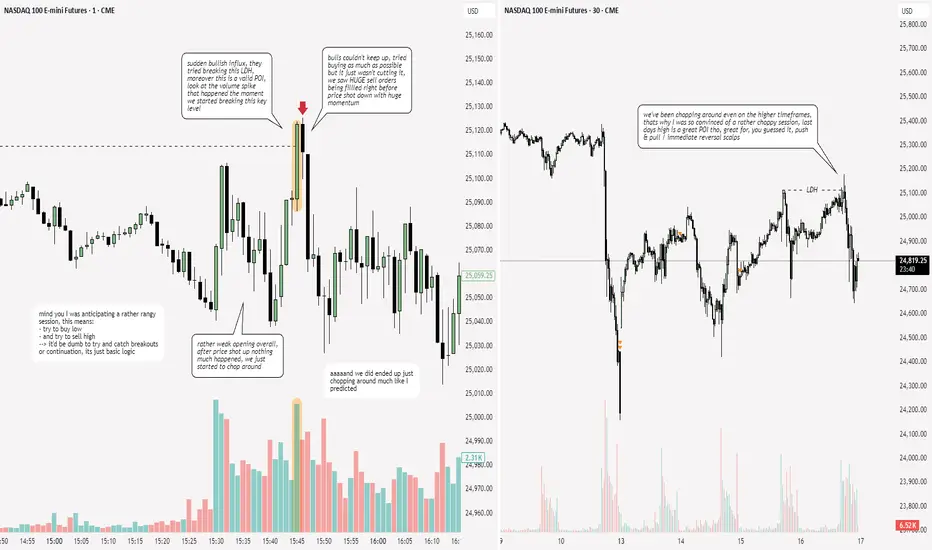
A trade I could've took, but wanted YOU to take instead! Im 5 years in this trading game, I see the market so vividly now. I thank God for everything. Through the struggles, losses and wins. I can see me quitting my 9 to 5 very soon. This is to show you guys that i eat between the lines on the 1minute timeframe. I really do this. I might start going live , I'll think about it. It might be too much pressure.

Forty Years in the WildernessWe'll get to The Promised Land. Winnowing happens. It purges the chaff.
Of traders it is said that it ''shakes out weak hands.''
We know how to read charts, manage margin and we have four trading plans. We are the grain, the staff of life, that remains after the winnowing.
Familiarize yourselves with the four trading plans I have published. Practice them. Become proficient with them.
There is great potential in the chart you are viewing.

NQ1 - Liquidity Sweeps = Bearish WedgeNQ1
Nasdaq is printing layers of slightly higher highs which is somewhat printing a bearish wedge.
So we might get some dump action soon.
I took profit on my CFD position and may re-enter at support or when the chart improves.
This analysis is shared for educational purposes only and does not constitute financial advice. Please conduct your own research and consider that crypto is a dangerous market.


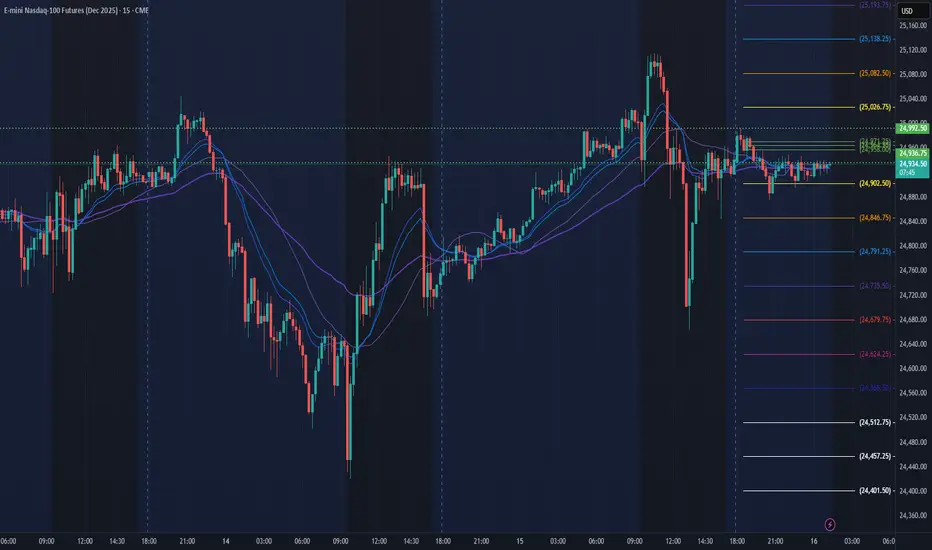
Target areas - NQ price for Market open.10/16/25 - These are the target areas - NQ price for Market open depending if price moves up or down. Will look for trades into these areas.

NQ - 10/16The red box is yesterday's candle showing the high, median and low range.
within the daily candle is a 15min ladder that creates a 1hr FrontSide(FS) level in yellow.
The Inv,FS in blue above price is the 15min resistance level.
Inv. stands for Inverse. They are the inverse of the other levels labels BS or FS.
BS or FS = support levels unless marked as a solid line.
Inv.BS or Inv.FS = resistance unless marked as solid line,
The grey box is last week high, median and low range.
The green lines are some 5min timeframe levels.

NQ Power Range Report with FIB Ext - 10/16/2025 SessionCME_MINI:NQZ2025
- PR High: 24992.25
- PR Low: 24936.50
- NZ Spread: 124.75
Key scheduled economic events:
08:30 | Initial Jobless Claims
- Retail Sales (Core|MoM)
- Philadelphia Fed Manufacturing Index
- PPI
AMP margins temp raised for pre-RTH expected economic volatility
Session Open Stats (As of 12:55 AM)
- Session Open ATR: 379.49
- Volume: 30K
- Open Int: 281K
- Trend Grade: Long
- From BA ATH: -1.8% (Rounded)
Key Levels (Rounded - Think of these as ranges)
- Long: 26020
- Mid: 23571
- Short: 21939
Keep in mind this is not speculation or a prediction. Only a report of the Power Range with Fib extensions for target hunting. Do your DD! You determine your risk tolerance. You are fully capable of making your own decisions.
BA: Back Adjusted
BuZ/BeZ: Bull Zone / Bear Zone
NZ: Neutral Zone
[NQ] Short scenarioHere is my short scenario for the US indexes with strong rejection of the previous high. May be the signal for a massive drop of the market on the following days/weeks (and it's in accord with my NASDAQ:NVDA trade short).
Great Trade !

tomorrows chart markupsshould i start going live??? Im really dope in this market.
So I posted chart markups for tomorrow. Its 8am and i LITERALLY WAS IN THE MARKET FOR 6 mins and 54 secs. profited double my daily profit on my funded account ($1200). I know what im doing and I know what I see in these markets. I dont need indicators telling me anything. Shoutout to the NAKED traders. Follow me, until tomorrow young bulls!!!
keep going bullish until it hit my blue zone. then make a decision

GET IN WHERE YOU FIT INGO check the post i posted about the chart markups today and where price was going to go... you eat between the lines... price was between levels and it broke a support zone and retested it. Good thing about it, some of yall can profit off the picture post if you trade off the 1 minute timeframe because I gave yall the sauce.
PRICE DIDNT EVEN HIT THIT THE NECKLINE FROM THE DOUBLE TOP PATTERM CREATED LAST WEEK BEFORE THE MAJOR DROP. READ THE CANDLES, IT SHOWS YOU HOW TO PRINT MONEY.

GO LOOK AT MY PREVIOUS POST.....i ate off this!! trade took no time to hit... switched betwenn regular candles and heiken-ashi
BIG WIN TODAY

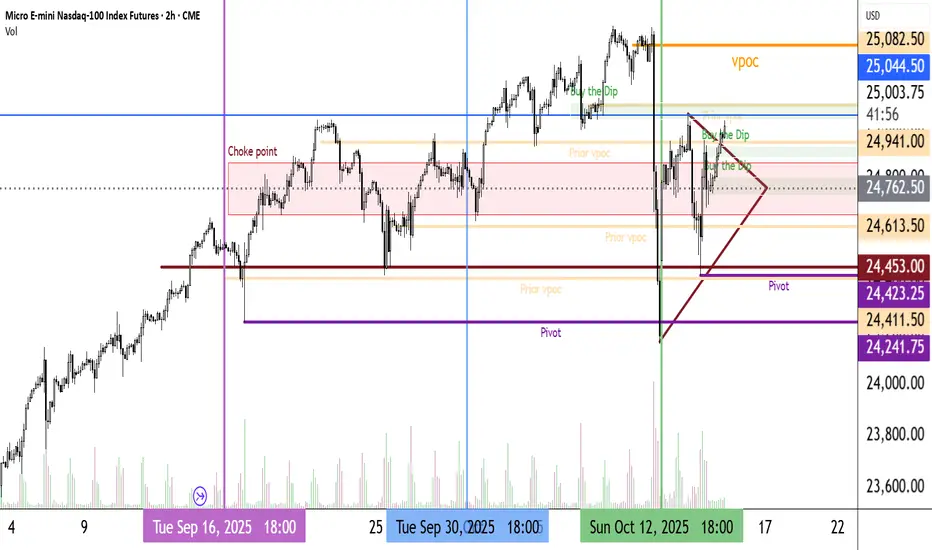
Very Busy ChartNecessary to see all support, resistance, Buy the Dip areas and other important features.
Key areas to note.
1.PX cleared the choke point
2.PX broke out of the coil
3.Buy the Dip areas
4.Resistance at prior vpoc 25082.5
If we close above that I will add to my position.
Much more could be said. I'm catching some market news and clearing my head a bit.
Target areas - NQ price for Market open.10/15/25 - These are the target areas - NQ price for Market open depending if price moves up or down. Will look for trades into these areas.

NQ Power Range Report with FIB Ext - 10/15/2025 SessionCME_MINI:NQZ2025
- PR High: 24816.25
- PR Low: 24750.50
- NZ Spread: 147.0
CPI rescheduled to Friday per AMP Futures update
Session Open Stats (As of 12:15 AM)
- Session Open ATR: 375.60
- Volume: 30K
- Open Int: 279K
- Trend Grade: Long
- From BA ATH: -2.4% (Rounded)
Key Levels (Rounded - Think of these as ranges)
- Long: 26020
- Mid: 23571
- Short: 21939
Keep in mind this is not speculation or a prediction. Only a report of the Power Range with Fib extensions for target hunting. Do your DD! You determine your risk tolerance. You are fully capable of making your own decisions.
BA: Back Adjusted
BuZ/BeZ: Bull Zone / Bear Zone
NZ: Neutral Zone
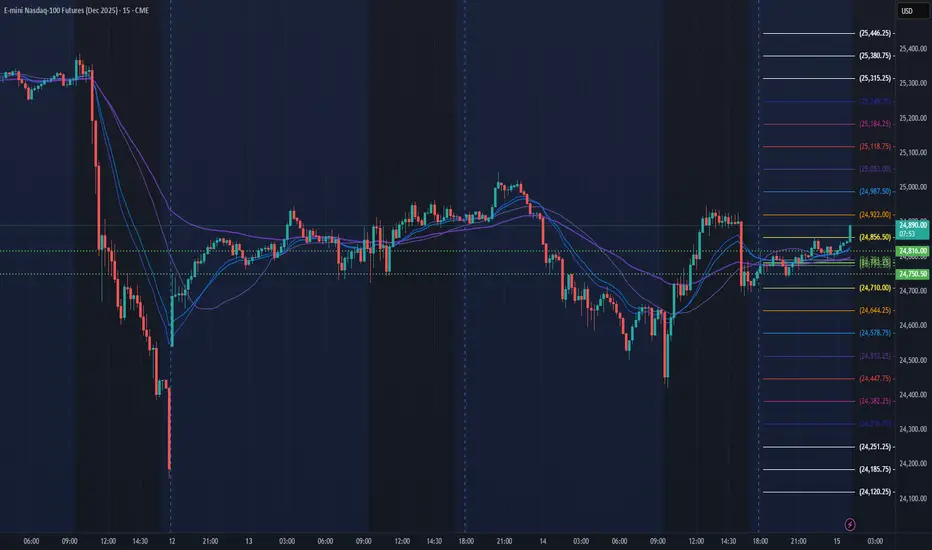
SpitballingLet's say you buy 3 MNQs @ 24680. Every 20 points you buy 3 all the way up to 24940.
Every 19.5 points you sell three - i.e. you take profit off the table.
If my quick off the top of my head math is right you will have made about $1,450.02 profit, or thereabouts.
Now at 24939.50 you sell 1 MNQ and you continue with the above pattern buying 3 contracts every 20 points all the while taking profit off the table every 19.5 points.
Wait for a pullback of at least 200 points less than where you sold that 1 MNQ @ 24939.50. Make sure you get a good bounce. Buy back the one you sold. Start your ladder again - buying 3 MNQs every 20 points and taking profit every 19.5 points.
This is a bull market. One must trade accordingly.
It all comes down to a very hard word - commit.
I just looked up the dictionary meaning of the word commit. It says pledge or bind a person or an organization to a certain course or policy
