NQ key levels 12/8/2025Best opportunity is fading strength, with downside rotation targeting 25,805 → 25,800 → 25,740 if momentum confirms.
Do not chase breakouts early; trade reactions, take profits quickly, and assume rotation—not trend—unless acceptance above 25,840 holds.
Trade ideas

Nasdaq nearing critical balanceIn November, we observed a Hagopian pattern - the market failed to reach the centerline despite the high probability of doing so (see weekly chart left). MACD-V is in divergence since then. A sign to be especially cautious.
This led to the current rally lasting more than ten days without a single close below a prior low. It seems the Plunge Protection Team may be at work.
In any case, we are now approaching the yellow centerline, the market’s point of balance. From there, the market will determine whether we push once more above the yellow centerline toward the white U-MLH, or turn downward, producing a second Hagopian and falling back toward the white centerline.
If the second scenario unfolds, the path toward significantly lower prices would be wide open.
Let’s see what we get for Christmas…

NQ Power Range Report with FIB Ext - 12/8/2025 SessionCME_MINI:NQZ2025
- PR High: 25770.00
- PR Low: 25719.50
- NZ Spread: 113.0
No key scheduled economic events
Session Open Stats (As of 12:15 AM).
- Session Open ATR: 426.48
- Volume: 21K
- Open Int: 307K
- Trend Grade: Long
- From BA ATH: -2.2% (Rounded)
Key Levels (Rounded - Think of these as ranges)
- Long: 26521
- Mid: 25264
- Short: 24008
Keep in mind this is not speculation or a prediction. Only a report of the Power Range with Fib extensions for target hunting. Do your DD! You determine your risk tolerance. You are fully capable of making your own decisions.
BA: Back Adjusted
BuZ/BeZ: Bull Zone / Bear Zone
NZ: Neutral Zone

POSSIBLE ROAD MAP FOR MNQZ2025 My last forecasting for this year and the highest probbility is the bullish scenario to take out the 25801. take care with the FOMC report on wdnesday

NQ Monday, 8 Dec to Sunday, 14 Dec trading weekly lookoutWe will layout either one of this trading variations. On variation A we will trade lower to get some sellside liquidity to push higher or we will push higher first and tap into the daily fvg then shoots lower.

MNQZ Weeekly BiasInterested to see how price opens and play around these annotated levels this week. Bias wise, I'm expecting bullish until further notice, but will be keep a close eye on that upside daly Sibi, will see how price will react from it.

Location 15m NY Session 4 Dec 2025There are 3 setups based on 15 minute structure on 4th December 2025.
Location 1 :
- Trend sell
- Structure breakout sell
Location2 :
- Structure breakout sell
Location 3 :
- Trend sell
- Structure breakout sell

Location 30m NY Session 4 Dec 2025There are 2 setups based on a single location 30 minute structure on 4th December 2025.
Location 1 :
- Trend sell
- Structure breakout sell

Location 15m NY Session 3 Dec 2025 There are 2 setups based on a 15 minute structure on 2nd December 2025.
Location 1 :
- Trend buy
- Structure breakout buy
location 2 :
- Trend buy
- Structure breakout buy

Location 30m NY Session 2 Dec 2025There are 2 setups based on a 30 minute structure on 2nd December 2025.
Location 1 :
- Trend buy
- Structure breakout buy
Location 2 :
- Trend buy
- Structure breakout buy

NQ | Week 49 | 1hr chartT.A explained -
BackSide (BS)
FrontSide (FS)
Inverse BS (Inv.BS)
Inverse FS (Inv.FS)
BS & FS levels are expected support when dashed lines, tested when dotted and resistance when solid lines.
The inverse is true for the Inv. BS Inv. FS levels, they are resistance as dashed lines, tested as dotted and support as solid lines.
Monthly timeframe is color pink
weekly grey
daily is red
4hr is orange
1hr is yellow
15min is blue
5min is green if they are shown.
strength favors the higher timeframe.
2x dotted levels are origin levels where trends have or will originate. When trends break, price will target the origin of the trend. its math, when the trend breaks, the vertex breaks too so the higher timeframe level/trend that breaks, the more volatility there could be as strength in the orders flow in to fuel the move.

NQ| Friday December 05, 2025NQ
HTF Bias: Bullish
Price took the PDH, and current price action is digging into the 4H bullish fair value gap after sweeping the Asian low.
Buyside Targets:
London high at 25,755.75
Old high at 25,830.50
Daily gap highlighted
Sellside Target:
4H +OB 75% at 25,613.75

4 DEC 2025: NQ1! MARKET RECAPJUST JOURNALLING
NYKZ AM:
SILVER BULLET + 2022 MODEL
DISCLAIMER:
The owner of this page is an authorised Representative under supervision of TD MARKETS (PTY) LTD, an authorised Financial Services Provider (FSP No. 49128) licensed by the Financial Sector Conduct Authority (FSCA) under the Financial Advisory and Intermediary Services Act (FAIS).
The FSP is licensed to provide advice and intermediary services in respect of Category I financial products, including but not limited to derivative instruments, long-term deposits, and short-term deposits.
All investment ideas are provided in accordance with the scope of the FSP's license and applicable regulatory requirements. Derivative instruments is a leveraged products that carry high risks and could result in losing all of your capital, and past performance is not indicative of future results.
This idea and any attachments are informational/education and does not constitute a recommendation to buy/sell.
No guarantee is made regarding the accuracy or outcome of this trade idea.
If you choose to accept this idea, please do so at your own risk.

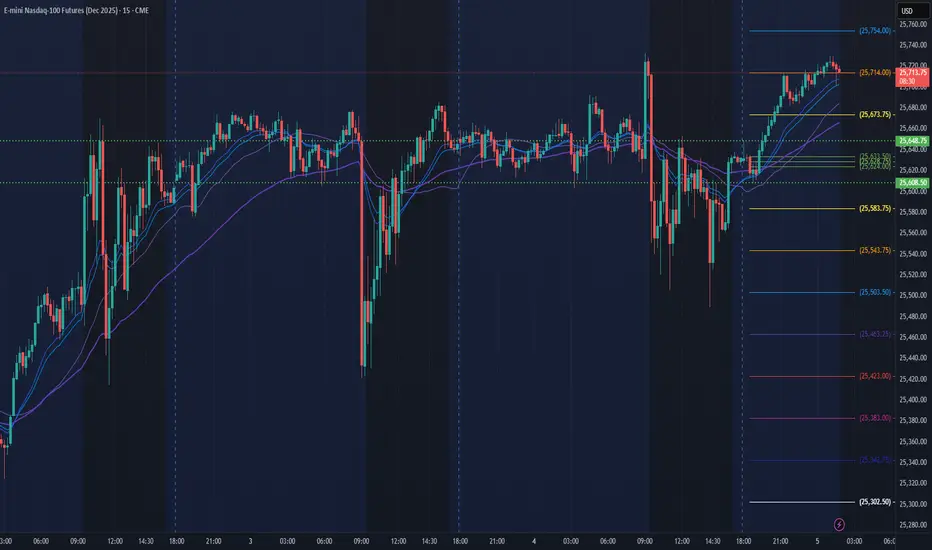
NQ Power Range Report with FIB Ext - 12/5/2025 SessionCME_MINI:NQZ2025
- PR High: 25648.75
- PR Low: 25608.50
- NZ Spread: 90.0
Key scheduled economic events:
10:00 | Core PCE Price Index (MoM|YoY)
Session Open Stats (As of 12:55 AM)
- Session Open ATR: 438.85
- Volume: 21K
- Open Int: 306K
- Trend Grade: Long
- From BA ATH: -2.5% (Rounded)
Key Levels (Rounded - Think of these as ranges)
- Long: 26636
- Mid: 25410
- Short: 23426
Keep in mind this is not speculation or a prediction. Only a report of the Power Range with Fib extensions for target hunting. Do your DD! You determine your risk tolerance. You are fully capable of making your own decisions.
BA: Back Adjusted
BuZ/BeZ: Bull Zone / Bear Zone
NZ: Neutral Zone
Goldbach ideaBias ideas using Hopiplaka's personal trade plan logic with po3 size movements. The next target for the idea is a 27 points BISI that i did not show but it's marked down there.

NQ/QQQ: Be careful breaking below this channel.Be careful breaking this up channel.
Historically, rate cuts tend to coincide with a cooling economy. While the immediate market reaction may be optimistic—driven largely by expectations of easier financial conditions—rate cuts have often been followed by a weaker market cycle over the subsequent six months. This pattern reflects the underlying macroeconomic slowdown that typically prompts the Federal Reserve to ease policy in the first place.


NQ | 12/4The T.A is explained in every other post.
I look for the first and last accumulation candles in an accumulation range - An accumulation range consists of two or more accumulation candles. when price is below there candles/range they act as resistance. Therefore I mark the bottom side of the accumulation candles except for the Last accumulation candle which topside is the swing high.
I also look for the first and last distribution candles in a distribution range - A distribution range consists of two or more distribution candles. when price is ABOVE there candles/range they act as Support. Therefore I mark the top side of the distribution candles except for the Last distribution candle which bottom side is the swing low
Each level is color coded to a timeframe
Pink = month
grey = week
red = day
orange = 4hr
yellow = 1hr
light blue =15min
green = 5min
3min= purple
1min = white. .

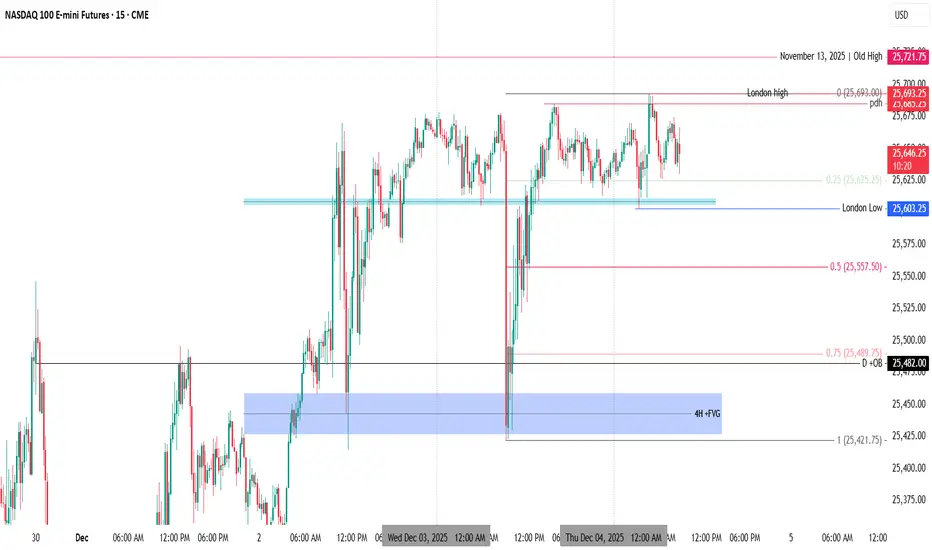
NQ | Thursday December 04, 2025**NQ**
HTF Bias: **Bullish**
The Asian high was raided during the London open. Price then retraced, swept the Asian low, and traded into the daily volume imbalance before pushing higher and taking the PDH.
Currently, price remains inside the London session range.
**Buyside Targets:**
> London high at 25,693.25
> November 13, 2025 old high and November 12 old high
**Sellside Targets:**
> London low at 25,603.25
> Previous dealing range 50% at 25,557.50
3 DEC 2025: NQ! MARKET RECAPLAY OF THE LAND
NASDAQ E-MINI CONTINUOUS FUTURES
DISCLAIMER:
The owner of this page is an authorised Representative under supervision of TD MARKETS (PTY) LTD, an authorised Financial Services Provider (FSP No. 49128) licensed by the Financial Sector Conduct Authority (FSCA) under the Financial Advisory and Intermediary Services Act (FAIS).
The FSP is licensed to provide advice and intermediary services in respect of Category I financial products, including but not limited to derivative instruments, long-term deposits, and short-term deposits.
All investment ideas are provided in accordance with the scope of the FSP's license and applicable regulatory requirements. Derivative instruments is a leveraged products that carry high risks and could result in losing all of your capital, and past performance is not indicative of future results.
This idea and any attachments are informational/education and does not constitute a recommendation to buy/sell.
No guarantee is made regarding the accuracy or outcome of this trade idea.
If you choose to accept this idea, please do so at your own risk.

NQ Power Range Report with FIB Ext - 12/4/2025 SessionCME_MINI:NQZ2025
- PR High: 25658.75
- PR Low: 25633.75
- NZ Spread: 56.0
Key scheduled economic events:
08:30 | Initial Jobless Claims
Session Open Stats (As of 12:45 AM)
- Session Open ATR: 450.27
- Volume: 19K
- Open Int: 304K
- Trend Grade: Long
- From BA ATH: -2.7% (Rounded)
Key Levels (Rounded - Think of these as ranges)
- Long: 26636
- Mid: 25410
- Short: 23426
Keep in mind this is not speculation or a prediction. Only a report of the Power Range with Fib extensions for target hunting. Do your DD! You determine your risk tolerance. You are fully capable of making your own decisions.
BA: Back Adjusted
BuZ/BeZ: Bull Zone / Bear Zone
NZ: Neutral Zone

Flipping bias based on price actionFlipping Bias mid macro as price action is clearly respecting bullish scenario's.

NQ | Wednesday December 03, 2025The previous day’s high was raided during the Asian session, after which price retraced into the 4H bullish volume imbalance and rejected from that area.
Key Levels I’m Watching:
Buyside Liquidity:
> Midnight high at 25,678.25
> November 13, 2025 old high at 25,721.75
> November 12, 2025 old high at 25,829.50
Sellside Liquidity:
> Pre-market low at 25,614.75 — below this sits the 4H volume imbalance
> Swing low at 25,576.00
This is a live market read and levels are subject to change as price action develops.
