NQ Higher then Bear MarketThink we have one last leg up in NDX/NQ here then a bear market to follow.
Trade ideas


NASDAQ 100 (NQ1!): Wait For Price To Reach -FVG!Welcome back to the Weekly Forex Forecast for the week of Nov. 17-21st.
In this video, we will analyze the following FX market: NASDAQ (NQ1!) NAS100
The NASDAQ gave some bearish-neutral price action last week. It ended in a doji candle, not giving us much in the way of directioin. But, there is a bearish FVG on the Daily TF formed. The reaction to it will provide all the insight we need regarding the directional bias of this market for this coming week.
If the -FVG holds, sell it. If it is disrespected, buy it.
Simple.
Enjoy!
May profits be upon you.
Leave any questions or comments in the comment section.
I appreciate any feedback from my viewers!
Like and/or subscribe if you want more accurate analysis.
Thank you so much!
Disclaimer:
I do not provide personal investment advice and I am not a qualified licensed investment advisor.
All information found here, including any ideas, opinions, views, predictions, forecasts, commentaries, suggestions, expressed or implied herein, are for informational, entertainment or educational purposes only and should not be construed as personal investment advice. While the information provided is believed to be accurate, it may include errors or inaccuracies.
I will not and cannot be held liable for any actions you take as a result of anything you read here.
Conduct your own due diligence, or consult a licensed financial advisor or broker before making any and all investment decisions. Any investments, trades, speculations, or decisions made on the basis of any information found on this channel, expressed or implied herein, are committed at your own risk, financial or otherwise.

If Nasdaq can crack the pressure line then...🔱 We have a Hagopian on the down-move. 🔱
Price was (so far) not able to reach the L-MLH of the red fork.
If buyers can eat through the pressure cheese, then the Long-Play is on.
Most often we see price breaking the pressure line and then coming back to it, scaring out the early longs, just to rush upwards again. So don’t panic if this happens. Place a proper stop and you're good.
As for targets, there is the red Centerline and the white Centerline.
On a break of the red CL, we have a high chance to see the same scenario as with the pressure line: UP-Down-MoreUp.
First snow in Switzerland arrived and Santa is preparing the reindeer to bring us some dough ;-)
Wish you all a profitable Friday.

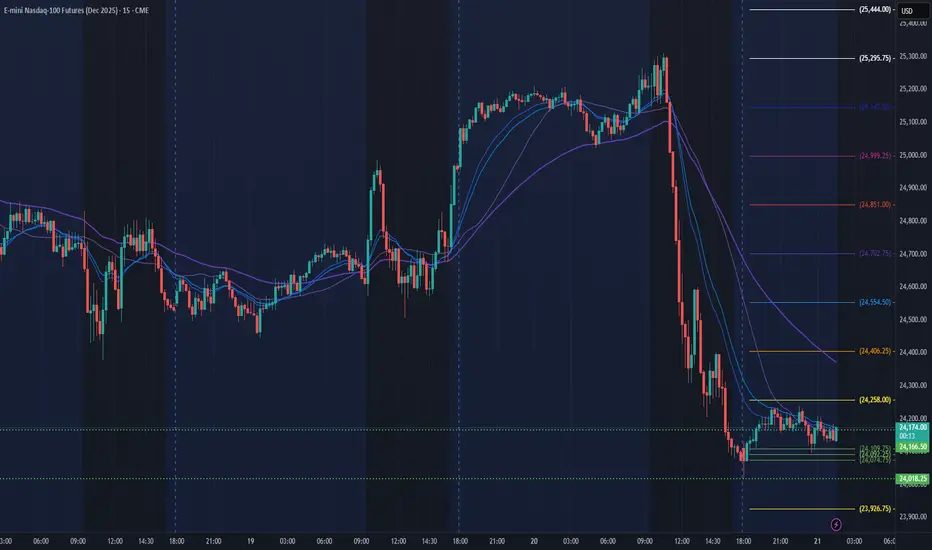
NQ Power Range Report with FIB Ext - 11/21/2025 SessionCME_MINI:NQZ2025
- PR High: 24166.25
- PR Low: 24018.00
- NZ Spread: 331.0
Key scheduled economic events:
09:45 | S&P Global Manufacturing PMI
- S&P Global Services PMI
Session Open Stats (As of 12:35 AM)
- Session Open ATR: 525.13
- Volume: 66K
- Open Int: 301K
- Trend Grade: Long
- From BA ATH: -8.4% (Rounded)
Key Levels (Rounded - Think of these as ranges)
- Long: 26636
- Mid: 25410
- Short: 24039
Keep in mind this is not speculation or a prediction. Only a report of the Power Range with Fib extensions for target hunting. Do your DD! You determine your risk tolerance. You are fully capable of making your own decisions.
BA: Back Adjusted
BuZ/BeZ: Bull Zone / Bear Zone
NZ: Neutral Zone
Derivatives & Options Trading Trends1. Rising Retail Participation and Democratization of Derivatives
One of the most significant trends is the rapid increase in retail participation, especially in markets like India, the U.S., and parts of Asia. Platforms such as Robinhood, Zerodha, Upstox, and Interactive Brokers have made derivatives trading more accessible by offering low-cost or zero-brokerage models, simplified interfaces, and educational tools.
In India, index options volumes on NSE have surged to record highs, driven by weekly and even daily options expiries. Retail traders now actively participate in directional and non-directional strategies including spreads, straddles, strangles, and intraday scalping. Because of lower margin requirements and high leverage, derivatives have become an attractive entry point for younger traders.
This democratization comes with both opportunities and risks. While broader participation enhances market depth and liquidity, it also increases systemic concerns around over-leverage, herd behaviour, and inadequate understanding of derivatives mechanics.
2. Explosive Growth of Weekly and Short-Dated Options
Short-tenor options—weekly, daily, and even zero-day options (0DTE)—have become a global phenomenon. The U.S. S&P 500 Index (SPX) now sees major volumes in 0DTE options, favoured by traders for intraday speculation, gamma exposure, and event-driven strategies.
Similarly, in India, weekly Bank Nifty and Nifty expiries have turned into some of the most traded options worldwide. Traders prefer these contracts for:
Lower premiums
Quick payoff realization
High volatility leading to strong intraday movements
Flexibility to align with macro events (Fed decisions, CPI data, RBI policy, earnings, etc.)
Short-dated options have reshaped intraday volatility patterns, with large swings near expiry due to gamma effects and dealer hedging flows.
3. The Era of Algorithmic and Quantitative Trading in Derivatives
Quantitative models and algorithmic trading systems now dominate global derivatives markets. Hedge funds, proprietary desks, and even retail quants increasingly use:
Market-neutral strategies
Volatility arbitrage
High-frequency scalping
Options-based hedging
Gamma and vega-weighted portfolios
Machine-learning-driven directional trades
In India, algo penetration in derivatives has increased dramatically after regulatory approvals for API-based trading. Low-latency systems allow quants to execute thousands of trades per second, exploiting micro-imbalances, liquidity pockets, and implied-volatility mispricings.
Algo trading is particularly influential in options markets, where pricing inefficiencies emerge frequently due to time decay and volatility shifts.
4. Surge in Volatility Trading and Volatility Derivatives
A major global trend is the rise of volatility as an asset class. Traders now actively trade volatility, not just price direction, through:
VIX futures and options
Implied volatility strategies (IV crush, IV expansion)
Calendar spreads
Vega-neutral portfolios
Volatility arbitrage between indices and individual stocks
During major macro events—geopolitical shocks, central bank decisions, inflation releases—volatility spikes create large opportunities for professional traders.
The global appetite for volatility exposure reflects increasing macro uncertainty in markets shaped by inflation cycles, geopolitical risks, and policy unpredictability.
5. Growing Popularity of Exotic Options and Structured Derivatives
Beyond standard call and put options, demand is rising for exotic derivatives, especially among institutions. These include:
Barrier options
Asian options
Binary options
Lookback options
Range accrual derivatives
Digital payoff structures
Structured product desks in banks use these derivatives to offer tailored risk-return solutions to corporate treasuries, high-net-worth individuals, and offshore investors.
In equity derivatives, structured notes like autocallables are gaining traction globally, especially in European and East Asian markets.
6. Commodities and Currency Derivatives: A Renewed Focus
Commodity and currency derivatives have seen renewed interest due to global supply chain disruptions, geopolitical instability, and inflation pressures.
Key Drivers:
Oil price volatility due to Middle East conflicts
Agricultural supply shocks
Currency fluctuations driven by monetary policy divergence
Rising importance of hedging for import- and export-dependent industries
In India, the launch of new currency derivatives and increased retail interest in crude oil and natural gas options have broadened the market.
7. Interest Rate Derivatives and the Post-Rate-Hike World
As central banks oscillate between tightening and easing cycles, interest rate derivatives (IRDs) such as swaps, futures, and swaptions have gained remarkable importance.
Key themes include:
Hedging long-term debt exposure
Speculation on rate paths
Positioning around government bond yield movements
Managing duration risk for institutional investors
The pricing of interest rate options is now heavily influenced by inflation expectations, forward guidance, and global economic conditions.
8. Regulation, Risk Control & Margining Reforms
Global regulators have tightened rules around derivative trading to ensure transparency and reduce systemic risk. Major reforms include:
Mandatory margining for futures and options
Upfront collection of SPAN + Exposure margin
Position limits for retail participants
Greater disclosures for brokers and exchanges
Risk-based levies on high-frequency trading
Banning of certain high-risk derivatives for retail in some regions
In India, peak margin rules and tightened risk controls have significantly changed intraday derivatives strategies, reducing excessive leverage.
9. Rise of Data-Driven Decision Making
Modern derivatives traders rely heavily on:
Real-time order book analytics
Option Greeks monitoring systems
Volatility surface modelling
Big-data sentiment indicators
AI-driven predictive models
Access to sophisticated analytics platforms—Sensibull, Opstra, TradingView, Bloomberg, Reuters, and broker-provided tools—helps even retail traders adopt institution-grade analysis.
10. Shift Toward Multi-Asset Derivative Strategies
Markets are becoming increasingly interconnected. Traders now prefer multi-asset strategies that combine:
Equity + Currency
Equity + Commodity
Interest Rate + Currency
Options + Futures
Cross-country derivatives
These hybrid strategies help hedge correlated risks and exploit arbitrage opportunities across markets.
Conclusion
Derivatives and options trading are undergoing a profound transformation driven by retail participation, technological advancement, algorithmic dominance, volatility-focused strategies, and regulatory shifts. Markets are faster, more interconnected, and more complex than ever before. Whether used for hedging, speculation, arbitrage, or portfolio diversification, derivatives remain a cornerstone of modern financial markets.
As the global environment becomes more uncertain, derivatives will continue to play a crucial role in risk management and trading innovation—shaping the next era of financial markets.
Nasdaq 100 - Analysis
Currently watching this expanding megaphone pattern, should this break down, then a 20-30% drop would be on the table.
the recent drop in NVDA despite strong earnings signals cracks in the AI trade, concern over extending the depreciation of GPUs may also cause cracks as further financial investigation may find.
I am currently short QQQ, with some hedged long positions, but with a strong overall cash position.
should equities fall, then i expect crypto to follow suit, this would all equate to a tremendous buy opportunity in the next 6-12 months.
NQ Daily Outlook | November 21, 2025Timeframe Shown: 1H (1-Hour Chart)
EMAs I’m Using:
• 50 EMA (black)
• 5 EMA (white)
• 10 EMA (white)
Price dropped below all of these EMAs during the NY session. On the 1H chart we’re getting a pullback now, and when that happens I scale down to the 5M and look for the same thing — price pulling back into the EMAs and then breaking back below them. That’s where I look for my continuation entries.
Bias: Bearish while we’re still under all EMAs.

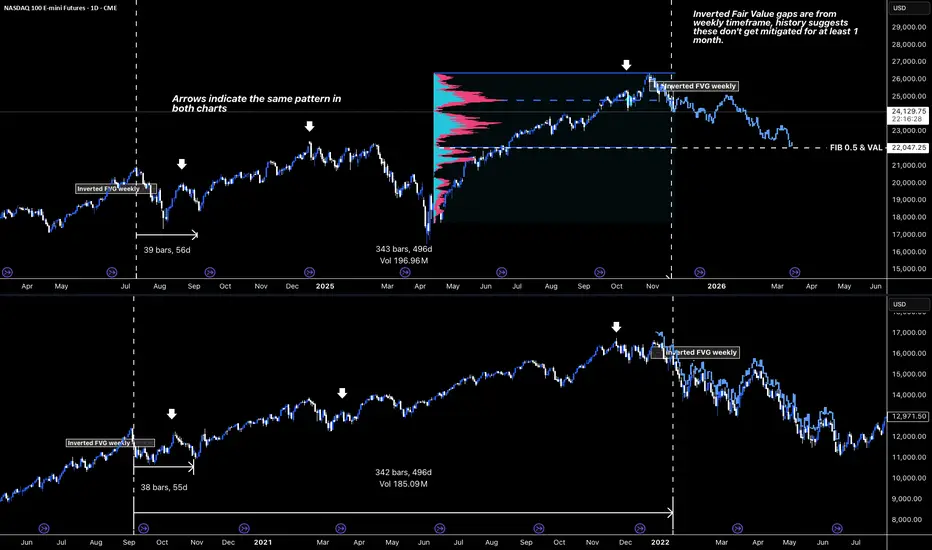
NQ Local top is in, 22,000 the target lowHi All,
NQ is still walking the same path it did in 2020–22.
Same weekly inverted FVG near the top.
Same slow fade after the high.
Same bar count into the rollover.
The fractal underneath isn’t a coincidence — Markets repeat patterns the same way people repeat bad decisions after saying ‘never again.
The downside confluence is hard to ignore:
the 0.5 Fib, the weekly imbalance, and the Value Area Low all sitting on top of each other around 22k.
Three signals, one destination.
Premium is done.
Distribution is done.
Now the market’s heading back to fair value, the same way you head back to the gym after a blowout weekend — not because it’s fun, but because that’s where the reset happens.
The fractal already laid the blueprint:
drift → tag fair value → reflex bounce → finish the imbalance.
Nothing in the current structure says this time is different.
Until that 22k zone is cleaned up, anything above it is just background noise.
NQ Short setup on 1HR Bearish DivergenceNQ Short setup on 1HR Bearish Divergence
Entry: 25447
SL: 25835
TP: 24282
RR: 1:3

1:11 Trade idea;Nasdaq
A good zone for big trades
Its an instituional level, a lot of agressive buyers

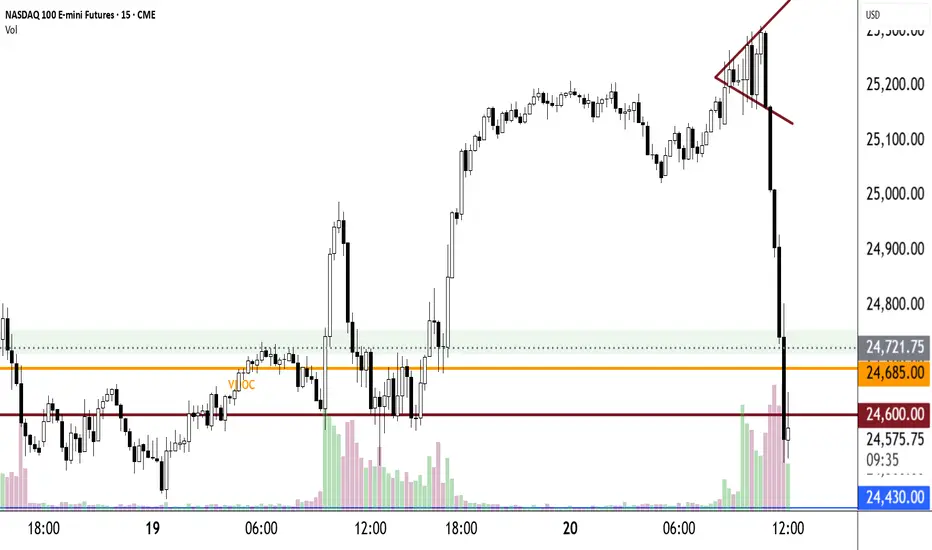
Caution FormationAny reverse formation shouts "Caution!" Turn this pattern around and you have a Symmetrical Triangle which is a consolidation pattern and typically indicates continuation of the trend. It would also be a price coil. This Reverse Symmetrical Triangle is a price expansion. Whenever you see this reverse pattern think Caution.
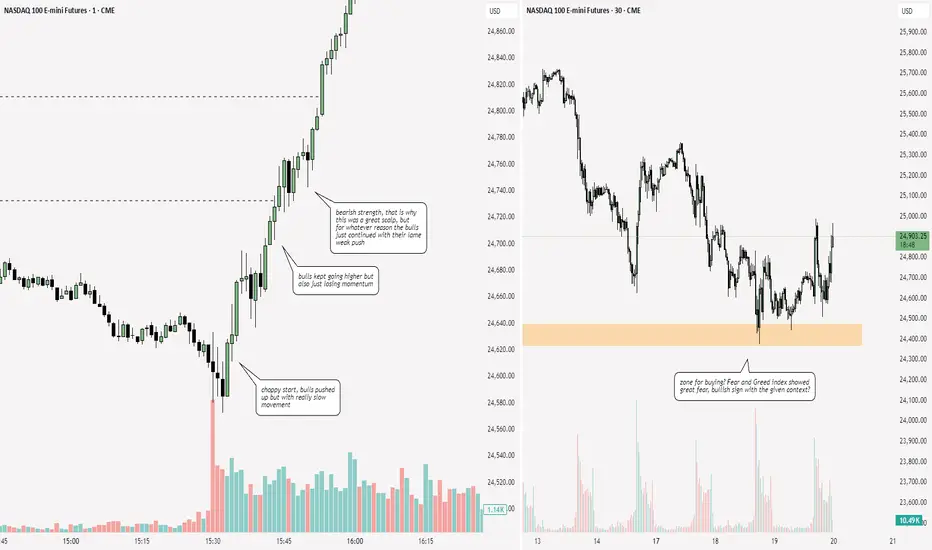
Right now, 12:05, we have a very high probability win rate BTD trade forming, an Exhaustion Candle immediately followed by a White Bull @ strong near the prior day's close.
Some days require two charts. Today is one of them
.5% risk after taking a loss yesterdaySeeing which PD arrays were being respected and it was the bullish ones, looks like a 1H PO3 coming on now at 10am however.

"Traffic"Stereophonics 1997
Daily Grind
Congestion
Setup
1. many supports & resistances
2. much swirling market moving news
3. strong fundamentals
4. historical bull market
5. strong resistance @ 25000 = a very round number
6. jobless data out soon
7. 4.2% est 3rd qtr growth
8. NVDAs earnings out & great
Trading Plan
1. Good BTD - 25000, wait for the bounce
2. Breakouts - always
3. Pivots, & Jokers - always

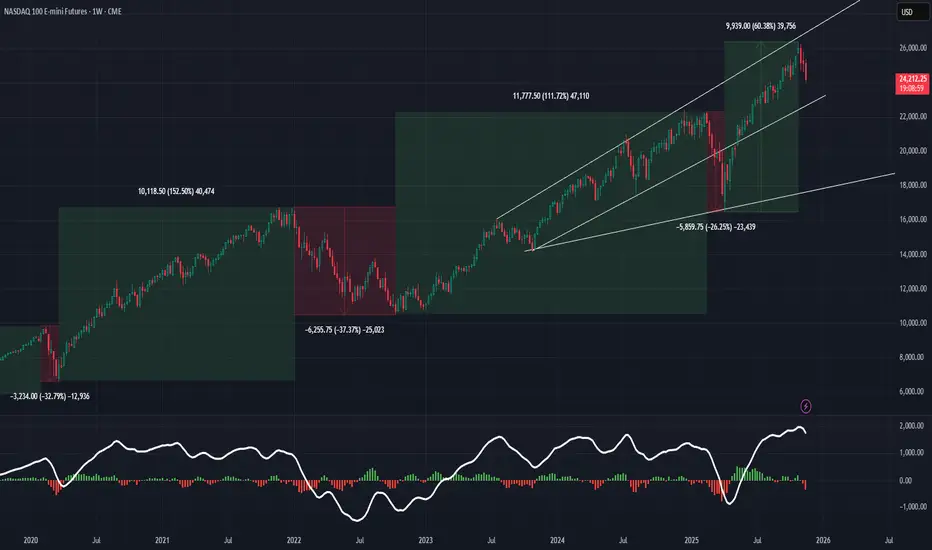
Nasdaq Big crash is started from november 2025 month. Good luck.Technically on charts, Nasdaq has completed its viscous fed liquidity supported; all 5 elliot waves starting from 2001 dot com low 797 to present year high 26399. Today is 20.11.2025. Pic is attached for your reference. Will see this chart again after a year or may become obsolelte if nasdaq again crosses 26399 and stays above it for a month. Lets see.

NQTargets are above unless price respects this demand and continues moving up. After price reaches a target, wait for confirmation on the lower timeframes — that’s what will tell you whether price will continue or not. You don’t predict; you react to each zone.

NQ Power Range Report with FIB Ext - 11/20/2025 SessionCME_MINI:NQZ2025
- PR High: 25110.75
- PR Low: 24955.50
- NZ Spread: 211.5
Key scheduled economic events:
08:30 | Philadelphia Fed Manufacturing Index
10:00 | Existing Home Sales
Session Open Stats (As of 12:15 AM)
- Session Open ATR: 478.35
- Volume: 49K
- Open Int: 292K
- Trend Grade: Long
- From BA ATH: -4.6% (Rounded)
Key Levels (Rounded - Think of these as ranges)
- Long: 26636
- Mid: 25410
- Short: 24039
Keep in mind this is not speculation or a prediction. Only a report of the Power Range with Fib extensions for target hunting. Do your DD! You determine your risk tolerance. You are fully capable of making your own decisions.
BA: Back Adjusted
BuZ/BeZ: Bull Zone / Bear Zone
NZ: Neutral Zone
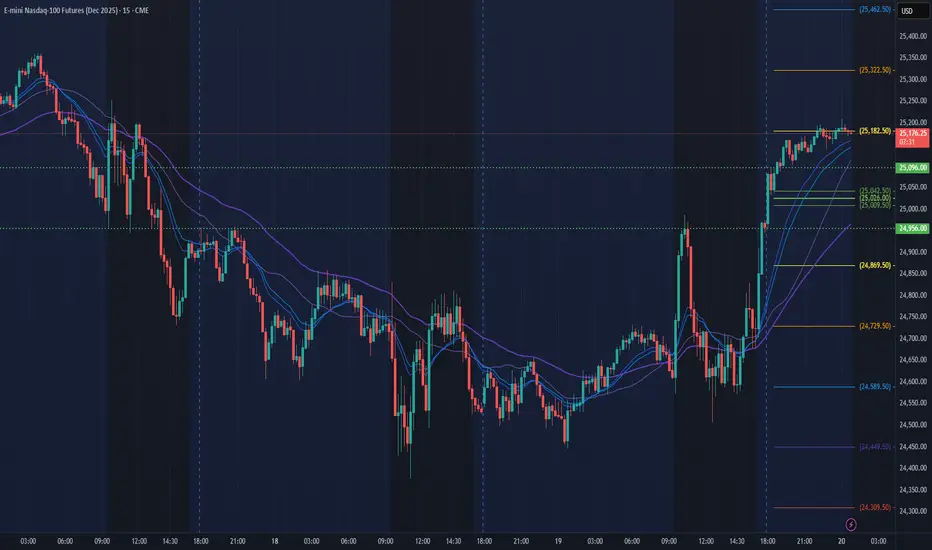
NQ Daily Outlook | November 20, 20251H timeframe — 50 EMA (black) for trend + 5/10 EMAs (white) for momentum/BOS.
Quick read: Price broke above the 5/10 EMAs and cleared the 50 EMA with a strong impulse. All EMAs are now below price, so we’re in a bullish state for the first time in a while.
Bullish idea (favored)
Now that we’re above all EMAs, I’m looking for:
A small pullback into the whites
A bullish BOS
Then continuation higher
As long as we stay above the 50 EMA, momentum stays bullish.
Bearish idea
Only shifts bearish again if:
We drop back under the 5/10 EMAs
Lose the 50 EMA
Print a BOS down
Until that happens, shorts are lower probability.
Bias: Bullish — EMAs reclaimed + impulse confirms momentum. I’m looking for continuation up unless we lose the whites and fall back under the 50 EMA.

NQ UpdatePretty much the same as ES.
Since I didn't buy any calls this afternoon, I'm probably just staying out for now. No point in chasing a 1.5% futures pump.

NQ: 285th trading session - recapI'm back now, haven't scalped in a while since my gf decided to break things up which really messed me up. I'm trying to get my stuff together and start over with scalping after a longer break. One of the first days of me actually being able to have a sort of normal session lmao
Garrett Ball Spelling Garrett with two t doesn't make sense. We really need to sweep the t out of his name

