COAI - IS BOTTOM IN ?? Volume increasing on #COAI & setup I gave this morning played well with a 20%+ bull increase from the low! 📈
Following the same plan, I think that the bottom could be in if 0.786 fib act as bottom & retest (1.3200$).
Therefore, bulls could push prices toward 1.80$+ from here next! 🚀 (or even much higher, if we catch the monthly low & whales join the party again... here after a 90%+ retracement!)
I took 140% profits, I'll buy again this dip :) (x10)
Chart structure looks much safer.
Let's see! 👀
Just sharing a possible bottom here!
Not a financial advice team! Huge volatility! #DYOR
Trade ideas

COAI Buy/Long Setup (2H)First of all, you should know that this is a highly volatile and risky asset, so you need to enter the position in a way that if it hits the stop loss, you only lose about 1–2% of your capital, or even less | so manage your risk carefully.
The marked entry zones are considered strong supports for this coin, which could potentially lead to good profits. You should enter in spot, as this coin has wide zones.
Targets are shown on the chart.
For risk management, please don't forget stop loss and capital management
When we reach the first target, save some profit and then change the stop to entry
Comment if you have any questions
Thank You


COAI - FINALLY BULL REVERSAL! Bull reversal on $COAI - -> +40% up in few minutes ✅📈
From 1.00 to 1.60..
It finally happened here: after I got liquidated on a position😂
Congrats if you manage to hold it like a warrior!
Where do you think it will stop? 👀💣

COAIUSDT.P - October 29, 2025The chart exhibits a strong bearish trend with sustained lower highs and lows, indicating continued downside momentum. Expecting potential continuation toward the lower target near $0.01 — I am basically shorting this until it loses 99% of its market cap.

COAI 4.25 bottom looking goodbasic tip a massive capitulation is opportunity
with volume and heavy participation
this looks like an easy riskless trade back to at least $14 or better yet after FOMC on Thur Oct 30 towards $31++

COAI bottom?The asset had been moving within a descending channel, forming a clear series of lower highs and lower lows.
Recently, the price broke above the upper boundary of the channel, signaling a potential trend reversal to the upside.
Bullish divergences appeared on the RSI and several other indicators, suggesting that bearish momentum has weakened.
The price is currently consolidating below a local trendline — a breakout above it could provide a valid entry point for a continuation move.
Trading Idea:
A long setup can be considered once the local trendline is broken with volume confirmation.
The upside potential remains strong, supported by the recent breakout from the broader descending structure.

COAI PotentialThis area that COAI is standing is a good support.
I expect some throwback here, while waiting for bullish candle formation before entering

COAI – Could This Be the Bottom ?
Volume is finally kicking in on $COAI, and the setup I shared earlier played out perfectly — delivering a solid +20% bounce from the lows!
Now things are getting interesting 👀 — if the 0.786 Fib zone holds as a strong base and confirms on retest, we might just be witnessing the true bottom forming here.
From this point, bulls could easily drive price toward $1.90+, or even higher if the monthly low acts as a launchpad and whales step back in after that massive 90%+ retrace.
I’ll be buying this dip again (x10) — structure looks way safer now.
Let’s see how this plays out!
⚠️ Not financial advice — just sharing my view.
Market remains highly volatile, so always #DYOR 💥

COAI - BEARISH$COAI - update:
Honestly price manipulation on this asset is just absurd!
How can it still be listed on major CEX??
The current trend remain pretty bearish, with a clean downtrend channel H1📉
I don't think that the bottom is in yet.
Key support i'm watching as potential bottom before bull reversal:
2.00 - 2.10$ 🎯
1.720 - 1.680$ 🎯
Short term PA is very volatily.
Best to day is keeping an eye on the channel trends.
#DYOR #COAI

$COAI — market maker in full control🎯 When a market maker has a goal — no market sentiment can stop him.
💥 The price of $COAI has almost been “pushed” to its all-time high around $20, while the project’s market cap has already climbed to nearly $4B.
A lot or not — for such a “young” project? 🤔
📈 What’s more, arbitrage traders are adding fuel to the fire — with a funding rate of -1.5%/h, short sellers are literally paying long holders to stay in position.
That creates a chain reaction: short liquidations → less liquidity → another price spike 🚀
⚠️ But once the market maker reaches his target — this could all end suddenly.
The market’s emotional right now, so stay alert.
💡 Some even speculate that similar moves might be repeated on other freshly listed tokens.
What do you think — could that happen again?
Drop your thoughts in the comments and we will analysis this coins 👇
______________
◆ Follow us ❤️ for daily crypto insights & updates!
🚀 Don’t miss out on important market moves
🧠 DYOR | This is not financial advice, just thinking out loud.

$COAI (4-HOUR): 8.3M tokens unlocked TODAY, another CRASHThis relatively new $COAI coin popped up on my radar last night as I was getting ready for my bedtime, it was $19 per token, I prepared an analysis and today woke up to another madness in price.
$8.5 now, a $1.7B marketcap in circulation.
And the main chart (4-HOUR, still a new asset) is absolutely mental, debuted only this month around a dollar, ATH within a week (nearly.. $47 per token), then a flash-crash to $5 followed by another wild rally to $27, back down to $4+ (forming a DOUBLE BOTTOM), followed by the most recent pump to $25+ yesterday.
And here we are after another crash and below the 10 dollar mark once again, also below the 50 MA ($11.45) and the GOLDEN POCKET ($11.9 - $12.55).
I have done some fundamental research, it seems that the current unlocks (8.3M token; 0.83% of total supply, a monthly unlock from now on) have been the main culprit.
The unlocks are quite large even at current, lower prices, so obviously a RED FLAG. I will only be interested in this coin at ultra-low prices, the BUY-ZONE on my chart, basically anything below $5, or $4.5, this is the bottom of the range with previous DEMAND history which established the SUPPORT zone.
RSI oversold, but this can go deeper. Market structure bearish, lower HIGH yesterday after a slighly lower LOW a week ago.
Interesting AI - WEB3 project, it's just these unlocks at the time of retail capitulation, not a great mix these days.
👽💙

Global Equity TrendsIntroduction
Global equity markets serve as the heartbeat of the world economy. They represent ownership in publicly traded companies, providing investors with opportunities for wealth creation, diversification, and long-term growth. Over the decades, global equity trends have evolved through technological innovation, globalization, regulatory reforms, and changing investor behavior. The past few years—especially post-COVID-19—have seen dramatic shifts in market dynamics, valuations, and sectoral leadership. Understanding global equity trends is essential for investors, policymakers, and economists to navigate the ever-changing financial landscape.
1. The Evolution of Global Equity Markets
Historically, equity markets were dominated by a few developed economies like the United States, United Kingdom, Germany, and Japan. However, over the last three decades, globalization and liberalization of capital markets have expanded participation to emerging economies such as China, India, Brazil, and South Korea.
In the 1980s and 1990s, major structural reforms and the integration of technology revolutionized stock trading, making global equities more accessible and transparent. The rise of electronic trading, online brokerages, and exchange-traded funds (ETFs) further democratized participation. Today, investors can access global equities at the click of a button, enabling cross-border diversification and global asset allocation strategies.
2. Post-Pandemic Recovery and Market Resilience
The COVID-19 pandemic marked one of the most volatile periods in financial history. Equity markets crashed in early 2020 but rebounded swiftly, driven by unprecedented fiscal stimulus and ultra-loose monetary policies by central banks. The recovery was uneven—technology and healthcare sectors surged, while travel, energy, and traditional manufacturing lagged behind.
By 2021, global markets reached record highs, fueled by optimism over digital transformation, renewable energy, and e-commerce growth. However, 2022 brought renewed challenges as inflation surged, interest rates rose sharply, and geopolitical tensions—particularly the Russia-Ukraine war—disrupted supply chains and energy markets. Despite these shocks, equity markets have shown remarkable adaptability, demonstrating the long-term resilience of the global economy.
3. Regional Market Performance
a. United States
The U.S. remains the anchor of the global equity landscape, accounting for over 60% of global market capitalization. The S&P 500, NASDAQ, and Dow Jones indices have led global performance, driven by technology giants like Apple, Microsoft, Nvidia, and Alphabet. The U.S. equity trend has been characterized by strong innovation, corporate profitability, and deep capital markets. However, valuation concerns and interest rate sensitivity remain key challenges going forward.
b. Europe
European equities have underperformed relative to the U.S., primarily due to slower economic growth, demographic challenges, and political fragmentation. Nonetheless, markets like Germany, France, and the Netherlands remain strong in industrials, luxury goods, and renewable energy. The United Kingdom, post-Brexit, has experienced both volatility and opportunity, particularly in financial services and energy sectors.
c. Asia-Pacific
Asia has emerged as the growth engine of global equities. China, Japan, India, and South Korea have become crucial drivers of market performance. China’s rise was spectacular through the 2010s, led by technology and manufacturing. However, recent regulatory crackdowns and real estate sector weakness have slowed momentum. India, in contrast, has become a standout performer, attracting foreign investment through policy reforms, a booming startup ecosystem, and a rapidly growing consumer base. Japan’s renewed corporate reforms and governance improvements have also revitalized investor confidence.
d. Emerging Markets
Emerging market equities offer diversification and high growth potential but are prone to volatility. Latin America, Africa, and Southeast Asia have benefited from commodity booms and favorable demographics, though they remain exposed to currency risk, political instability, and inflation. The long-term outlook remains promising, especially for economies focusing on industrialization and digital innovation.
4. Sectoral Shifts in Global Equities
Equity trends are increasingly defined by sectoral transformations:
a. Technology Dominance
The technology sector continues to lead global equity growth. Artificial intelligence, cloud computing, semiconductors, and digital platforms have driven exponential gains. Companies like Apple, Microsoft, Amazon, and Nvidia dominate global valuations. The “tech megatrend” is supported by ongoing digitalization across industries, making technology not just a sector, but the foundation of modern economic growth.
b. Renewable Energy and ESG Investing
Environmental, Social, and Governance (ESG) principles have reshaped global equity allocations. Investors now prioritize sustainability, clean energy, and ethical governance. Renewable energy companies—solar, wind, and electric vehicle producers—are gaining prominence. ESG-themed ETFs and funds are attracting trillions in inflows, transforming how corporations are valued and managed.
c. Healthcare and Biotechnology
The pandemic accelerated investment in healthcare innovation. Biotechnology, telemedicine, and pharmaceutical research have become vital equity themes. Aging populations in developed nations and rising healthcare demand in emerging markets continue to drive this sector’s growth trajectory.
d. Financial Services Transformation
The financial sector is evolving with the rise of fintech, digital banking, and blockchain technology. Traditional banks face disruption from agile startups offering digital wallets, online lending, and decentralized finance (DeFi). Nonetheless, rising interest rates have revived profitability for major banks, especially in the U.S. and Europe.
e. Commodities and Industrials
With global infrastructure spending increasing, industrial and commodity-related equities are regaining attention. Energy transition metals like lithium, copper, and nickel are vital to the EV revolution, attracting investors seeking exposure to the “green economy.”
5. The Role of Institutional and Retail Investors
The composition of equity investors has transformed dramatically. Institutional investors—pension funds, sovereign wealth funds, and mutual funds—continue to dominate in size, but retail participation has surged. The rise of zero-commission trading platforms and social investing communities has empowered individuals globally.
The “meme stock” phenomenon of 2021, driven by platforms like Reddit, demonstrated the influence of retail investors. Meanwhile, institutional investors are increasingly adopting quantitative and algorithmic strategies, relying on big data and AI for trading decisions. This blend of technology and democratization has increased liquidity but also amplified short-term volatility.
6. Globalization, Integration, and Interdependence
Equity markets today are more interconnected than ever. A policy shift by the U.S. Federal Reserve can ripple through Asia and Europe within hours. Cross-border listings, dual-traded stocks, and global ETFs have deepened financial integration. However, this interconnectedness also increases systemic risk. Global crises—whether economic, geopolitical, or environmental—can trigger synchronized market reactions.
At the same time, globalization has led to the rise of multinational corporations whose revenues are not confined to domestic borders. For example, companies like Apple, Nestlé, and Samsung derive the majority of their income from international markets, blurring the line between “local” and “global” equities.
7. Impact of Geopolitical and Economic Factors
Geopolitical tensions significantly influence equity trends. The U.S.–China trade war, the Russia-Ukraine conflict, and Middle East instability all shape investor sentiment. Sanctions, supply chain disruptions, and shifts in energy policy affect specific sectors and regional equities.
Macroeconomic policies also play a central role. Inflation trends, interest rate decisions, and fiscal spending directly impact equity valuations. Central banks, particularly the U.S. Federal Reserve and the European Central Bank, are the key arbiters of global liquidity. The transition from an era of cheap money (2010–2021) to a higher-rate environment post-2022 has reshaped risk appetite and capital flows.
8. Technological Innovation and Market Structure
Technology has transformed not only which companies succeed but also how markets function. High-frequency trading, blockchain-based settlement systems, and artificial intelligence-driven analysis are redefining efficiency and transparency. Global stock exchanges are embracing digital transformation to attract international listings and facilitate faster execution.
Decentralized trading platforms and tokenized assets may represent the next frontier. Although still in early stages, blockchain technology could one day enable direct trading of fractional equity shares globally without intermediaries, further expanding market accessibility.
9. ESG and Sustainable Investing as a Core Trend
ESG has moved from the periphery to the mainstream of equity investing. Investors are increasingly aware that sustainability reduces long-term risk and enhances resilience. Governments and regulators are enforcing stricter disclosure requirements on carbon emissions, labor practices, and governance standards. As a result, companies with strong ESG performance often enjoy lower capital costs and better investor confidence. The global shift toward green finance will continue to shape equity trends for decades.
10. Valuation Trends and Market Cycles
Valuation trends vary across regions and sectors. U.S. equities trade at relatively higher price-to-earnings ratios due to strong earnings growth expectations. European markets are generally undervalued, reflecting lower growth prospects but offering potential for value investors. Emerging markets often trade at discounts due to perceived risks but can deliver outsized returns during expansion cycles.
Market cycles—bull and bear phases—are natural in equities. After years of stimulus-driven bull markets, recent corrections have reintroduced discipline and selectivity. Investors are now focusing on fundamentals, earnings quality, and balance sheet strength rather than speculative momentum.
11. The Future of Global Equities
The next decade will likely bring both opportunities and disruptions. Key future trends include:
Artificial Intelligence and Automation: AI will revolutionize productivity, profit margins, and equity valuations across multiple sectors.
Decarbonization and Energy Transition: Companies aligned with net-zero goals will attract greater capital inflows.
Demographic Shifts: Aging populations in developed economies and youthful demographics in emerging nations will reshape consumption and investment patterns.
Financial Inclusion and Tokenization: Blockchain-based equity systems could make investing more accessible worldwide.
Reshoring and Supply Chain Realignment: As nations seek resilience over efficiency, industrial and logistics equities will see renewed focus.
The long-term outlook remains optimistic. Despite cyclical volatility, equities continue to outperform most asset classes over extended horizons due to innovation, productivity gains, and corporate adaptability.
12. Conclusion
Global equity trends mirror the evolution of the world economy itself—dynamic, interconnected, and resilient. From the dominance of U.S. technology firms to the rapid growth of Asian markets and the rise of ESG investing, equities reflect both opportunity and transformation.
Investors navigating this complex landscape must adapt to structural changes, remain diversified across regions and sectors, and embrace innovation while managing risk. As globalization, technology, and sustainability redefine economic priorities, global equity markets will continue to be the central pillar of wealth creation, capital formation, and economic progress in the 21st century.
COAI Price Rallies 96%— Yet Rug Pull Warnings Surface, Why?COAI’s 96% rally in a single day would normally be viewed as bullish momentum. Yet, in this case, the rapid climb may signal speculative excess rather than genuine growth. The speed of the rise is amplifying concerns about the sustainability of its valuation.
The concentration of supply and inflated demand indicate that COAI could face a steep correction. If selling pressure emerges, the price could drop from $16 to $5 almost instantly, erasing most of the recent gains.
Conversely, if the top wallets refrain from offloading their holdings, COAI could extend its rally beyond $21. Sustained confidence could even push the token toward its all-time high of $48, though the risk of collapse remains significant.

$COAI – Bullish Reversal in Play?ChainOpera AI ($COAI) is redefining how artificial intelligence meets blockchain — delivering seamless, secure smart contract execution powered by AI-driven infrastructure. As the crypto market leans deeper into the AI narrative, COAI stands out as a frontrunner blending intelligence with decentralization.
The team behind ChainOpera_AI is building an AI-driven foundation for decentralized computation and synthetic agents — a true next-gen leap for Web3.
TECHNICAL OUTLOOK:
ChainOpera AI is flashing a bullish reversal setup on the 2-hour chart.
After rebounding from the $4.40 demand zone, the price shows potential for a retest toward the $9–$10.5 range.
If we get a rejection at that level, the price could retrace back toward the $4–$2 area.

Coai Give us a short liquidation entry This is a long trade, for thoses confused by the title.
In at 5.
Sell off at 5.487
5.887 or more.
MY sell of is 75% at 0,5688 and i keeep the rest until satisfaction

COAIInteresting project and also very interesting position for trade, huge correction and who knows, maybe good opportunity for a long position...
lets see, i think this will try to stabilize and slowly moving up...
trade carefully with such projects
nfa
dyor

COAI short idea?? Coai has been non stop pumping,
The chart shows a bearish divergence and a retrace to a breakout.
This is for educational purpose only.

3x this OctoberMarket setups across several mid-cap altcoins are showing early signs of strength heading into October. Technical structures across a few emerging altcoins suggest a potential 3x window in October. Detailed analysis here:
www.cointrust.com
COAIUSDT 3-Drive Pattern in Motion 88x Journey Underway Altcoins are reminding every doubter what altseason truly looks like.
COAI is currently one of the standout performers, unfolding a Cup & Handle breakout and now forming a 3-Drive bullish pattern that could complete a potential 88x move from base to target.
• Cup & Handle breakout confirmed ✅
• Drive 1 fully completed
• Drive 2 unfolding — targeting $6.968 (~5× extension of C&H)
• Short-term correction expected into the Demand Area before the next impulse
• Drive 3 projection between $10 – $12, completing the full 88× rally zone
Trading Plan:
• Now: Ride Drive 2 toward $6.968
• Next: Take profits and wait for the correction
• Then: Reload from the Demand Area for Drive 3 continuation
• Invalidation: Deep close below the Demand Area cancels Drive 3 projection
Patience is key don’t chase the Drive 2 topside. Let structure confirm before the next wave.
What do you think about this setup are you positioning early or waiting for Drive 3?
If you find this analysis helpful, like, share, and drop your thoughts in the comment section!

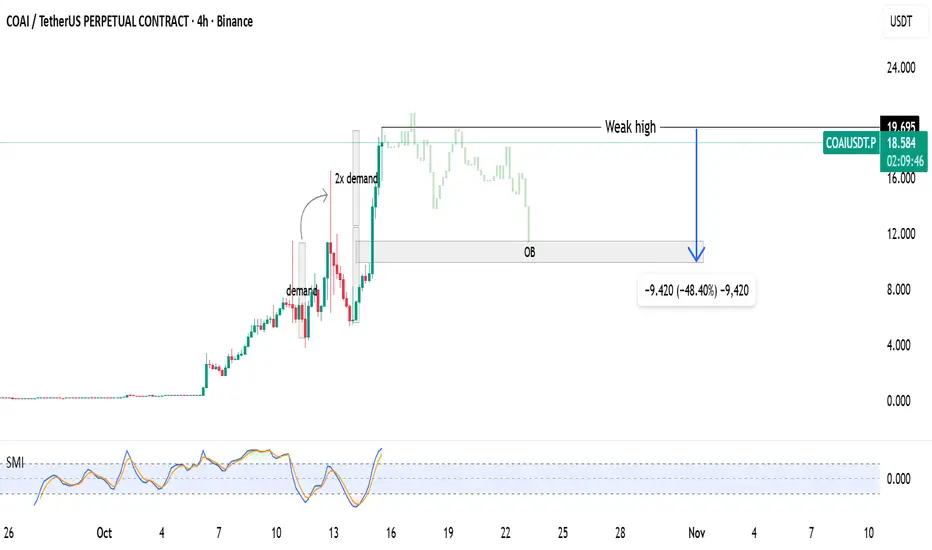
COAI — the most manipulated coin on the market
Pair: COAIUSDT.P (perps)
Bias: Short (tactical)
Thesis TL;DR: Timeline is flashing classic manipulation tells—crowded leverage, public pleas to delist, an “unknown wallet” repeatedly selling into rips, and whipsaw liquidations both sides. I’m fading spikes into prior ATH supply with tight invalidation and scale-out targets.
Why this is a “manipulation” setup (from social timeline)
Open manipulation meme: “PAWNZI” label and multiple posts calling COAI a casino-like gamble.
Crowded leverage: Repeated notes of huge liquidations on both sides and a callout that a mass liquidation triggers near $5.83 if price nukes.
Smart seller behavior: “Unknown wallet” reportedly sells repeatedly into strength, trapping late buyers.
Public escalation: Users tagging @CZ_Binance and demanding review/delist for “price manipulation.”
Behavioral fuel: Screenshots of 292x PnL and regret posts (airdrops sold “too early” → FOMO) stoke late momentum buyers—perfect exit liquidity.
Failed short triggers: Traders trying to frontrun the short got chopped/stopped BE multiple times—signals engineered liquidity hunts before the real move.
Levels I care about
Short interest zone: $6.90–$7.20 (prior ATH pocket / squeeze fuel). Expect wicks.
Momentum pivot: $6.50 — loss/reclaim flips intraday bias.
Liquidation magnet: $5.83 (widely-circulated “mass liq” level = honey pot).
Deeper shelves: $5.60 and $5.20 — prior reaction zones where trapped longs may puke.
Trade plan (short bias)
Entry: Scale $6.90 → $7.20 on spikes; add on 15–60m structure breakdown below $6.50.
Invalidation: 4H close > $7.50 (acceptance above prior high = out, no debate).
Targets:
T1: $6.10 (first shelf; take partials, pay yourself)
T2: $5.83 (liquidation cluster—expect violent reaction)
T3: $5.60 → stretch to $5.20 if momentum accelerates
Risk: Size so that full-stop loss = ~1% account risk. If we wick >$7.35 and snap back in-range, I’ll re-engage with smaller size.
Execution notes:
Expect engineered squeezes before any trend. Let price tag your zone—don’t chase.
If $6.90 is reclaimed after a breakdown, reduce risk—possible bear trap/reset.
Watch perp funding/OI — extreme positive funding into resistance = better fade.
Narrative context (why fade)
The public narrative is doing the heavy lifting: casino vibes, “unknown wallet” selling into pumps, and open calls for Binance action.
Retail euphoria (292x screenshots, airdrop regret posts) provides late long fuel.
If the crowd is staring at $5.83 as the “big liq,” market often hunts it—either as a clean flush or a spoofed front-run to trap shorts. I’ll manage partials proactively there.

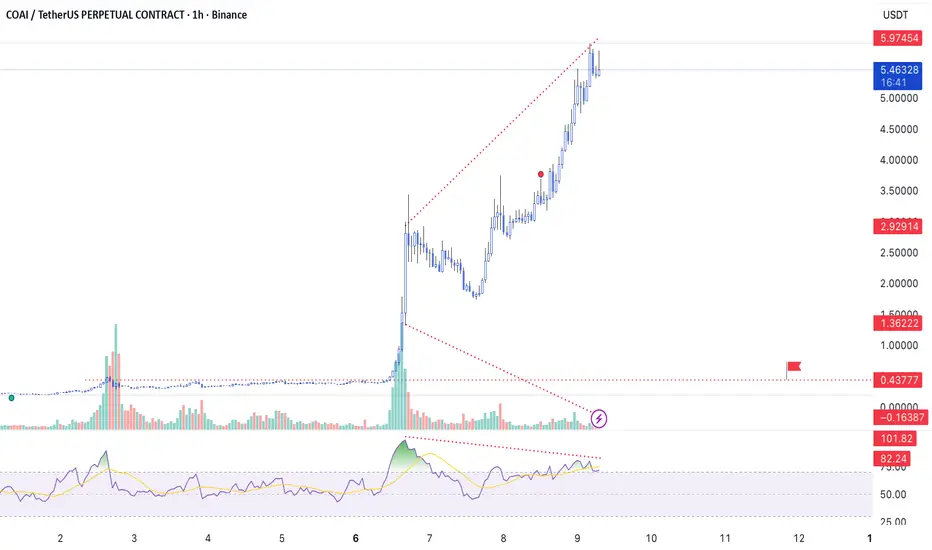
COAI - It's time!Dear My Friends,
🧭 Trend Overview
Current Trend: Strong uptrend (parabolic move) – the price has surged vertically from around 1.3 → 5.7 USDT within just a few days.
Observation: A long upper wick candle has appeared at the top, indicating that profit-taking pressure is starting to emerge.
Volume: Trading volume is declining while price continues to rise, showing signs of bearish volume divergence, which warns of a potential trend reversal.
📊 RSI & Momentum Analysis
On the 1-hour timeframe, the RSI is currently in the overbought zone (above 80) → indicating high correction risk.
There are signs of bearish divergence between price and RSI:
🔺 Price forms higher highs
🔻 RSI forms lower highs
→ This is a short-term top warning signal.
🎯 Strategic Outlook
→ Avoid FOMO buying at the current price zone, as the correction risk is high.
→ If you’re already holding a long position, consider using a trailing stop or taking partial profits around 5.7 – 6.0 USDT.
For futures traders:
→ You may look for a light short entry around 5.8 – 6.0 USDT.
💡 Conclusion
COAI is currently in the final euphoric phase of its uptrend, showing signs of bearish divergence and weakening volume, which suggests a high probability of an upcoming correction phase.
COAI DID ONE OF THE BEST INCREASES - NEXT ONE AVL:USDTChainOpera AI (AI/USDT) — From Our First Scan to Explosive Gains 🚀
We first scanned ChainOpera AI at just $0.38, and since then it has delivered an incredible surge, reaching new highs above $4.00+ — a massive performance move backed by strong momentum and trend continuation.
📈 Our First Scan: $0.38
💥 Current Levels: $4.32
🔥 Gain: +1000%+
The same technical setup and market structure now appear to be forming on AVL/USDT, showing early signs of accumulation and breakout potential similar to what ChainOpera AI showed before its explosive run.
