Gold Eyes $3,700 Amid Overbought SignalsGold broke out of a multi-month trading range when the spot price finally cleared resistance around $3,450. It took some time for the ascending triangle to play out, and this could mean gold is now on its way towards $3,700. However, the metal has quickly reached overbought levels and may be due for a pause.
Breaking Out
The breakout could be significant and may trigger a move to much higher levels over time; it just doesn’t mean it will all happen at once. One way to measure the breakout from the ascending triangle pattern suggests the precious metal could climb to about $3,700.
The relative strength index also confirms the breakout, rising above a downtrend that had formed between April and August. The rise above the trend line on the RSI confirms the breakout and signals that the consolidation period has ended.
Overbought
However, the precious metal did not take long to reach overbought levels, with its value rising above the upper Bollinger Band and the relative strength index climbing over 70. This could mean that gold is due for a pause—a period of sideways consolidation—before moving on to higher prices.
It could also suggest that the metal is about to run out of steam, having expended too much energy breaking out of the consolidation range, and may be due for a sharp pullback to $3,440 to retest the breakout, or even a decline towards the lower Bollinger Band near $3,200.
Written by Michael J. Kramer, founder of Mott Capital Management.
Disclaimer: CMC Markets is an execution-only service provider. The material (whether or not it states any opinions) is for general information purposes only and does not take into account your personal circumstances or objectives. Nothing in this material is (or should be considered to be) financial, investment or other advice on which reliance should be placed.
No opinion given in the material constitutes a recommendation by CMC Markets or the author that any particular investment, security, transaction, or investment strategy is suitable for any specific person. The material has not been prepared in accordance with legal requirements designed to promote the independence of investment research. Although we are not specifically prevented from dealing before providing this material, we do not seek to take advantage of the material prior to its dissemination.
1OT1! trade ideas

A Gold/GLD Drop Scenario You Should Not IgnoreSometimes you don't need a ton of information.
Sometimes, it's just the right moment when a few facts come together, and you make up your mind.
That's the case now with Gold for me.
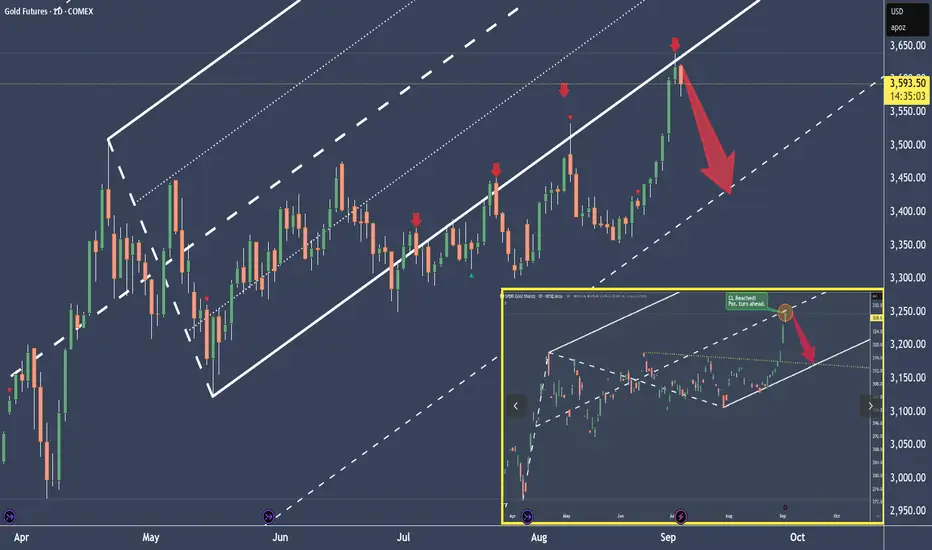
We know that the behavior changed when Gold left the Fork in July.
We also know that if price leaves a Fork, it's highly possible we’ll see a test/re-test at the L-MLH, the lower median line parallel.
Additionally, Allan H. Andrews, the inventor of the Median Lines/Forks, wrote back then that price could also crawl along the parallel line for a longer period. And if price can't manage to jump back into the Fork—regaining the trajectory of the slope—it will trade in the opposite direction sooner or later.
Last but not least: I checked GLD too. Surprisingly it reached the Centerline just yesterday (See screenshot in the right lower corner of the Chart). So price has a high tendency to turn in the opposite direction when balanced again.
So, there you have it.
I’m planning a short, with profits at the WL as my first target.
But what if it goes wrong, if price climbs higher?
Well, then I’ll probably get stopped out, which is nothing more than part of this business.
Any questions?
Don't hesitate to ask me. It's the only way humans learn—by asking questions.
Cheers
§8-)
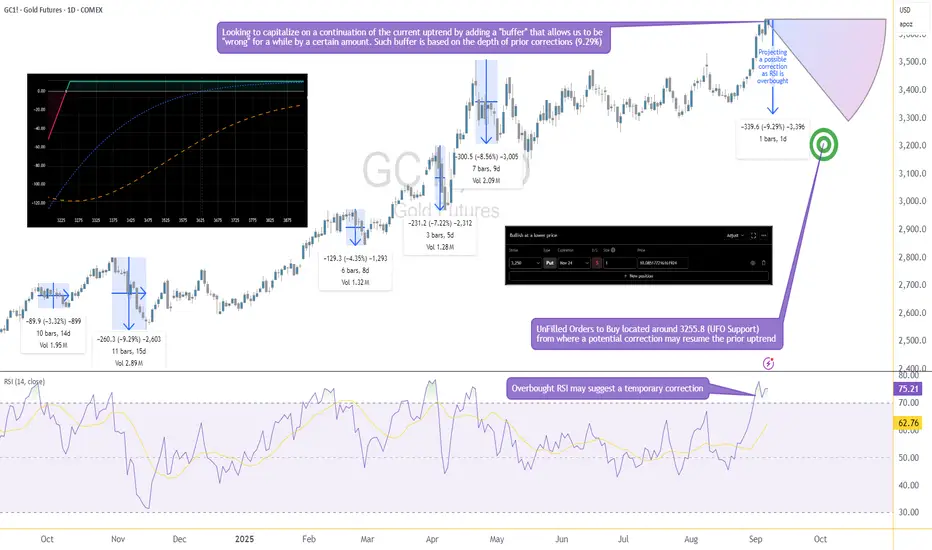
Options Blueprint Series [Basic]: Gold Income or Bargain Entry?The Setup: A Pullback with a Plan
Gold has been riding a strong bullish wave, yet momentum indicators suggest it's time for a breather. RSI is now overbought, and if history repeats, we could see a healthy correction of up to 9.29%, in line with prior pullbacks. This projects price near 3255, where we also find a cluster of UnFilled Orders (UFOs) acting as a potentially relevant support. It’s a key price area where buyers may step in again.
Rather than try to perfectly time the correction or the bottom, we’re applying a more forgiving approach: selling a PUT far below current price—generating income while leaving room to be wrong by over 375 points.
This is not a hedge. This is a standalone income strategy that accepts risk but frames it intelligently using technical context and options structure.
The Strategy: Selling the 3250 PUT on GC
We're using a simple but powerful strategy—selling a naked PUT—which can generate income or result in ownership of Gold at a deep discount if price dips.
Underlying Asset: GCZ2025 – using Gold Futures Options (Nov 24 2025 Expiration)
Strategy: Sell 1x 3250 PUT
Premium Collected: 10.09 points ≈ $1,009
Breakeven Price: 3240
Max Profit: $1,009 (if Gold stays above 3250 until expiration)
Max Risk: Unlimited below breakeven
There are two possible outcomes here:
Gold stays above 3250 → we keep the full premium.
Gold drops below 3250 → we get assigned and become long GC at 3250. From there, we’re exposed to downside risk in Gold, with a breakeven at 3240.
The position benefits from time decay and stable to rising prices, but it does carry the full downside exposure of long Gold futures if the trade moves against us.
We want to be very clear here—this is a naked trade with undefined risk. That doesn’t make it reckless if done with sizing discipline and technical alignment, but it’s not a beginner-friendly strategy.
Gold Contract Specs
Understanding the size and risk of what you're trading is critical—especially with naked options.
✅ GC – Gold Futures (Full Size)
Symbol: GC
Contract Size: 100 troy ounces
Tick Size: 0.10 = $10
Point Value: 1 point = $100
Initial Margin (as of Sep 2025): ~$15,000 per contract (subject to change)
Underlying for the Option: GC Futures
✅ MGC – Micro Gold Futures
Symbol: MGC
Contract Size: 10 troy ounces
Tick Size: 0.10 = $1
Point Value: 1 point = $10
Initial Margin: ~$1,500 per contract (subject to change)
Why does this matter?
Because if GC collapses below 3250 and you're assigned long, you’ll be exposed to full-size futures. That’s $100 per point of movement. A 50-point drop? That's $5,000 in unrealized loss.
That’s where MGC becomes your best ally. Micro Gold futures offer a scalable way to hedge. If price begins moving down or breaks below the support zone, one could short MGC against the Short GC 3250 PUT to cap further losses or rebalance directional exposure with reduced size and margin impact.
The Technical Confluence: Where Structure Meets Strategy
The 3250 strike isn’t just a random number—it’s calculated. Historical RSI-based corrections in Gold have shown recent worse-case scenarios around 9.29%, and projecting that from recent highs lands us precisely near the 3255 zone. This level also aligns with a clear UFO support, where institutional buyers have likely left behind unfilled orders.
That confluence—statistical retracement, technical indicator, and order flow support—gives the 3250 strike an interesting probability structure. Selling a Put beneath it means we are placing our bet below the “floor” and getting paid while we wait.
If Gold never corrects that far, we profit.
If it does, we might get long near a historically meaningful level.
There’s no need to catch the top. There’s no need to nail the bottom.
Just structure the trade where the odds are already potentially skewed in your favor.
Trade Plan: Reward, Risk & Realism
This trade isn’t about precision entry or leveraged glory—it’s about risk-defined logic with a cash-flow twist. Here's the full breakdown:
🧠 Trade Parameters
Strategy: Sell 1x Gold Futures 3250 PUT Options
Premium Collected: 10.09 points = $1,009
Point Value (GC): $100/point
Breakeven Price: 3240 (3250 – 10)
Expiration: Nov 24, 2025
🟩 If Gold Stays Above 3250
You keep the full premium → $1,009 profit
🟥 If Gold Falls Below 3250
You may be assigned 1 GC contra<ct long at 3250
Unrealized losses begin below breakeven (3240)
Losses can be significant if Gold falls aggressively
⚠️ Reward-to-Risk?
Reward is capped at $1,009
Risk is unlimited below breakeven
The trade only makes sense if you're prepared to own Gold, or hedge dynamically via MGC or using any other technique
This isn’t a “set-and-forget” income play—it’s a calculated entry into a structured exposure with a fallback plan.
Risk Management: No Margin for Error
Selling naked options isn’t “free money.” It’s responsibility wrapped in premium. Here's what must be considered:
❗ Undefined Risk
When you sell a naked PUT, you're exposed to the full downside. If Gold drops $100 below your strike, that’s a $10,000 loss. Don’t sell naked options unless you’re ready—and capitalized—to buy the underlying or actively hedge it.
🔄 Use MGC to Hedge
If Gold breaks below 3250, using Micro Gold Futures (MGC) offers a surgical way to hedge risk without overleveraging. A simple short MGC can offset GC losses proportionally, depending on how aggressive the move becomes.
🧮 Precision Matters
Avoid entering trades too early or too large.
Place an “invalidation” point: if price violates the support zone with conviction, reduce or hedge exposure.
Never sell premium just because it’s “high”—sell where structure backs the trade.
📊 Discipline Trumps Direction
This strategy is valid only if risk is respected. The market doesn’t owe anyone consistency—but a structured, risk-controlled approach keeps you in the game long enough to see it.
When charting futures, the data provided could be delayed. Traders working with the ticker symbols discussed in this idea may prefer to use CME Group real-time data plan on TradingView: www.tradingview.com - This consideration is particularly important for shorter-term traders, whereas it may be less critical for those focused on longer-term trading strategies.
General Disclaimer:
The trade ideas presented herein are solely for illustrative purposes forming a part of a case study intended to demonstrate key principles in risk management within the context of the specific market scenarios discussed. These ideas are not to be interpreted as investment recommendations or financial advice. They do not endorse or promote any specific trading strategies, financial products, or services. The information provided is based on data believed to be reliable; however, its accuracy or completeness cannot be guaranteed. Trading in financial markets involves risks, including the potential loss of principal. Each individual should conduct their own research and consult with professional financial advisors before making any investment decisions. The author or publisher of this content bears no responsibility for any actions taken based on the information provided or for any resultant financial or other losses.
New Week on Gold and we could continue strong!Im looking for price to give more indication on what it wants to do but we are bullish until proven otherwise. for now its is not in a position that I would like to enter cause it can go either way. All moves are scalps untill we get some more breaks on levels.

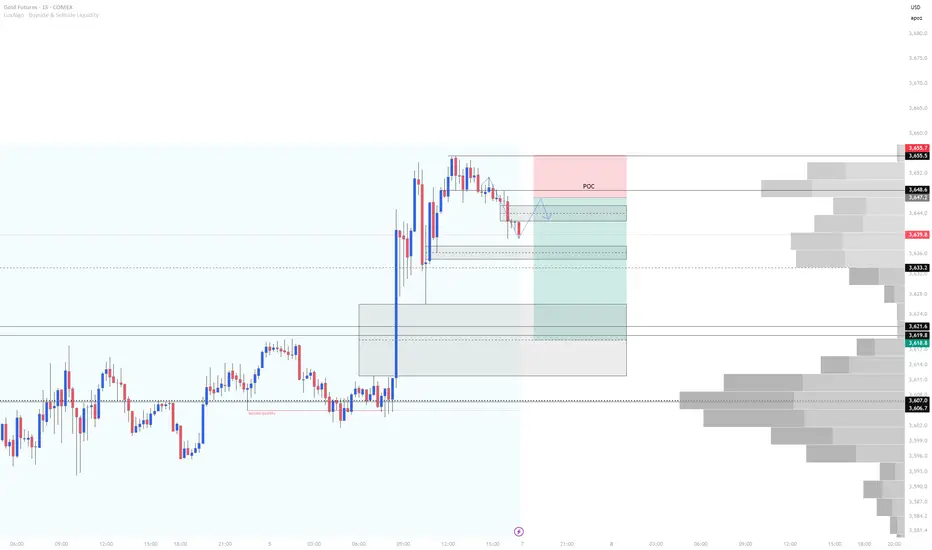
Gold Futures Short Into Asia 9/7/25Based on the current Fair Value Gap (FVG), Order Block (OB), and the liquidity resting below, I anticipate gold will retrace toward the Point of Control (POC) identified on the volume profile. This would provide an ideal setup for short-term selling opportunities during tonight’s PM session.
My expectation is for price to open lower, push into the 3658 range, and present a bearish entry signal. From there, I’ll be targeting shorts toward the equilibrium of the FVG around 3619, which also aligns closely with previous session highs and lows—adding confluence to the setup.
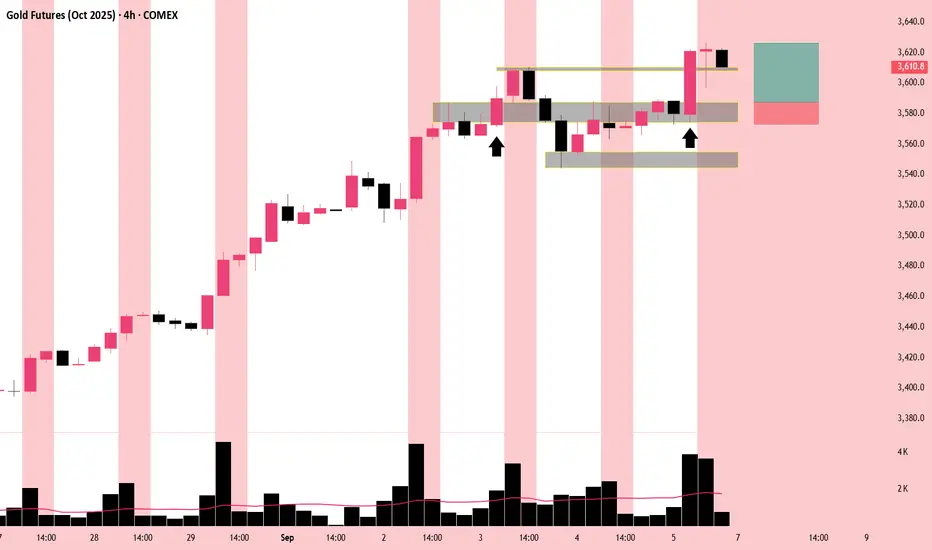
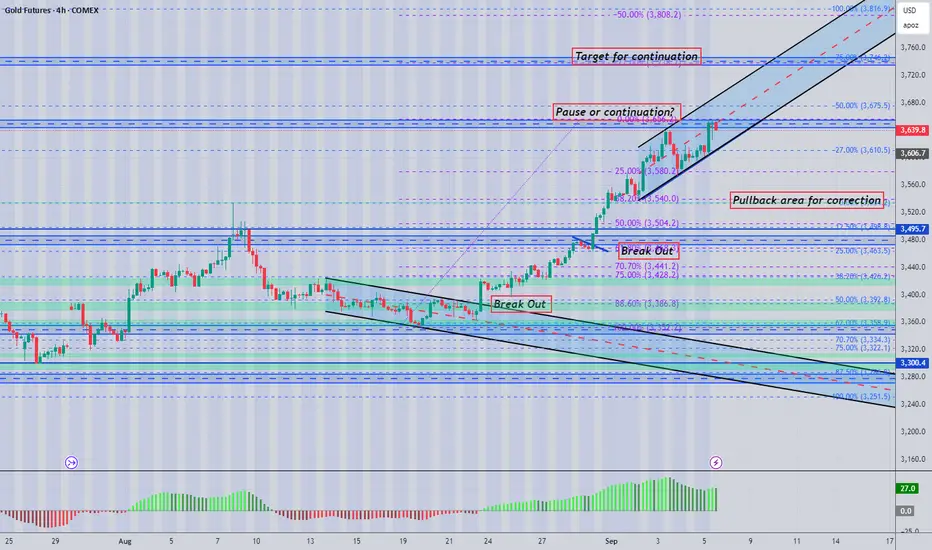
GC 4H icc analysisGold has been in a clear uptrend and ran into resistance between 3574.6/3587.9. Price broke the zone and indicated that sellers were weak above 3587.9, continued to climb making a new high before correcting back below the zone. Once price hit a support, it continued back above 3587.9 aggressively making a new indication and a new high.
Entry: around 3587.9 (after reversal confirmation on 1 hour)
Stop loss: Below last low
Target: Last swing high
Not financial advice.
gold futures analysis past weeks and upcoming weekshowing how gold broke out of long term range and what it may do next

Gold favors buyers between 3570 and 3800 for this next weekLooking at the weekly close gold for the 2nd week in September favors bulls between 3570 and 3800

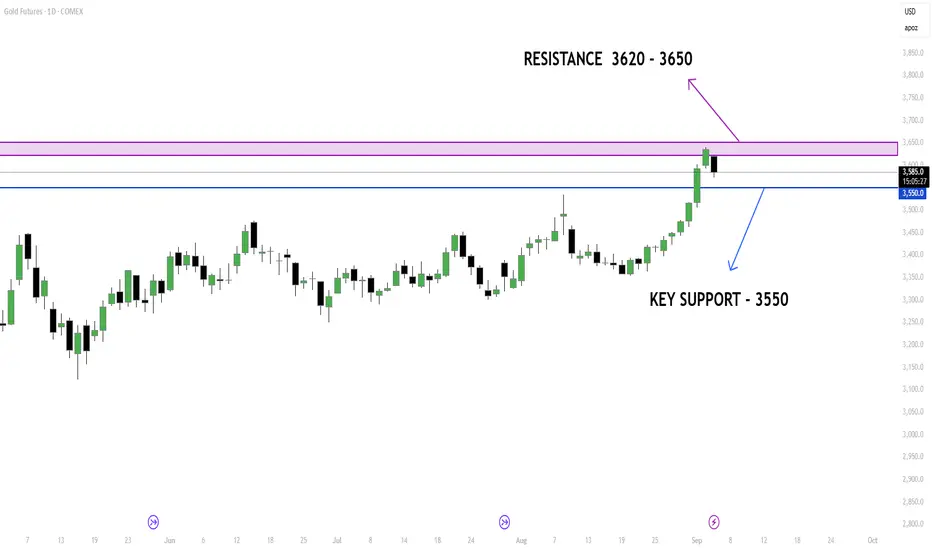
Gold Futures (GC1!) UpdateCurrent Price: ~$3,588
Gold recently broke out to new highs but is now pulling back after a sharp rally.
✅ Bullish Case
* Trend is still strong overall (higher highs & higher lows).
* If price holds above $3,550–$3,570, bulls may push for a retest of $3,620–$3,650.
❌ Bearish Case
*If gold breaks below $3,550, a deeper pullback toward $3,480–$3,450 is possible.
🎯 Takeaway
* Short-term pullback after a strong run.
* Key support = $3,550 zone.
* Watch for a bounce to confirm continuation, or a break lower for correction.
📝 Quick Chart Guide for Newbies
* Candlesticks: Green = price went up, Black = price went down.
* Trend: Gold has been trending up since late 2024 (higher peaks & dips).
* Resistance: Around $3,620–$3,650 (where sellers step in).
* Key Support: Around $3,550 (where buyers step in).
👉 In simple terms: Gold is still bullish, but needs to stay above $3,550 to keep momentum.
👉 What’s your bias? Long continuation or short-term pullback?
Don't forget to drop your comments/ideas, boost the post, and follow me for more updates!
-Neo
Gold thoughts after strong week A breakout on Gold and everyone remains a buyer of the dips
I have mapped out key levels, at these levels look for a setup for next move .
good luck
MGC WEEK 37 SEPT 7TH USD look to be bearish and is likely to run for higher TF equal lows.
- That being said MGC can take a small pullback and give another leg higher
if price drops below 3620 the you are offside and should be looking for lower prices and a retracement.
Gold Should Find its Correction at the Level of 108500As Per My Analysis.
Gold Should Find its ATH @ 108500
and should Start Correction from this Point.
1st support Level is 101500
and if It breaks this it should find Support @ 95000
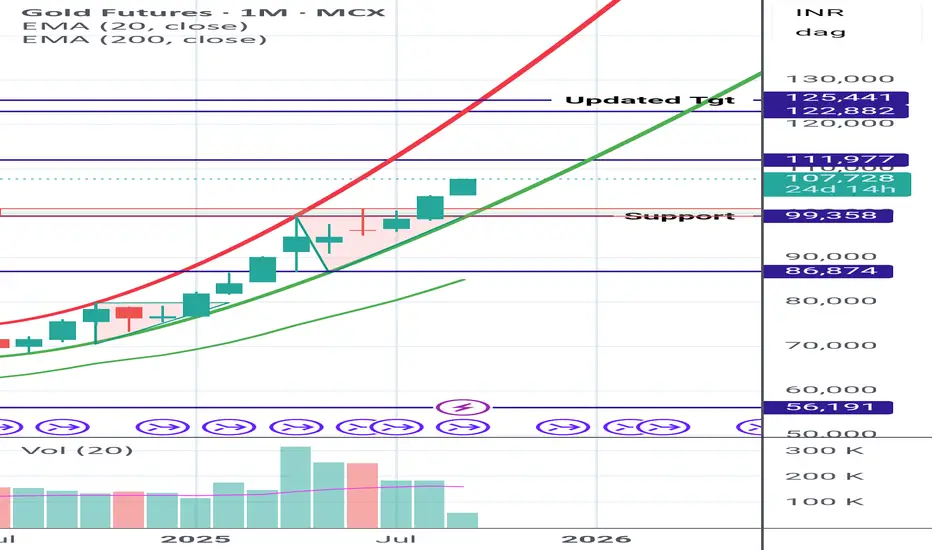
Gold Futures - Going to be a Dream for Many Gold : Going to be a Dream for Many.
*Gold Not to be Sold*✨✨
Support and Updated Tgt are marked in Chart itself.
Note : This is my Personal view based on chart pattern and My STUDY.
Kindly do your research and don't get biased by my view
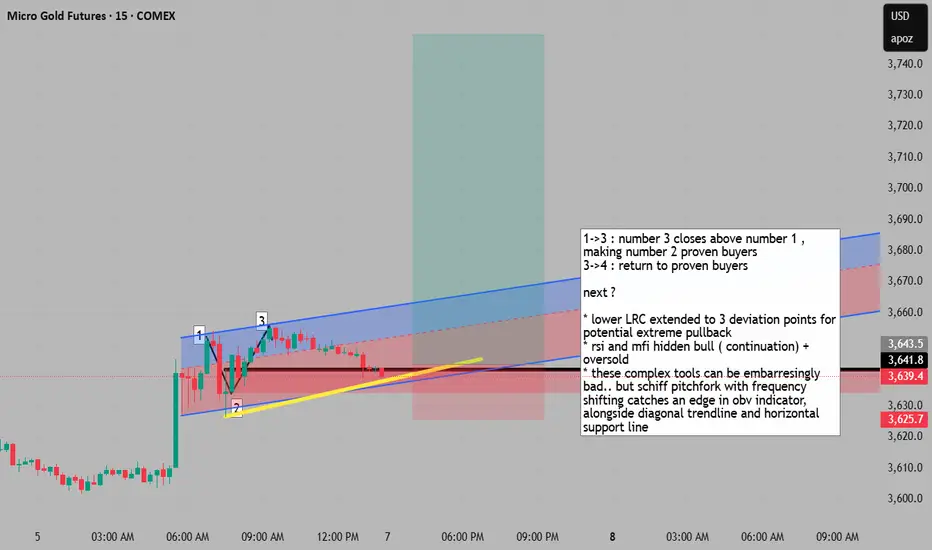
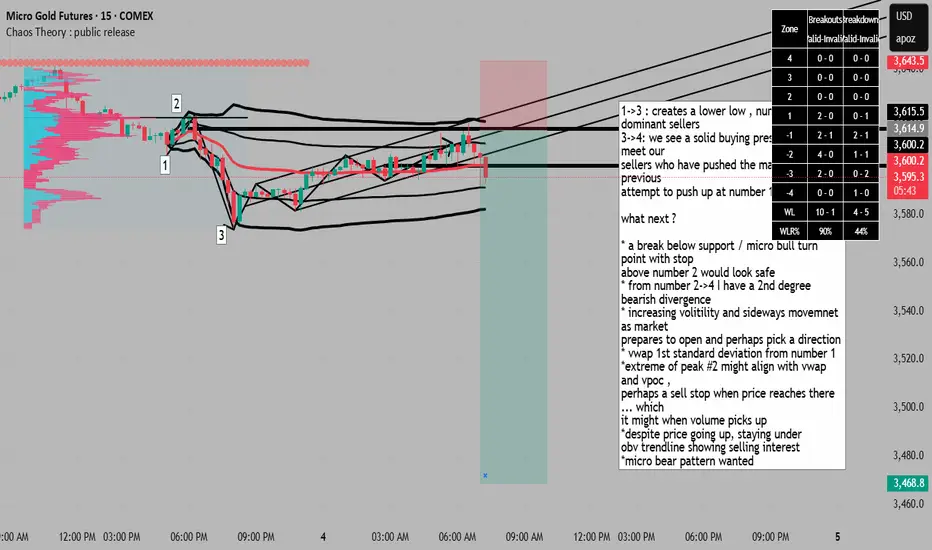
gold is at the edge of pullback if structure is correct 1->3 : number 3 closes above number 1 ,
making number 2 proven buyers
3->4 : return to proven buyers
next ?
* lower LRC extended to 3 deviation points for
potential extreme pullback
* rsi and mfi hidden bull ( continuation) + oversold
* these complex tools can be embarresingly
bad.. but schiff pitchfork with frequency
shifting catches an edge in obv indicator, alongside diagonal trendline and horizontal support line
GOLDAtm gold have nicely rejected from 4hr FVG, there is a setup for short. But can't ruled out that there is a possible another scenario as well. Gold for a long time is in bullish trend. I might going try to short if price will breaks out of current uptrend channel. This week we have some news coming out , so it could be quite volatile price action. Stay safe
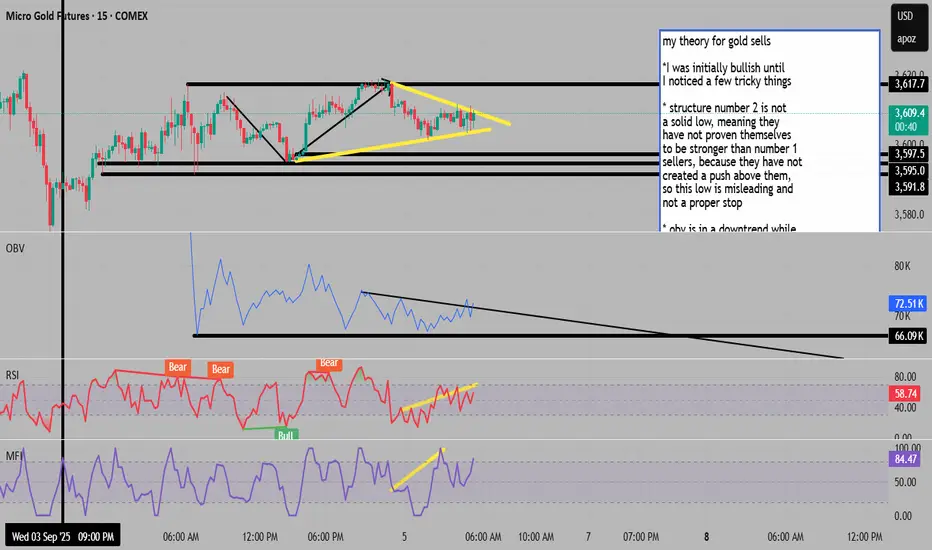
buyers are being setup for a trap , it seems obvious but dontmy theory for gold sells
*I was initially bullish until
I noticed a few tricky things
* structure number 2 is not
a solid low, meaning they
have not proven themselves
to be stronger than number 1
sellers, because they have not
created a push above them,
so this low is misleading and
not a proper stop
* obv is in a downtrend while
price is in an uptrend, obv
in downtrend means that there
is an increased selling interest ,
so this diverging from price going
up can only mean .... there
are no buyers and price is not going up
due to a huge amount of buying power but the sellers are not pushing too hard in specific areas
* the 3 support lines are not solid support, in fact they are all wicks and 'fake lows'
* I dont have a solid stop to enter a short,
but all these things + divergence on rsi and mfi is just telling me that the obvious
buy trade might be a trap
XAUUSD 15mint chart An FVG is a price range where inefficient trading occurred, usually after a large move that caused the market to skip over price levels without proper two-way trading (i.e., not enough buying and selling).
It's typically identified using candlesticks by spotting a gap between one candle's wick and another, skipping over a middle candle's body.

WEEKLY LOOK AT GOLD FUTURES Chart speaks for its self - I know JP Morgan has a price target of $3675 by Q4 2025 and over $4000 by Q2 2026.
This is weekly chart and we're making a new high that very divergent.
So regardless what the investment bank that has paid billions in commodity fraud - I remain sceptical.
Nice trend line that we would be nice to revisit. Love to get long but this needs correction for me personally - its been a good run without a doubt.
So somewhere between 3150 and 3200 - Why could this happen? Because everyone and their dog is long. When everyone is in the same side of the boat? Every time.
The white line is the 200 Week MA.

Intraday Bearish Narrative – London Session (Gold Futures)Gold opened the London session under clear downside pressure, extending weakness from the prior U.S. session. After a strong rally into the 3619–3620 area, sellers regained control, forming lower highs and pressing price below the descending trendline (red dashed).
During London hours, attempts to recover above 3600–3606 failed, reinforcing the bearish bias. The current setup aligns with a sell-on-rally structure: price has retested the broken trendline and prior support-turned-resistance zone near 3610–3613, where sellers defended strongly.
As long as price holds below 3613, the bearish structure remains intact, with intraday downside targets layered at:
3593.5 (nearest support, minor liquidity pocket)
3569–3566 (London extension target, key demand zone)
3550–3548 (deeper measured move target if momentum accelerates).
Stops are well-placed above 3610–3613, invalidating the setup if buyers reclaim this supply zone.
📉 Bias: Bearish intraday continuation, favoring shorts beneath 3610–3613 with room for multiple downside liquidity sweeps into the mid-3500s.

return to proven sellers presents sell continuation could not post on time due to 10 post per day limit. I entered as per the drawing tool visualization.
1->3 : creates a lower low , number 2 are dominant sellers
3->4: we see a solid buying pressure coming to meet our
sellers who have pushed the market below the previous
attempt to push up at number 1
what next ?
* a break below support / micro bull turn point with stop
above number 2 would look safe
* from number 2->4 I have a 2nd degree bearish divergence
* increasing volitility and sideways movemnet as market
prepares to open and perhaps pick a direction
* vwap 1st standard deviation from number 1
*extreme of peak #2 might align with vwap and vpoc ,
perhaps a sell stop when price reaches there ... which
it might when volume picks up
*despite price going up, staying under
obv trendline showing selling interest
*micro bear pattern wanted
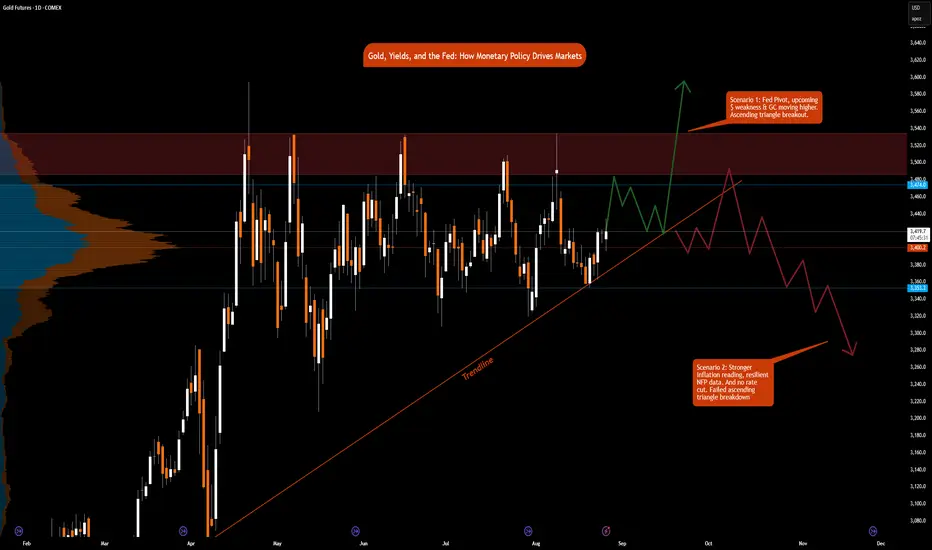
Gold, Yields, and the Fed: How Monetary Policy Drives Markets
Few forces shape global markets more than U.S. monetary policy. The Federal Reserve’s dual mandate, maximum employment and 2% inflation is the anchor for its decisions. For traders, understanding how these objectives translate into interest rate changes is critical for positioning in gold futures and across the yield curve.
The Fed’s Dual Mandate
1. Maximum Employment: Support jobs and minimize unemployment.
2. Stable Prices (2% inflation target): Prevent runaway inflation or deflation.
The Fed balances these goals using interest rates:
• Raising rates: Cools demand, strengthens the dollar, lifts yield, weighs on gold.
• Cutting rates: Stimulates demand, weakens the dollar, lowers real yields, supports gold.
The tension lies in the trade-off: controlling inflation often hurts employment, while boosting employment risks higher inflation.
Gold and Monetary Policy
Gold is highly sensitive to real interest rates (nominal yields minus inflation):
• Hawkish Fed: Higher real yields, dollar strength, gold struggles.
• Dovish Fed: Lower real yields, weaker dollar, gold rallies.
However, given the recent surge in gold prices despite higher rates, traders must ask:
• Will gold continue rising as odds of rate cuts increase, and when they are eventually delivered?
• Is the traditional correlation between the dollar and gold futures prices breaking down?
Gold’s rally has also been driven by geopolitical tensions and rising long term yields, reflecting rising debt burdens across the globe.
Yield Curve and Monetary Policy
The yield curve reflects expectations about growth, inflation, and Fed policy.
• Short end (1M–5Y): Anchored by Fed policy rates. If markets expect hikes/cuts, the front end moves first.
• Long end (10Y–30Y): Driven by expectations for long-term inflation, growth, and Treasury supply/demand dynamics.
Typically, investors and market participants watch for the following patterns:
• Inverted curve: Short yields > long yields, often a recession signal. See last year’s yield curve.
• Steepening curve: Usually follows Fed cuts, as front-end yields drop faster than the back end.
Two Classic Scenarios
Scenario 1: Inflation Stays High, Jobs Weaken
• Fed resists cutting, prioritizing price stability.
• Gold: Consolidates or weakens (real yields elevated).
• Yield curve: While the short end stays pinned, long end could rise on higher inflation risk and increasing debt worries, signaling stagflation risk.
Scenario 2: Inflation Stabilizes, Jobs Weaken
• Fed pivots dovish, prioritizing employment.
• Gold: Breaks higher on falling real yields.
• Yield curve: Steepens as short yields fall faster than long yields.
The Policy Backdrop
Powell’s last symposium before his term ends, at the Jackson Hole appearance, Fed Chair Powell delivered a dovish pivot, highlighting rising risks to the labor market while downplaying the inflationary effects of tariffs. The reasoning behind this shift deserves its own deep dive, but for now, our focus remains squarely on how monetary policy, specifically interest rate decisions, impacts inflation, growth, supply, and demand in the U.S. economy.
What’s on the Docket Until the Next Fed Meeting (September 17, 2025)
Markets will be glued to data in the coming weeks:
• Aug PCE / Core PCE (Aug 28–29) → Fed’s preferred inflation gauge.
• Aug NFP (Sep 5) → Labor market health; weak print strengthens the case for cuts.
• Aug PPI (Sep 10) → Upstream price pressures; hot numbers signal inflation risks.
• Aug CPI & Core CPI (Sep 11) → Key headline data; softer print supports dovish case.
• Fed Decision (Sep 17) → Will Powell stress inflation vigilance, or shift toward labor concerns?
How the Charts Tie It Together
• Gold Futures:
o Ascending Triangle breakout above resistance towards $3,600, if Fed pivots dovish and deliver a rate cut or a bigger rate cut.
o Ascending Triangle breakdown toward $3,350 if inflation remains sticky and the Fed holds. In this scenario, gold remains in balance overall.
• Yield Curve:
o Short end reacts directly to Fed rate expectations.
o Long end reflects investor conviction on inflation, growth and increasing debt concerns.
Takeaway for Traders
The Fed’s dual mandate creates a constant push and pull between inflation control and employment support. Gold and the yield curve are two of the clearest real-time mirrors of that balancing act:
• Watch short-term yields and gold to gauge how markets are pricing the Fed’s next move.
• Watch the long end of the curve to see whether investors believe inflation is truly anchored.
By linking economic data → Fed mandate → asset price response, traders gain a roadmap that works not just for this Fed meeting, but for every one that follows.
In our next educational blog we will briefly explore other policy tools used by the Fed i.e., QE and QT. Quantitative Easing and Quantitative Tightening.
FRED:FEDFUNDS ECONOMICS:USINTR
CME_MINI:ES1! CME_MINI:MNQ1! CME_MINI:NQ1! COMEX:GC1! MCX:GOLD1!
CBOT:ZB1! CBOT:ZN1!
Gold to 3750 (80% chance) A SetupThis is mere price action on weekly, and MACD indicator levels. It seems 3750 is target, and 3535 is strong support.
Gold MCX Bullish MoveGold as long as it is staying above the ichimoku cloud it can show a bullish move from here within a few days.. this month we can expect some movement on the upside clearing highs.
Stop loss can be kept near 94700-95300 levels with target of 102000 - 105000 with this month.
