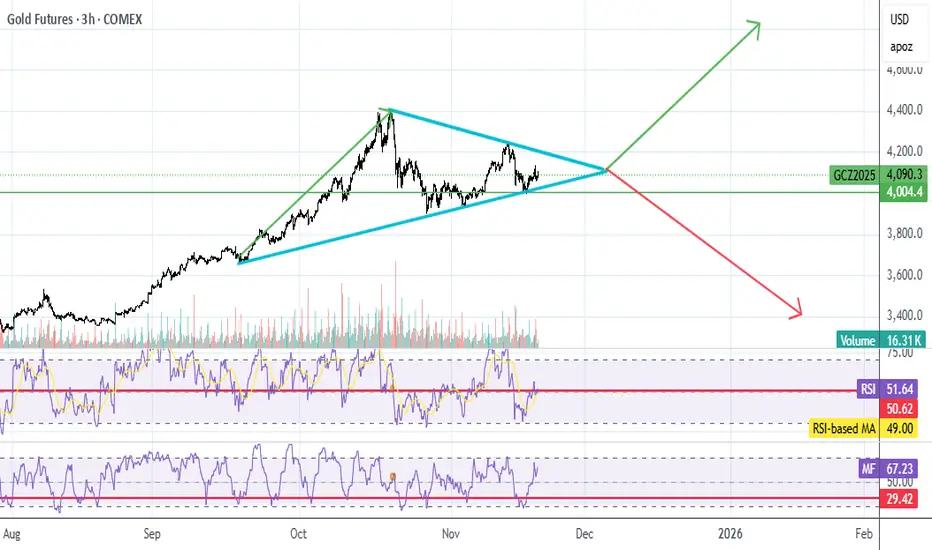
GC UpdateLooks to me like gold is forming a big pennant, more than likely a continuation pennant.
Certainly not acting like it;s topped out.
Trade ideas
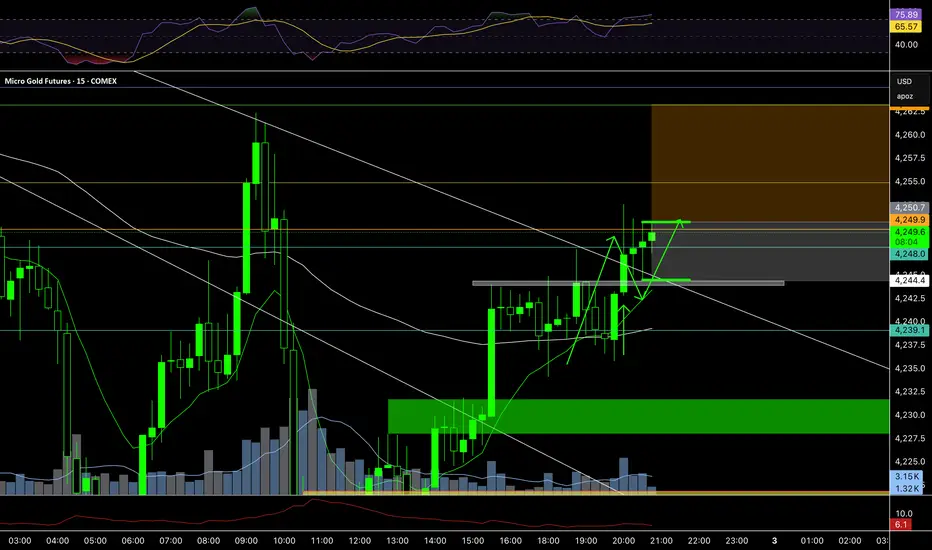
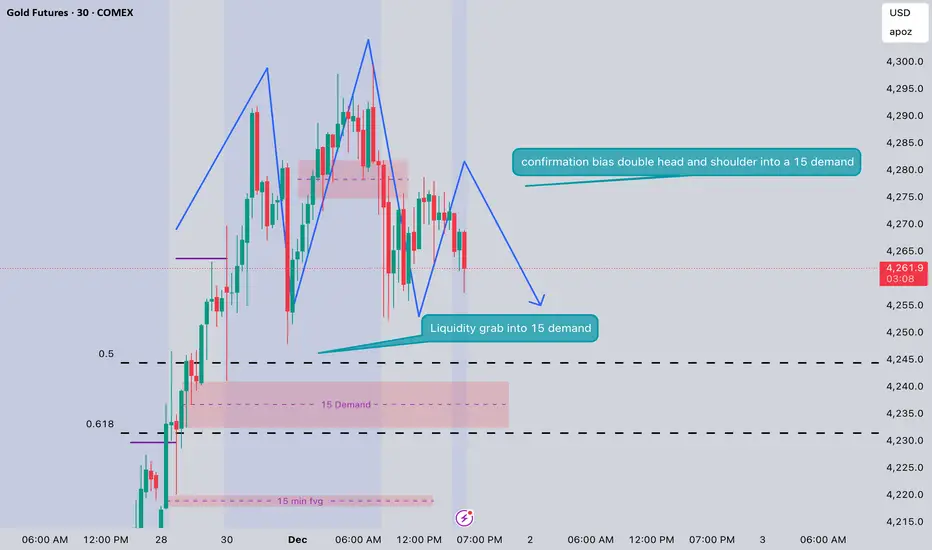
Gold Takes out Swing High??If we can break the previous resistance, Thad be in indication buyers are in control. A simple pullback off a 15m would be an ideal entry

Short Covering vs. New Money (Waiting for the Catalyst)COMEX:GC1! COMEX_MINI:MGCG2026 FOREXCOM:XAUUSD
Traders. Mid-week context check as we wait for institutional commitment.
Market Context (The Mechanical Bounce): As noted in the previous update, yesterday's rotation was driven by Short Covering—old money exiting profitable shorts—rather than Initiative Buying (New Money) entering fresh longs.
The Trap: Short covering can lift the auction, but it lacks the sustained energy to break new highs. We are seeing price drift without aggressive volume.
Inventory: We are currently balancing above the Previous Week High (PWH). This zone is holding, but the auction feels "heavy" without fresh inflows.
The Fundamental "Hold" (Why Big Funds are Waiting): "Big Funds" are likely sidelined ahead of the tier-1 data dump. They need clarity before deploying serious capital for the week.
Today (Wed): ADP Payrolls & ISM Services.
Friday: The NFP (Non-Farm Payrolls).
The Reality: Until these numbers drop, we may remain in a "chop" or "balance" phase as institutions hedge rather than commit.
Plan & Execution:
Bias: Slightly Long, strictly conditional on holding above the PWH.
The Trigger: I need to see Follow Through. We need a volume spike (Initiative Buying) to confirm that "New Money" has arrived to defend this breakout.
Caution: If we fail to find acceptance higher and lose the PWH, expect a rotation back inside the previous balance to find liquidity.
Talk to you for the next update.

ASIA: B&R/RSTime: 20:45 GMT
4H Setup: REV/IBM
4H Confluences: EMA13, RSI reversal break, Weekly Level
15m Setup: B&R/RS
15m Confluences: EMA13, EMA89, EMA Cross
Target: 2R
ASIA: B&R/RTime: 20:45 GMT
4H Setup: REV/IBM
4H Confluences: EMA13, RSI reversal break, Weekly Level
15m Setup: B&R/R
15m Confluences: EMA13, EMA89, EMA Cross
Target: 2R
ASIA: B&R/OBMTime: 20:30 GMT
4H Setup: REV/IBM
4H Confluences: EMA13, RSI reversal break, Weekly Level
15m Setup: B&R/OBM
15m Confluences: EMA13, EMA89, EMA Cross
Target: 2R Bread & Butter
ASIA: BO/MTime: 20:15 GMT
4H Setup: REV/IBM
4H Confluences: EMA13, RSI reversal break, Weekly Level
15m Setup: BO/M
15m Confluences: EMA13, EMA89, EMA Cross
Target: 2R Bread & Butter

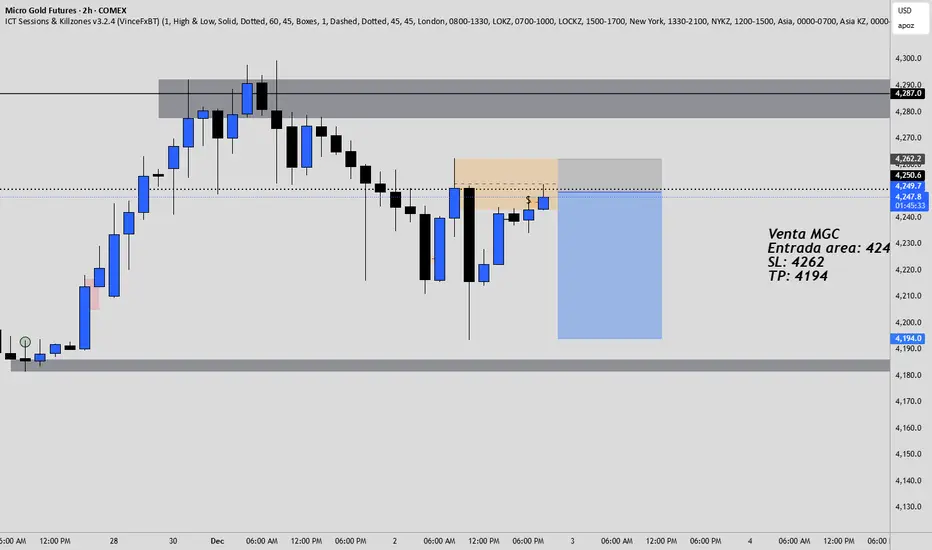
MGC Short2h OB reaction
Continuation of the retracement momentum in the 4h tf
Targeting low
Wide stop loss on this trade
ASIA: REV/MTime: 20:00 GMT
4H Setup: REV/IBM
4H Confluences: EMA13, RSI reversal break, Weekly Level
15m Setup: REV/M
15m Confluences: EMA13, EMA89, EMA Cross
Target: 2R bread and butter

ASIA: REV/IBMTime: 20:00 GMT
4H Setup: REV/IBM
4H Confluences: EMA13, RSI reversal break, Weekly Level
15m Setup: REV/IBM
15m Confluences: EMA13, EMA89, EMA Cross
Target: 5R based on 3 Session Setup
ASIA: s618/L-ATRTime: 19:45 GMT
4H Setup: REV/IBM
4H Confluences: EMA13, RSI reversal break, Weekly Level
15m Setup: s618/L-ATR
15m Confluences: EMA13, EMA89, EMA Cross
Target: 5R based on 3 Session Setup
Liquidation Break & The "New Money" TestCOMEX:GC1! COMEX_MINI:MGCG2026 FOREXCOM:XAUUSD
Following up on the previous context regarding the "Thin Structure Repair."
Market Context (The Repair): As anticipated, the auction corrected lower to repair the thin profile left behind by the holiday drift.
Monday: Developed as a Balance Day, digesting the recent move.
Today: We saw a Liquidation Break early in the session, effectively flushing out weak hands, followed by a rotation back up.
Structure & Inventory (The "Tell"): The current bounce is characteristic of Short Covering (old money exiting winning shorts) rather than Initiative Buying (new money entering longs).
The Trap: Short covering can rally price, but it is mechanical and temporary. It creates a "hollow" move if not supported by fresh volume.
The Requirement: To re-test and break the All-Time Highs, we need to see "New Money" step in. Without this sustained buying flow, the auction will lack the energy to hold higher prices.
Plan & Execution:
Stance: Cautious / Monitoring for flow confirmation.
Scenario A (Bullish): If we see aggressive Initiative Buying absorbing offers above the short-covering highs, we target the ATH.
Scenario B (Bearish): If the rally stalls and "new money" fails to show up, expect the market to rotate deeper to find supportive bids (value) at lower levels.
Talk to you for the next update.

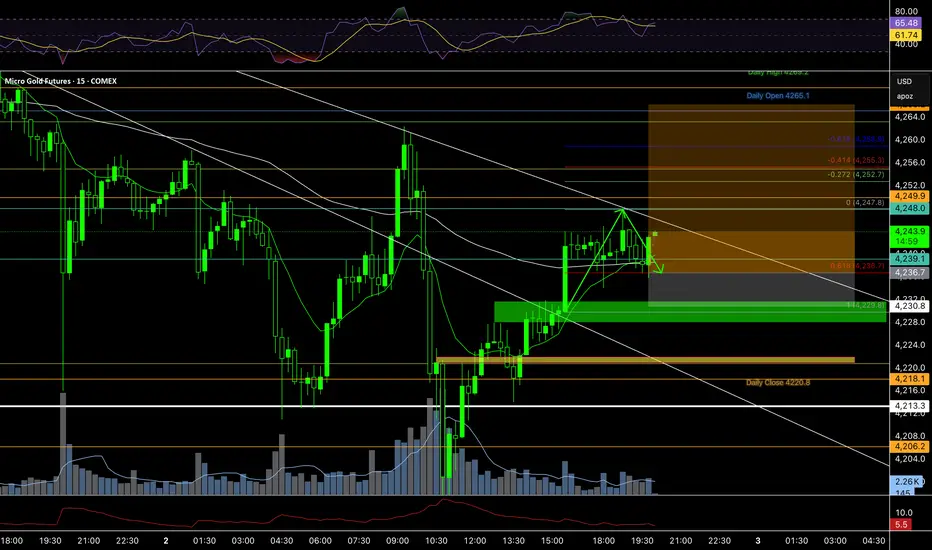
15 min wow 1 min nested daily 4h up , here we have a 15 min demand. This demand removed opposing zones and broke trend line
our entry is at the 1 min nested in the 15 min, the market is high in the range so that goes lowers odds. were targeting 3R

Part 2 12/1/25Part 2 of previous post, did excactly what needed to be done! Gold 12/1/25 take profit
Switched to Futures 12/1/25 Switched to Futures from Options 12/1/25 2 contracts of Gold. 1,2,3 Lets go!
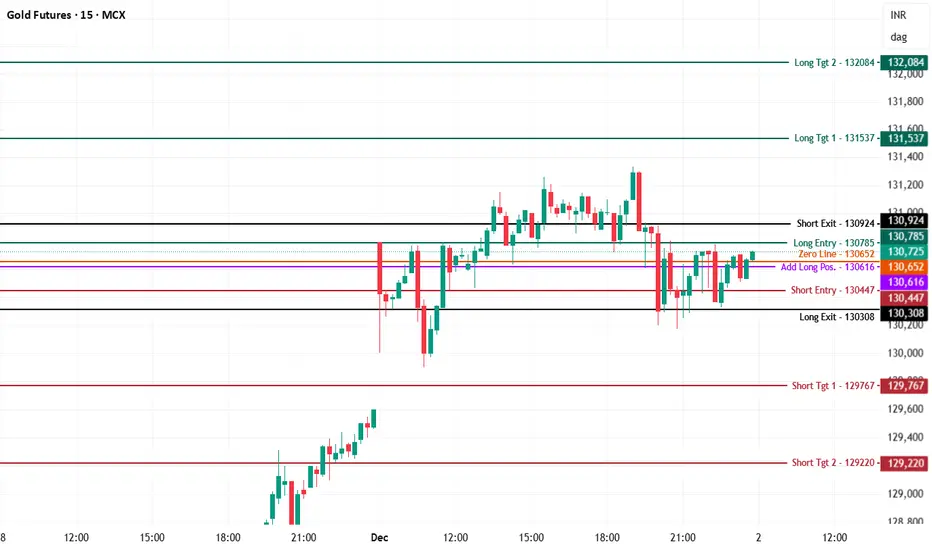
Gold Feb Fut. MCX Intraday Technical Analysis - 2nd Dec., 25MCX:GOLD2!
Gold MCX Futures — Chart Pathik Intraday Levels for 02-Dec-2025
(If these levels add value to your trades, a quick boost or comment goes a long way in supporting this free content and keeping our trading community thriving!)
Gold Futures are trading near 130,725, pushing just above the zero line at 130,652 and testing the Long Entry band at 130,785 after recovering from a sharp intraday dip, signalling an emerging bullish attempt against prior supply. Each comment or share builds the momentum for disciplined, structured analysis across our trading community!
Bullish Structure
Longs activate above the Long Entry level at 130,785, with stronger conviction if price sustains above the zero line at 130,652 and holds the Add Long Position level at 130,616 as support on intraday pullbacks.
Targets: 131,537 (Long Target 1 / primary booking zone) and 132,084 (Long Target 2 / extended upside leg on strong breakout).
Control: Place stop or trail near 130,447–130,308 (Short Entry and Long Exit band) to keep risk defined while bullish structure remains active.
Bearish Structure
Shorts open below the Short Entry level at 130,447 or on clear rejection between 130,785 and the Short Exit supply zone at 130,924 after failed upside attempts.
Targets: 129,767 (Short Target 1 / partial or scalp booking) and 129,220 (Short Target 2 / extended downside if breakdown sustains).
Control: Fast short covers are required back above 130,785–130,924 where bearish structure weakens and trapped shorts risk a squeeze.
Neutral Zone
130,652 is today’s inflection and zero line—expect sideways, noisy moves while gold oscillates between roughly 130,447 and 130,785 without decisive 5-minute closes outside this band.
Every setup is designed for structure, plan, and logic—let the chart work for you, not your emotions.
Boost or comment if these levels help your preparation—help Chart Pathik keep delivering quality analysis to more intraday traders!
How to Trade with Bollinger Bands in TradingViewBollinger Bands are a volatility indicator that helps traders identify market extremes, trend strength, and potential breakout setups by measuring how far price moves away from its average.
What You’ll Learn:
• Understanding Bollinger Bands as a volatility-based trading tool built around a moving average
• How the middle band represents the 20-period simple moving average (SMA)
• How the upper and lower bands are calculated as two standard deviations above and below that SMA
• Why expanding bands signal rising volatility — and tightening bands signal market compression
• Recognizing overbought and oversold conditions when price touches or moves beyond the upper or lower bands
• Why these signals aren’t automatic buy or sell triggers, and how to confirm them with other tools like RSI or MACD
• Identifying the “Bollinger Band squeeze,” a setup that often precedes major breakouts
• Spotting potential mean-reversion trades when price closes back inside the bands after moving outside
• How to add Bollinger Bands on TradingView via the Indicators menu
• Understanding the default settings (20, 2) and how adjusting the period or deviation affects sensitivity
• Practical examples using the E-mini S&P 500 futures chart
• Applying Bollinger Bands across daily, weekly, and intraday timeframes for volatility analysis and signal confirmation
This tutorial is designed for futures traders, swing traders, and technical analysts who want to integrate volatility dynamics into their trading approach.
The methods discussed may help you identify breakout conditions, trend continuation signals, and potential reversal zones across multiple markets and timeframes.
Learn more about futures trading with TradingView:
optimusfutures.com
Disclaimer
There is a substantial risk of loss in futures trading. Past performance is not indicative of future results. Please trade only with risk capital. We are not responsible for any third-party links, comments, or content shared on TradingView. Any opinions, links, or messages posted by users on TradingView do not represent our views or recommendations. Please exercise your own judgment and due diligence when engaging with any external content or user commentary.
This video represents the opinion of Optimus Futures and is intended for educational purposes only.
Chart interpretations are presented solely to illustrate objective technical concepts and should not be viewed as predictive of future market behavior. In our opinion, charts are analytical tools — not forecasting instruments.

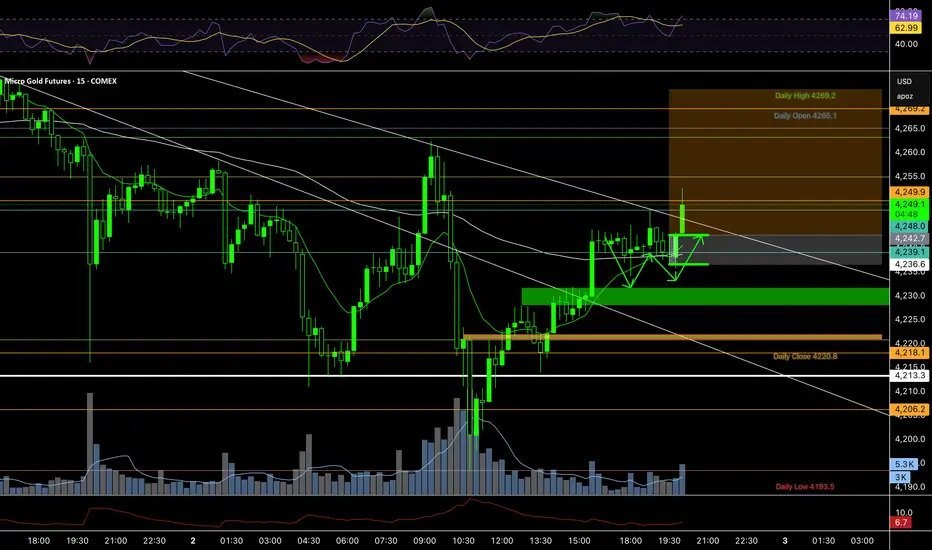
15Min Rally-Base-Rally Long Setup | Daily & 4H Demand in Controlaily and 4H remain bullish with demand in control. Price is reacting at the base of a 15-minute Rally-Base-Rally demand zone that removed opposing 15M supply and is nested within 4H structure.
Despite being high in the range, execution is only for longs in alignment with HTF demand. Patience and risk management first.
Gold/Silver Ratio - Monthly Close on Bear FlagExpect higher moves in Silver as it hits new ATHs, i expect gold to have a sympathy rally alongside Silver, however the break in the gold/silver ratio to the downside (silver outperforms) would signal a higher % move in Silver to follow.

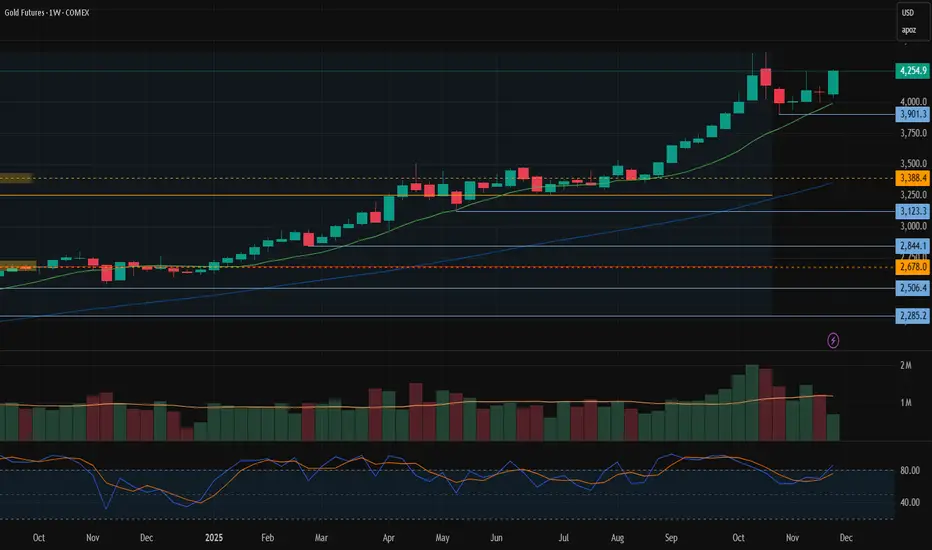
Gold futuresOver the past four weeks, gold futures fell to the 3900 level, before resuming their upward move. They may be now be preparing to retest the all-time high at 4400. Formally, the trend remains bullish, however, from a historical perspective, it has already lasted for more than 1000 days, leaving limited room for further upside.
Long-term trend: Up
Resistance level: 4400
Support level: 3900
GOLDGold right now is still and inside bar in the monthly chart. The weekly chart just hit TP1 off a 22 strat combo to the upside. We are waiting to see if price will have enough strength to continue to go outside on the month or will we stay inside? I'm ready for either let see what she does

You don't see that everyday 3 triangles -beautiful to watch. I think this is a continuation of the main trend up ,it's latter stages of the rally so very short term indeed.

MGC Long Setup – 15M WOW Demand Aligned with 4H & Daily Trend15M WOW demand has formed from a trendline break, showing a shift in order flow.
Even though the 15M structure is currently bearish, the 4H and Daily trends remain bullish, keeping the higher-timeframe bias to the upside.
Entry plan:
• 15M demand wick entry
• Or refined entry using 1M nested demand
This is a lower-timeframe entry aligned with higher-timeframe continuation.
