GC (gold) UpdateMFI hit overbought and SI (silver) hit overbought on RSI.
Decided it was easier to trade stock options than commodities today. No position.
Market insights

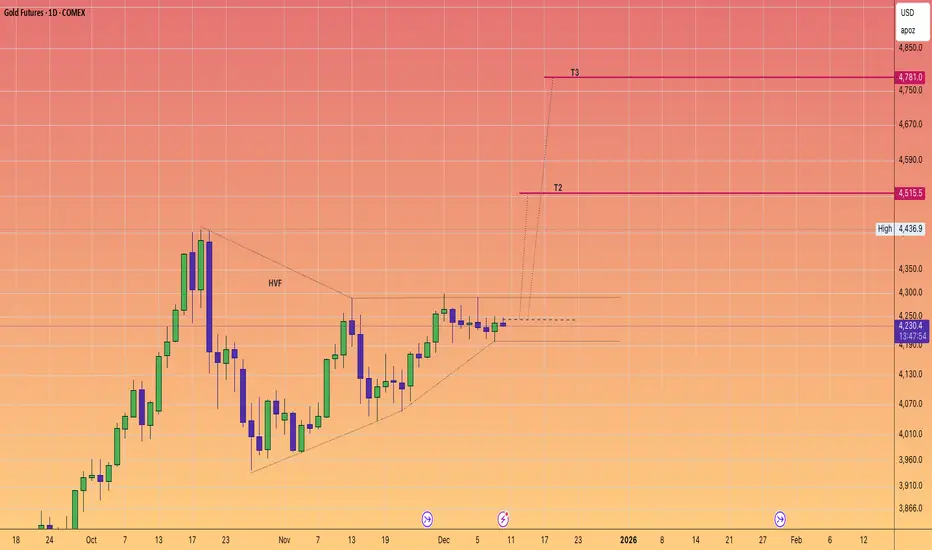
GOLD in a windup. Targets $4800AS we progress ever closer to the quite historic level of $5k for #GOLD
We note that Gold has been quite predictable and routinely has delivered +20% powerful moves since 2024.
The price action currently suggests we are about have another pop very soon.
Will it be enough to tag the $5K level
odds suggest that it definitely on the table.
The #HVF pattern points to $4800 and with some over performance we are right on that doorstep.
Looking to buy GCGC fell on Friday leaving inefficiency above. 4H closed bullish with expansion candle. Looking to buy from 15M engulfed candle (order block). Going for bit more than 2R. 4H candle high is the first target

GC (gold) updateMFI is touching oversold....
Might take a shot at some GLD calls tomorrow, not sure because Fed meeting on Wed.
GC | Wk 51T.A explained -
BackSide (BS)
FrontSide (FS)
Inverse BS (Inv.BS)
Inverse FS (Inv.FS)
BS & FS levels are expected support when dashed lines, tested when dotted and resistance when solid lines.
The inverse is true for the Inv. BS Inv. FS levels, they are resistance as dashed lines, tested as dotted and support as solid lines.
Monthly timeframe is color pink
weekly grey
daily is red
4hr is orange
1hr is yellow
15min is blue
5min is green if they are shown.
strength favors the higher timeframe.
2x dotted levels are origin levels where trends have or will originate. When trends break, price will target the origin of the trend. its math, when the trend breaks, the vertex breaks too so the higher timeframe level/trend that breaks, the more volatility there could be as strength in the orders flow in to fuel the move.

GC Short Trade IdeaGot levels of resistance here. If we get through the resistance we have a strong high above for a possible short there also.

Based on recent Elliott Wave analyses, the undertone for MCX GolBullish Outlook: The primary trend for gold on MCX is considered positive (bullish) from an Elliott Wave perspective.
Wave Structure: Gold has consolidated in a corrective wave 4 and is likely unfolding in wave 5 of a larger primary wave 5.
Support & Resistance: Key support is identified around ₹120,000, while a break above ₹124,600 is considered a positive reversal signal.

Gold Short Term Move (Less Than 12hr for TP/SL)Marking out .68 &.79 levels on 5min,15min,1hr charts. Once price respects zone we enter. Confirmations for respected zone are 5min fvg and ifvg respected, also closing and retesting of the zone.
Take Profit 1- Equilibrium of the move that goes down into the 15min GZ
Take Profit 2- Fibinocci extension .50
Take Profit 3- Any other Golden zone it can be going.
Take Profit 1** I take %99 of the time Take Profit 2** with strong momentum and volume i say i take %75 of the time and Take Profit 3** is a 50/50 split because it usually consolidates or retraces and could wick a stop loss.

Gold Context: Breakout from 4-Day Balance & Holiday ThinnessFOREXCOM:XAUUSD COMEX_MINI:MGCG2026 COMEX:GC1!
b]Analysis
1. Market Context (The Breakout)
We have observed Short Covering extending above the recent 4-day balance.
• Structure: Yesterday's push brought us nearly to the All-Time High (ATH). Today being Friday, the auction is positioned to test that extreme.
• The Driver: To sustain this breakout and reach the ATH, the initial short covering must transition into New Money buying (Initiative). Without this transition, the move risks being just an emotional inventory adjustment.
2. Scenario & Structure (The Tail)
• Bull Case: If short covering continues and attracts new buying interest, the ATH is the natural magnet.
• Bear Case (The Tail): Yesterday left a selling tail at the highs. If we see Liquidation (failure to hold gains), it confirms that the tail was a valid rejection by Higher Timeframe (OTF) Sellers defending the highs.
3. Holiday Caution (Thin Market)
We are approaching the Christmas and New Year holiday window.
• Risk: Trading volume is thinning out. Low volume markets can be erratic and lack structural integrity. Be careful of "false" moves driven by lack of liquidity rather than genuine value migration.
Plan & Execution
• Bias: Leaning toward the ATH test, but cautious of the "Tail" overhead.
• Invalidation: A drop back into the 4-day balance would negate the breakout and suggest the higher prices were rejected.
Talk to you for the next update.

Multi Top - Multi Bottom. Go Next Your Golden Shift4500 to take a bag (supply area). 4400 - to jingle that.
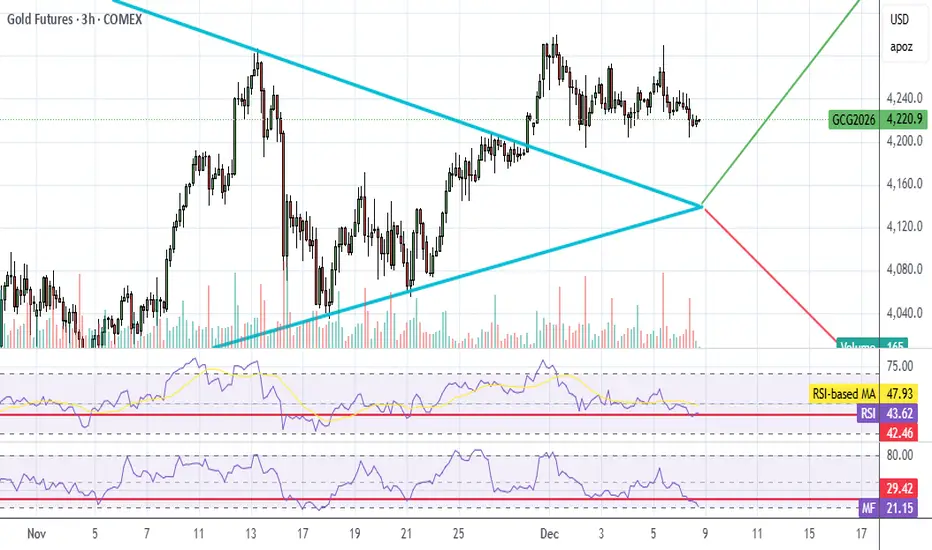
Gold strong bullish momentumHere we can see my channel projection lines and how the bullish momentum just keep on getting stronger and stronger. Now here is the question. Will the bulls pick up more momentum pushing the price even higher to the projected channel line?
Love to hear your opinion, leave a reply.
#Gold

Gold Context: The "Picket Fence" Highs & USD WeightCOMEX:GC1! COMEX_MINI:MGCG2026 FOREXCOM:XAUUSD
Analysis
1. Market Context (Lack of Acceptance) We are observing a classic "Picket Fence" at the highs. Gold has probed last Friday's high nearly every day, yet we see no acceptance (time + volume) above it.
The Structure: Repeatedly testing a level without breaking through often indicates that Short-Term Traders are dominating the auction. They are fading the extremes but lack the "New Money" power to expand the range.
The Risk: In Market Profile, "failure to facilitate trade" in one direction usually leads to a rotation in the opposite direction. If we cannot discover value higher, the auction will seek liquidity lower.
2. Fundamental Weight (USD Resilience) The upside is being capped by a resilient US Dollar (DXY).
The Driver: The divergence between a "Wait-and-See" Fed (Hawkish Cut) and a weak Europe is keeping a structural bid under the Dollar.
Correlation: As long as DXY holds its liquidation lows and yields remain firm, Gold lacks the macro fuel to break this mechanical resistance.
3. Scenario (Inventory Adjustment) The repeated failure at the highs increases the probability of Long Liquidation .
Target: A rotation back to the 4300 breakout level.
Rationale: This is not necessarily a trend change, but an inventory adjustment to flush out the "laggards" who bought the highs expecting an immediate breakout.
Plan & Execution
Bias: Cautious/Neutral.
Trigger: Watch for a "look above and fail" or a breakdown of the intraday lows to trigger the move to 4300.
Talk to you for the next update.

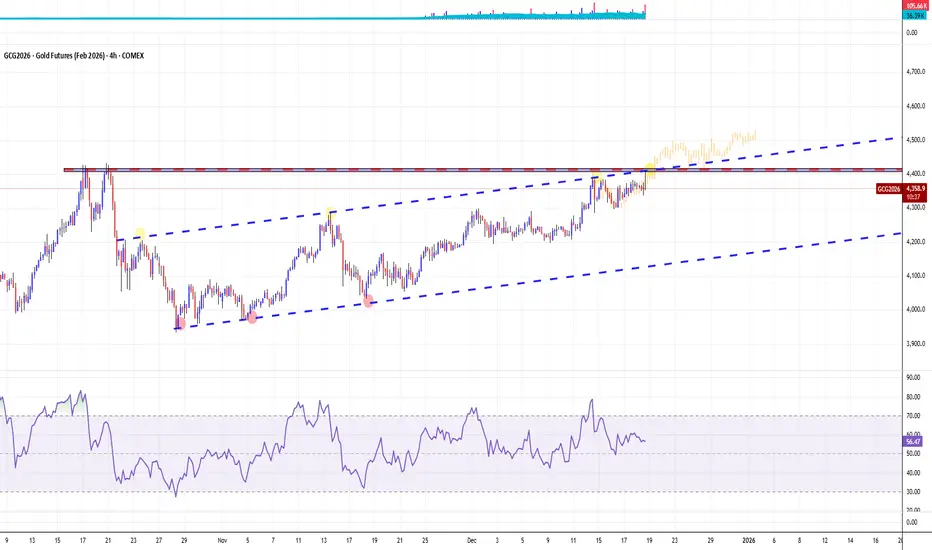
Gold Futures (GC) Technical Analysis at Key ResistanceGold futures are approaching a major higher-timeframe resistance between 4,414.4 and 4,399.4. This analysis focuses on price behaviour, volume reaction, and institutional participation rather than prediction. No trade is taken until price reaches the zone and confirms intent through volume and structure.

Approaching important fractal Hitting a very important fractal on gold, will we break though or mean revert?

GOLD 17.12.2025Today’s market was quite choppy, especially Gold. I let price develop during the first part of the session, and it became clear that institutions were seeking liquidity, which was found around the previous day’s POC. From that area, price reacted aggressively and pushed toward the upper zone, where it started trading into a non-fair value area formed two days ago.
This area had relatively strong volume, and during the second part of the session, price was met with aggressive sellers. On the CVD, we can see that during the pullback buyers remained active, forming an interesting accumulation within the downtrend.
With the confluence of the 0.618 Fibonacci level and the moving average, price reacted nicely, resulting in a clean and disciplined 3R trade.

FVG RejectionCaught this trade during the Tokyo session. An FVG was formed that took out a swing low. The FVG was retested and rejected. I entered at the fractal BOS and targeted Sell Side Liquidity (SSL). My SL was out above the FVG.

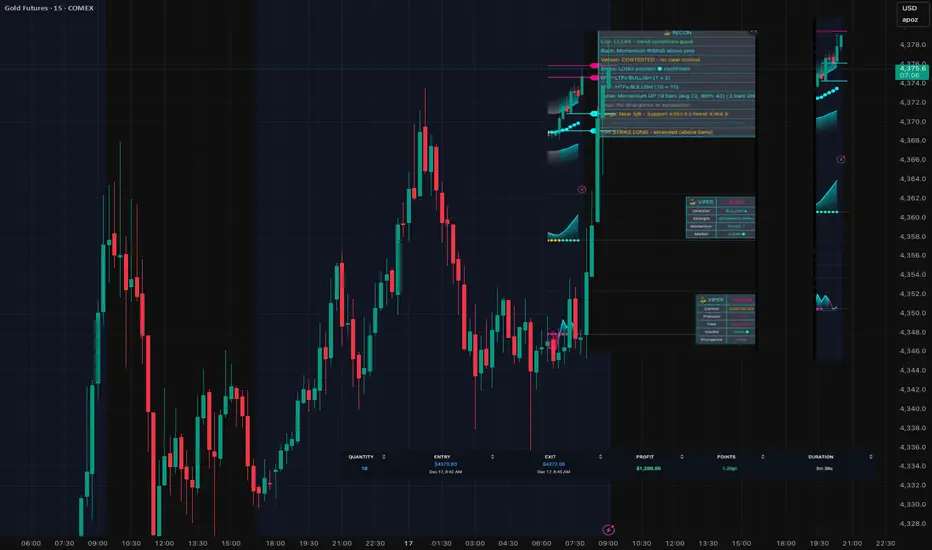
SignalViper Suite — Quick Scalp on Gold FuturesSignalViper Suite — Quick Scalp on Gold Futures (GC)
3-minute trade.
$1,200 profit.
Here's the setup:
RECON showed full alignment:
• Coil: CLEAR — no chop
• Strike: LONG confirmed
• Rush: Momentum RISING
• MTF: All timeframes bullish
• Fangs: Near key S/R levels
The missing piece? Venom was showing CONTESTED — buyers and sellers fighting for control.
I waited.
Next bar, Venom flipped to BUYERS.
That was my trigger. Entry: 4370.80 Exit: 4372.00 Duration: 3 minutes
Result: +1.20 pts on my Apex Trader Fund account. No guessing. No FOMO. Just waited for all 8 indicators to align, then executed. That's what confluence looks like.
Gold Context: Mechanical Balance & The Poor HighFOREXCOM:XAUUSD COMEX_MINI:MGCG2026 COMEX:GC1!
Analysis
1. Market Context (Mechanical Balance)
The auction has entered a phase of Mechanical Balance . By maintaining trade above 4300 for a week, the market is signaling acceptance of higher prices, but the momentum has paused.
* The Behavior: The test of yesterday’s Midpoint/POC and the "mild" activity confirms that Short-Term Timeframe traders are currently dominant. They are trading off visual references rather than creating new value.
2. Structure (The Poor High)
We have a structural anomaly at the 4380/90 area : a Poor High .
* Implication: A poor high lacks "excess" (a buying tail), which indicates the auction did not finish properly. Selling wasn't aggressive; buying simply dried up. This leaves "unfinished business" to the upside.
* The Nuance: While the destination is likely higher to repair this poor high, the market may lack the immediate energy to do so without an inventory adjustment first.
3. Short-Term Scenario (Liquidation)
The mild, mechanical trade increases the odds of Long Liquidation .
* The Flush: A rotation back toward the 4300 shelf would test the lower limits of this balance.
* The Opportunity: If we flush to 4300 and find responsive buying, it re-energizes the market to finally go up and repair the 4380/90 poor high.
Plan & Execution
* Bias: Neutral-to-Bullish (awaiting repair).
* Observation: Watch the 4300 test. Do we get a "look below and fail" (bullish) or acceptance lower? The poor high remains a magnet for the future.
Talk to you for the next update.

Buying GCGC closed bullish on 4H. Bearish 1H low was tagged as sweep of liquidityThere are 15M and 30M bullish engulfing candles. Going for 4H high which should provide 2,5R

FVG REjectionCaught this trade during the pre-market moves when a swing low was taken out by a Bearish FVG. The FVG was respected and then rejected. Showed entry after the fractal BOS. Trade Idea was profitable.

GOLD - 16.12.2025Today, price formed a bullish divergence between CVD and price. As expected, we saw a strong positive reaction, with price moving through the entire Value Area formed during the previous session.
However, once price reached the upper side, we witnessed an aggressive rejection from the area where the previous day’s VAH was located.

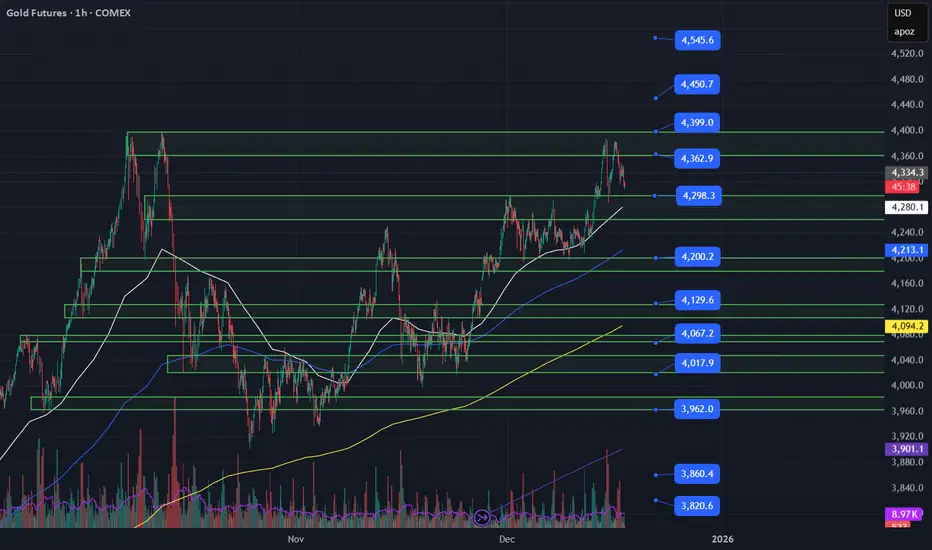
Gold Bulls Are In Control and Looking For Entries On PullbacksGold looks bullish a price broke out of a recent range last week and is holding above my moving averages. I would look for buying opportunities on pullbacks into the 4300, 4280(8MA) level to target 4360, 4400, 4450. A hold below 4280 and I'd be scalping short for the 21MA(4200) and would be watching how price reacts there. A hold or failed break would be another good long entry and a hold below would be a spot to press shorts for 4130, 4095(50MA).
#GC_F, AMEX:GLD , #Gold, #XAUUSD
E-mini Gold Futures poised for breakout above key resistance
Current Price: $4300.10
Direction: LONG
Confidence Level: 72%
Targets:
- T1 = $4350
- T2 = $4450
Stop Levels:
- S1 = $4300
- S2 = $4250
**Wisdom of Professional Traders:**
By combining insights from many professional traders across multiple platforms, I'm seeing a clear preference toward upside continuation in E-mini Gold Futures. Traders are framing this as a buy‑the‑dip or breakout opportunity, with $4,300 functioning as the critical support zone and $4,350 as the trigger level for a bullish push higher. The crowd wisdom suggests that as long as price stays above $4,300, the odds are skewed in favor of gains, particularly with gold's role as an inflation hedge and safe‑haven play remaining central in current market conditions.
**Key Insights:**
Here's what's driving my bullish take: Many traders are noting that gold has held an uptrend structure for the past month, with higher highs and higher lows intact. The MACD has just flashed a bullish crossover, and RSI sits comfortably below overbought, leaving room for further upside. Multiple pros point to $4,350 as short‑term resistance — but they expect this level to break if momentum continues, opening the way toward the $4,450–$4,500 area.
What caught my attention is the repeated emphasis on macro tailwinds. Ongoing signs of US dollar weakness, combined with only moderate resistance overhead, create the conditions for a sustained advance. Social sentiment on X also aligns with this view, showing a majority of bullish mentions compared to very few bearish takes in the last 24 hours.
**Recent Performance:**
Over the past week, E-mini Gold Futures have climbed about 2%, bouncing off the $4,300 level three separate times. Last Friday saw a close near $4,328, modestly above the 20‑day EMA, with volume ticking above its 20‑day average — a sign of growing participation. This stability at support reinforces the willingness of buyers to step in on minor dips, keeping the broader trend intact.
**Expert Analysis:**
Several professional traders highlight that gold is still well‑supported by central bank demand, with continued net purchases for over a year. Technical voices are stressing the importance of the $4,300 zone as the main defense line, while breakout traders are watching $4,350 closely for confirmation of momentum. A few swing trading specialists on YouTube are openly targeting $4,450–$4,500 this week if price closes strongly above the breakout zone. Their collective logic: the absence of strong nearby supply zones after $4,350 gives the market room to run.
**News Impact:**
Macro headlines this week are skewing supportive for gold. Traders are watching the US core CPI release, which, if hot, could accelerate safe‑haven flows into gold, and the Fed Chair’s upcoming speech, where a dovish tone would likely weaken the dollar further. On top of that, geopolitical tensions and upcoming Eurozone GDP revisions may also boost demand. All of these factors serve as catalysts that could amplify an already favorable technical setup.
**Trading Recommendation:**
Here’s my take — I’d enter a long position now or on a confirmed breakout above $4,350, using $4,300 as a protective stop zone and $4,250 as a wider secondary stop for risk control. First target sits at $4,350, but I’d look to capture the move toward $4,450 if momentum and volume confirm. Position sizing should stay within 2% of account equity, given macro event risk this week. The combined technical strength, favorable sentiment, and supportive macro backdrop make this a solid short‑term opportunity in E-mini Gold Futures.
