GOLD: Still Bullish? Buy This Massive Dip?In this Weekly Market Forecast, we will analyze Gold (XAUUSD) for the week of Feb. 2-6th.
Gold took a nosedive Friday after Trump's nomination for Fed Chair. The market reacted by a -14% drop, as investors moved funds from metals to the USD.
But is this an opportunity for savvy investors to ente
Gold Futures (Jun 2026)
No trades
Contract highlights
Related commodities

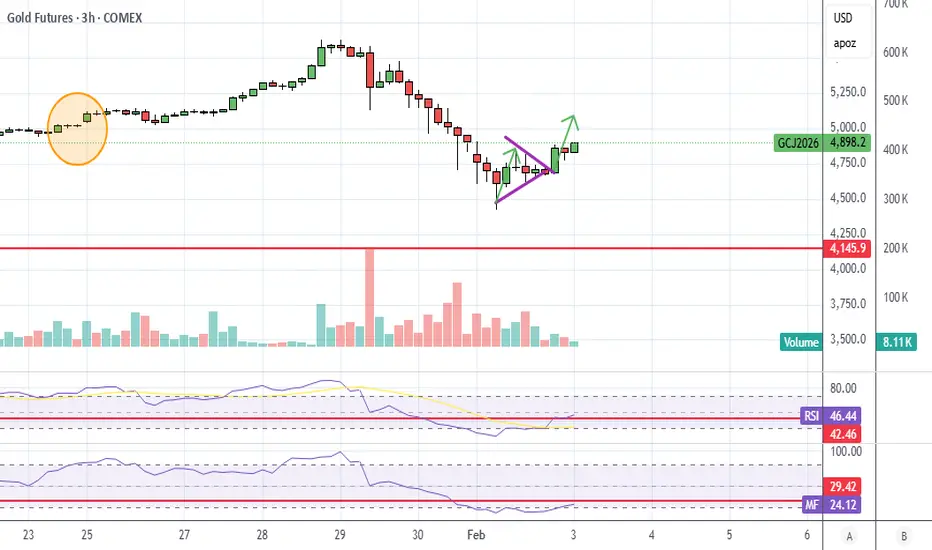
GOLD BREAKOUT - UPSIDE OR DOWNSIDE?Price is compressing near the trendline + technical bounce zone, indicating an impulsive move is coming. Watch for confirmation.
Bullish Breakout
• Buy above: 153,600 (above falling trendline)
• T1 157,800 - T2160,000
• Invalidation - below 152,000
Rejection & Breakdown
• Sell below: 152

Gold Futures: A Sharp Drop in Open Interest After Extreme MovesGold futures have seen very violent price action recently. After an exceptional 2025 — with prices nearly doubling — gold is now trading roughly 10% below its all-time high.
While price alone looks dramatic, the more important signal right now comes from Open Interest.
Open Interest is collapsing

GC UpdateLooks to me like this bounce will go a bit higher. It may even double top, gold and silver has a tendency to do that at the top.
Not playing it. Too unpredictable overnight, Asia and EUrope don't always seem to be on the same page with gold, silver, and cryptos. Then again I suppose they weren't
Bearish ABC Extension toward 127.2% Target | High RR SetupOverview
Following a significant impulsive leg lower, we are seeing a textbook ABC corrective structure play out. After a temporary relief rally into a established supply zone, the market has broken its corrective trend, signaling a continuation of the primary bearish trend.
Technical Breakdown

Gold Market UpdateLooking at the termination of the uptrend back in 2011, we saw a pretty aggressive move down at that time.
Comparing that to the current cycle, we had stopping action in 2020 that led to a multi-year trading range and a much larger change of behavior. This is what would be expected, but not to the

more gold volatility ahead likely this FebBased on the current market dynamics, I am expecting a final sell sequence sometime this February to fill the price gaps at $4100-4300 ranges, as evident on the gold daily tf chart view. After that I don't envision anything being able to stop the breakout to 6k this year and ultimately progressing t

How to Trade Price Action Patterns in TradingViewHow to Trade Price Action Patterns in TradingView
Master price action pattern recognition using TradingView's charting tools in this comprehensive tutorial from Optimus Futures.
Price action patterns are among the most time-tested technical analysis methods available.
They help traders identify p

METALS COT POSITIONINGMETALS COT POSITIONING: Silver Leads, Gold Crowded, Copper Weak
Data: CFTC COT Report as of Jan 28, 2026
Using CFTC Commitment of Traders data to analyze where smart money (Commercials) and the crowd (Speculators) are positioned across the metals complex.
SILVER COMEX:SI1! - STRONGEST SETUP
Co

Weekly Low Set – Gold Showing Bullish Continuation Into MidweekGold remains in a high-volatility environment, though conditions have slightly calmed compared to last week. Even with reduced leverage across prop firms, price continues to show strong intent.
This week’s structure so far:
Monday: Strong displacement down, creating what appears to be the weekly l

See all ideas
Summarizing what the indicators are suggesting.
Neutral
SellBuy
Strong sellStrong buy
Strong sellSellNeutralBuyStrong buy
Neutral
SellBuy
Strong sellStrong buy
Strong sellSellNeutralBuyStrong buy
Neutral
SellBuy
Strong sellStrong buy
Strong sellSellNeutralBuyStrong buy
A representation of what an asset is worth today and what the market thinks it will be worth in the future.
Displays a symbol's price movements over previous years to identify recurring trends.
Frequently Asked Questions
The current price of Gold Futures (Jun 2026) is 5,100.9 USD / APZ — it has fallen −0.60% in the past 24 hours. Watch Gold Futures (Jun 2026) price in more detail on the chart.
The volume of Gold Futures (Jun 2026) is 2.10 K. Track more important stats on the Gold Futures (Jun 2026) chart.
The nearest expiration date for Gold Futures (Jun 2026) is Jun 26, 2026.
Traders prefer to sell futures contracts when they've already made money on the investment, but still have plenty of time left before the expiration date. Thus, many consider it a good option to sell Gold Futures (Jun 2026) before Jun 26, 2026.
Open interest is the number of contracts held by traders in active positions — they're not closed or expired. For Gold Futures (Jun 2026) this number is 57.17 K. You can use it to track a prevailing market trend and adjust your own strategy: declining open interest for Gold Futures (Jun 2026) shows that traders are closing their positions, which means a weakening trend.
Buying or selling futures contracts depends on many factors: season, underlying commodity, your own trading strategy. So mostly it's up to you, but if you look for some certain calculations to take into account, you can study technical analysis for Gold Futures (Jun 2026). Today its technical rating is buy, but remember that market conditions change all the time, so it's always crucial to do your own research. See more of Gold Futures (Jun 2026) technicals for a more comprehensive analysis.