Trade ideas

Compound: Breaking OutTo stay up-to-date with the latest market developments, be sure to subscribe to Kraken Intelligence at kraken.com
With DeFi largely underperforming its peers over the past few months, it comes as no surprise that we're starting to see bullish momentum rotate back into the space over the past few days. This is evident when looking at DeFi's total value locked (TVL), which just jumped from $52.5B on Monday to today's reading of $59.8B. Compound (COMP) is among the various DeFi plays that appear to be regaining bullish momentum...
If you're not familiar with Compound, what you should know is that Compound is a software running on Ethereum that aims to incentivize a distributed network of computers to operate a traditional money market. Compound uses multiple cryptoassets to provide this service, enabling the lending and borrowing required without a financial intermediary like a bank. Put simply, Compound allows users to deposit cryptocurrency into lending pools for access by borrowers. Lenders then earn interest on the assets they deposit. Once a deposit is made, Compound awards a new cryptocurrency called a cToken (which represents the deposit) to the lender. Examples of cTokens include cETH, cBAT and cDAI.
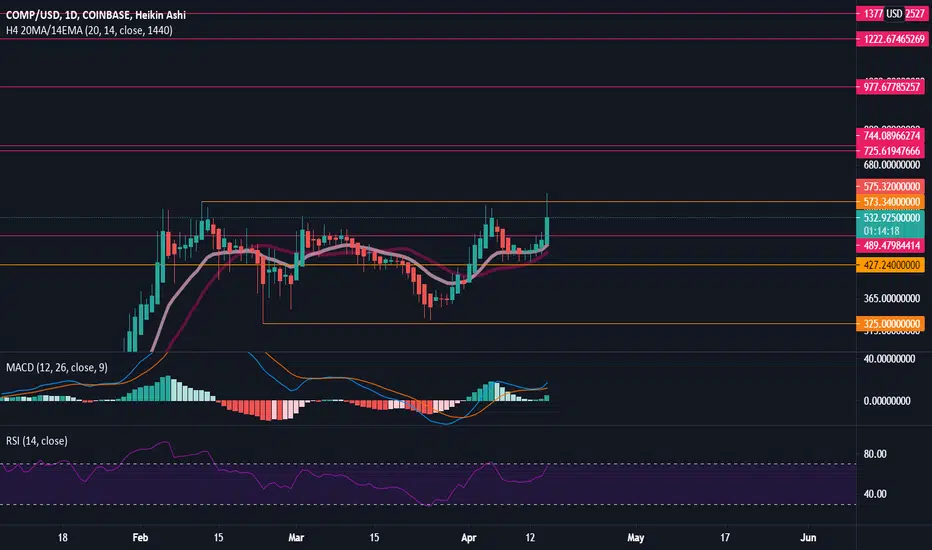
Now, moving onto the technicals... Per the 1-day chart provided above, we can see that COMP punched through $555 resistance earlier today and climbed to an all-time high of $593. With COMP having traded between $400 and $555 since February, today's breakout appears to have bucked said trend. Assuming we see COMP close above $555, and turn said resistance into support, we could see COMP enter back into price discovery mode as DeFi heats up yet again. But as always, where BTC trends next will likely dictate whether or not COMP can push higher.

COMP Inverse H&S BreakoutCompound looks to be another alt that is experiencing a neckline breakout from an inverse head and shoulders pattern.
It looks like a slight retracement is now occurring which has the potential to break down below the neckline still, however, assuming the trend continues, it has a bit of potential upward as indicated by the head to neckline length extended after the breakout (dashed blue line).
There is a similar breakout occurring against COMPBTC, so it looks like there is some potential to outpace BTC over the next few days as well if the breakout continues. I suppose we shall see soon if the breakout becomes more definitive in the next day(s) or so.

Picking up some COMPI should've got some COMP back in the move over 175. Or the momentum move through the 200's. Or during the previous consolidation in the mid 300's. However I didn't so I'm chasing momentum here. Not a great entry but I think there's more to run. I'm super bullish on Ethereum right now but I'm already in that position so putting a little in COMP as a related play as people discover how big the Ethereum space is and all the ways money is being made there. We're still in the middle of the crypto bull run so even mistakes are likely to eventually get bailed out (looking at you XTZ).


COMP-PERP | Short tradeHTF trend is bearish . Left clean lows on the way up, swept the high into the 61.8 and broke MS . Came back up to form a lower high that was swept and broke down further. Entered on market after the second break of MS . First target is the low of this corrective leg, second and third targets are the extension levels.

$COMPUSD - Long on Triangle and FlagHello everyone!
Compound is traded inside a symmetrical triangle, the projection on the chart is theoretical based on the price action.
There are two points where I suggest to close long positions, 1 - based on the flag pattern, 2 - based on the triangle pattern.
You can partially close position at 1 and wait for 2, up to you.
The best point to keep in mind in all chart pattern trades is wait for a breakout, the best of the best is wait for a breakout and retest, so wait for a signal and perform the necessary trade.

Technical Indicators Projects Upcoming Downtrend For COMP Price The weekly technical chart for COMP showcases a bearish momentum. Compound price is showing signs of negative momentum on coming to the daily chart. Comp price is trading above 50 and 100 Moving Average. The 50MA price is at $441, making it temporary support for the coin. The coin's resistance on the upside will be at $600, and on the downside, it will see a bounce back from $475.Compound price broke above the semi-circular top for a new high, but it is currently retracing back to the lower levels. If the price breaks below the support of $475, then it can reach up to $400 in no time.
Kindly comment your thoughts below

$COMP on the verge of breaking outCOMP/USD pair looks primed for the parabolic phase of its rise after flipping the S/R.
Let's make money!

EDiCrypto | COMPUSDTThis is just a simple painting , no more no less ... Do the right job with your knowledge !!!


COMP/USD Lower time frame bull flag COULD mark the bottomTrying to get the absolute low is a risky task, but this one is looking very good for a reversal

Compound Looks Set To Continue Rallying! BUY COMPUSDCompound has just completed a 3 wave correction and it could potentially start rallying from here. If the market does indeed start rallying from here then we can expect the first target to be at the 141.0% Fibonacci extension of the previous impulse leg.


Compound looks set for a march northCompound looks really attractive based on the trading signals. It has also formed a bullish pennant.
The problem with these trading signals is that they aren't always that accurate with assets that have such a small market cap. Nevertheless, its looking interesting.
Please like and follow for daily posts on various asset classes. Please also share your views on the trading ideas and whether or not you find them to be of any value to you as a trader.
Please note that cryptocurrencies are speculative assets which carry a very high degree of risk and any speculation in such assets can result in a complete loss of capital. This idea is shared for educational purposes only and should not result in speculative decisions in any digital asset.

COMP/USD Bull Pennant/Ascending Triangle on 4hr chartBull Pennant/Ascending Triangle forming on COMPOUND on 4hr chart
Strong support at .786 fib retracement currently bouncing
Symmetrical triangle on RSI showing higher lows
MACD showing bullish divergence with impending golden cross
Next target $704 based on measured move of previous breakout

COMP at Critical LevelCOMP is at the bottom of the pitchfork support and is going to have to choose a direction soon. A breakout up would be rather bullish, and if (after some consolidation) it could break above the top of pitchfork I will double down on my position, as the pitchfork will act as a VERY strong support. However, a break down would be short term bearish and I would expect it to stay below the pitchfork for some time.

COMPUSD - Ascending Channel - Support LevelsKeep an eye on 340 and 280.
There's only 10 million COMP.
The team holds 10% of that.
Short term down, long term up.


COMP bounce or fall?From this pitchfork we can see the support levels for COMPUSD. By drawing a sloping resistance along the peaks we can create a triangle, and can see that this consolidation will choose a direction soon. I plan to take this trade in the respective direction of the break.

COMP Broadening FormationCOMP broadening formation. The red trendline indicated a resistance level and the two green trendlines indicate the support level rang. If this is respected expect to see a $400 COMP soon.
