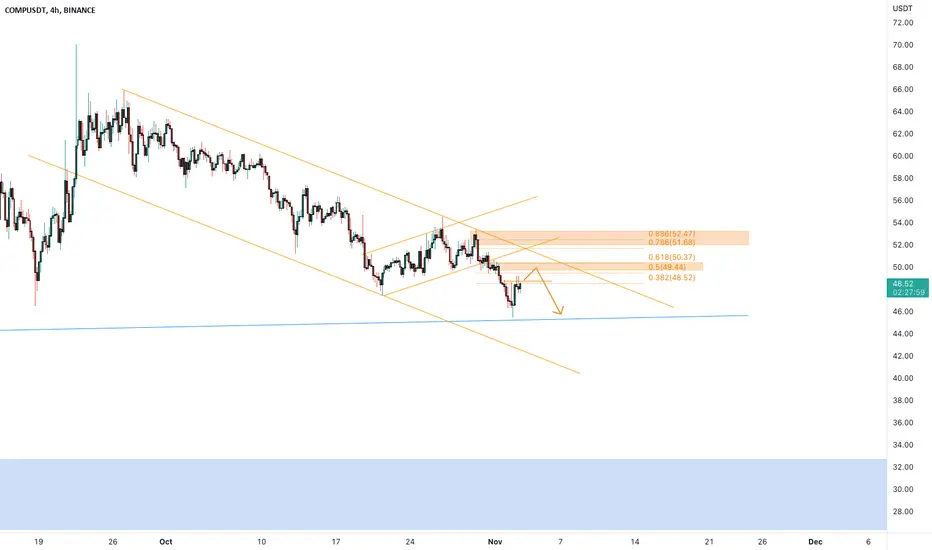
COMPUSDt Pullback?the price is testing the daily dynamic support at 46$ area where the price has a key level. Th market has a big liquidity on 34$ area
How to approach it?
The price could have a pullback until 0.618 - 0.786 Fibonacci Level, so According to Plancton's strategy , we can set a nice order
–––––
Keep in mind.
🟣 Purple structure -> Monthly structure.
🔴 Red structure -> Weekly structure.
🔵 Blue structure -> Daily structure.
🟡 Yellow structure -> 4h structure.
⚫️ black structure -> <= 1h structure.
–––––
Follow the Shrimp 🦐
Trade ideas
$70 in the next few days? or next week?Everything looks like its matched up for this to take off..... Thoughts?

COMP - Buying SignalBYBIT:COMPUSDT.P
4H time frame
-
COMP is hanging about on the support zone, open long here with good risk to reward ratio.
-
Entry: Market
Add: 4.815
TP: 52, 54.5, 58, 63
SL: 47.9

COMP no positive signals but still in trendBINANCE:COMPUSDT
Locally no signals to buy or sell for COMP but for middle term if you looking for next few month COMP can pump over 100%
✅Before we start to discuss, I would be glad if you share your opinion on this post's comment section and hit the like button if you enjoyed it.
Thank you.
Possible Targets and explanation idea
➡️This fib still relevant since local top in April
➡️Traded under fundamental price and appeared Strong Buy signal in June by "Trade ON" indicator
➡️4 October appeared signal to Buy on Direction indicator. Strong Signal
➡️Now if market crash again buy line for Comp at 35.85 will be good enter point
➡️For local trades 71$ is good time to take profit on "take profit line"
➡️Middle term target is correction by this fib to 128$ (0.618 fib level)
➡️Globally with market supply of COMP I can expect price higher then 500 again
Hope you enjoyed the content I created, You can support with your likes and comments this idea so more people can watch!
✅Disclaimer: Please be aware of the risks involved in trading. This idea was made for educational purposes only not for financial Investment Purposes.
* Look at my ideas about interesting altcoins in the related section down below ↓
* For more ideas please hit "Like" and "Follow"!


COMP | Seems like Ready to FLY..!!
#COMP Descending Channel Formation in Higher timeframe Chart..!!
Major Trendline Resistance getting Weaker & Buying Volume Coming in, Expecting Breakout.
In Case of Upside Breakout, Expecting 2-3x Bullish Rally in the Midterm..
Please like the idea for Support & Subscribe for More ideas like this and share your ideas and charts in Comments Section..!!
Thanks for Your Love & Support..!!

COMP long @ 49.00 10x leverageCOMP is consolidating heavily on lower time charts. I am opening a scalp long. I may add onto this position as time goes on.
Momentum indicators, MACD and TSI are signaling a consolidation of price action on the 30m.
We're within our Keltner Channel so we have support beneath us.
Lower time charts are signaling a small move up before our macro move down.

Comp Either OrLong and short positions on COMP from previously respected levels, I'll be going in heavy 3% @ 20x hopefully execute within a week or two and hold them for a day or two for a quick turnaround.


COMP Long SwingFirst setup, gonna look for a good entry in Buy Block, not really planning in taking profits untill we reach Sell Block area.

#COMPUSDT 1DAY Chart Trade setup: Trading in a Sideways Channel ($50-$70). Swing trader: can trade the channel (Enter near $50 support and Exit near $70 resistance).. (set a price alert). On August 30, Compound released version 3, which is a major upgrade to its lending DeFi protocol.
Trend: Downtrend across all time horizons (Short- Medium- and Long-Term).
Momentum is Bearish ( MACD Line is below MACD Signal Line, and RSI is below 45).
OBV (On Balance Volume): is declining, indicating that volume on Up days is lower than volume on Down days. Hence, demand (buyers) is below supply (sellers).
Support and Resistance: Nearest Support Zone is $50, then $30. The nearest Resistance Zone is $70, then $100.

COMP SHORT SETUPHello, dear traders. how are you ? Today we have a setup to SELL/SHORT the COMP symbol.
For risk management, please don't forget stop loss and capital management

Move towards resistanceHello friends, I hope you are doing well
We have experienced a fake breakout at the bottom of the channel and the price is expected to move towards the top of the triangle.
Entry point: 50
SL: 47
TP: 52.5

COMP : Trend updateIncrease expecting on a small time frame.
we will follow the trend.
Whale volume possible on this coin.

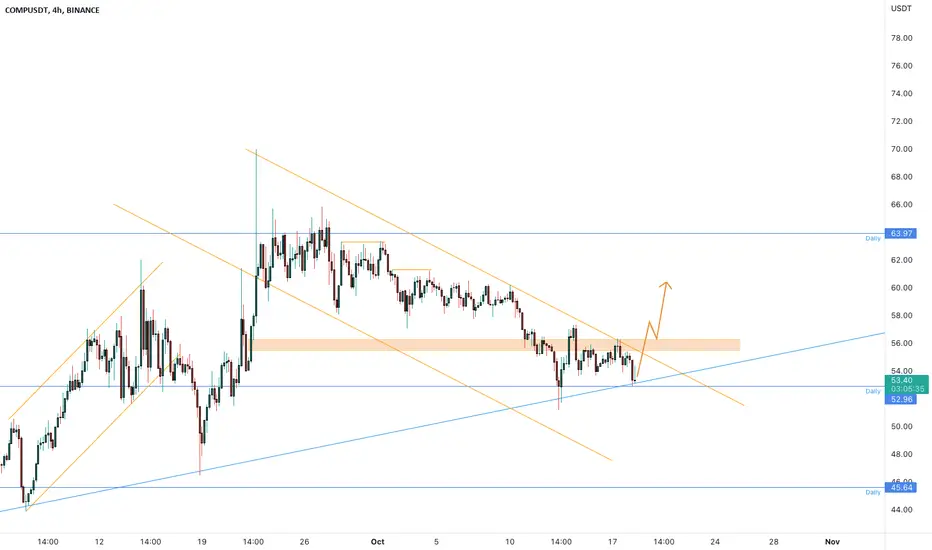
COMPUSDT is inside a massive descending channelThe price is creating a descending channel inside a main ascending channel on the daily timeframe.
Now the price is testing an important support at 53$
How to approach it?
IF the price is going to have a breakout and retest the current resistance as new support, According to Plancton's strategy , we can set a nice order
–––––
Keep in mind.
🟣 Purple structure -> Monthly structure.
🔴 Red structure -> Weekly structure.
🔵 Blue structure -> Daily structure.
🟡 Yellow structure -> 4h structure.
⚫️ black structure -> <= 1h structure.
–––––
Follow the Shrimp 🦐
COMP/USDT Short...COMP /USDT Sell.... This is not signal... Dont risk more than 3% of your account on any trade...

COMPUSDTPSHORT TYPE
•ENTRY: On chart or grey number/line
•SL: (on chart)
•TP: Take profit 50% when reach 100% and set ur SL on BEP, or take profit with ur trading style

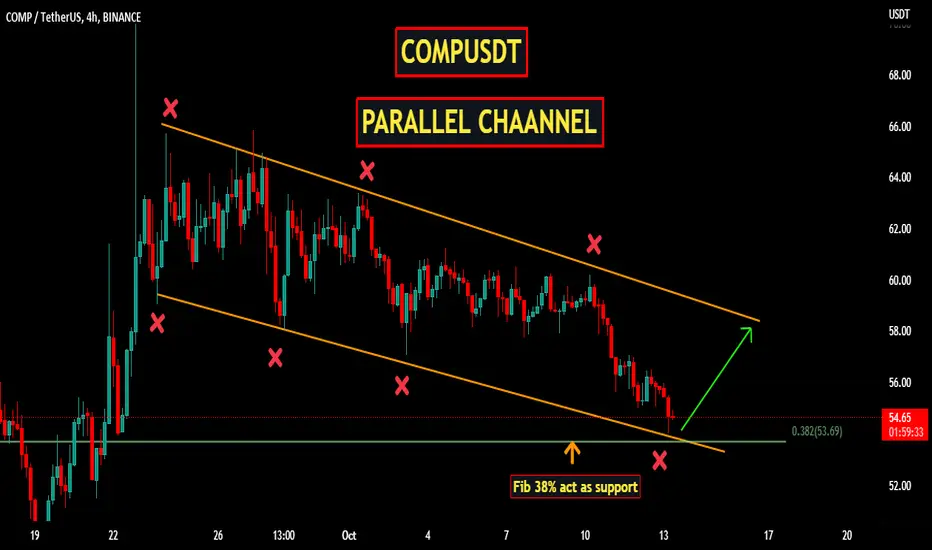
COMPUSDT | PARALLEL CHANNELCOMPUSDT after defining a top around 70. The price action is trading in a bearish parallel channel .
The immediate support lies in 38% fib, where we also saw good bounce.
Trade your levels accordingly.
COMP/USDT longIdk anything about this token, but technical analysis points for a long position with a upward potential of almost 22%. With USA's inflation data coming in today, extra caution is advised.

COMP/USDT potential 200%+ gain!The trade setup is very ambitious indeed. However, we believe that COMP is currently one of the most attractive coins.

COMP Chart AnalyzeAccording to the 15Min chart analyze market will going down by hitting the trend line

