COMP/USDT — Accumulation Zone That Will Define the Next Big MoveCOMP/USDT is currently at a critical crossroads.
For months, price has been consolidating inside the long-term accumulation range between 23.27 – 40.88 (yellow box). This area has acted as a historical demand zone since 2022, and multiple retests have reinforced its importance.
Such prolonged sidew
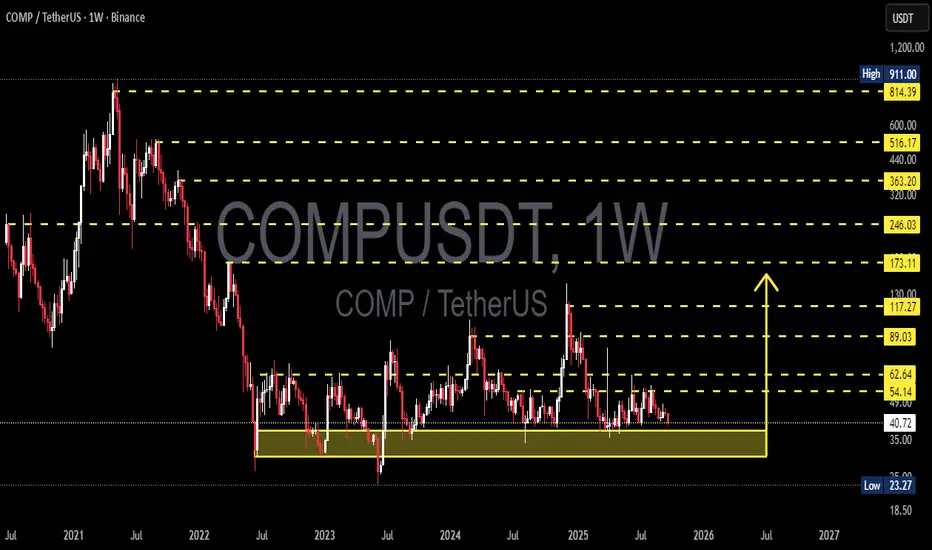
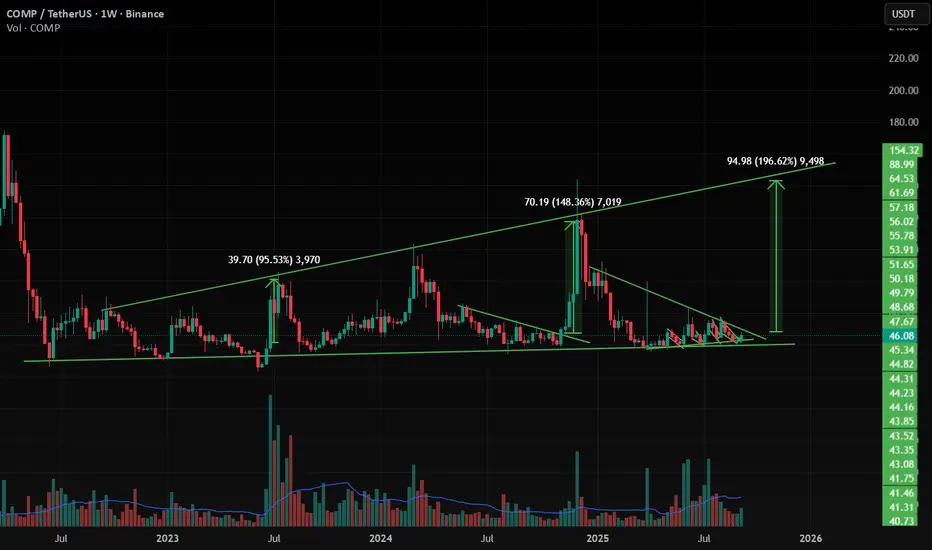
COMP/USDT , 1W , Bullish COMP has moving same as previous moves , so it will give nearly 200 % UP move very strong if it breaks the upper trendline in Weekly and strong candle close .
it has forming Expansion channel pattern inside it is giving good up movement when it touches
support zone and breaking out from the patter
Swing playNot financial advice, take it lightly
Wbullishbreaker golden zone, mitigation.
Wbearishbreaker untested golden zone or at least 45% expected

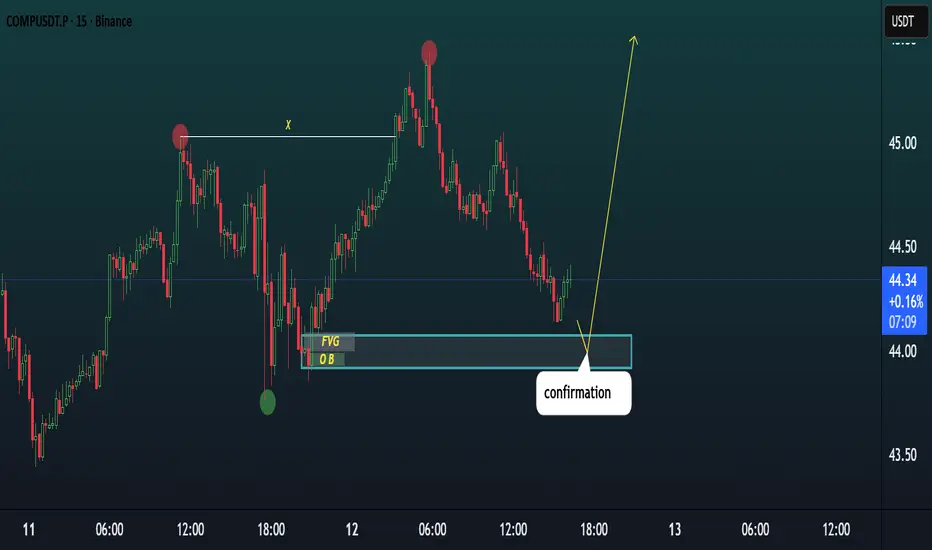
COMPUSDT TRADE IDEA.COMPUSDT (15m) Market Outlook
Price hasn’t reached the OB + FVG demand zone yet.
The marked POI around 43.9 – 44.1 is still untouched.
We’re waiting for price to drop into this zone and then form a bullish confirmation candle (engulfing / CHoCH) to validate the setup.
Until price reacts, the set
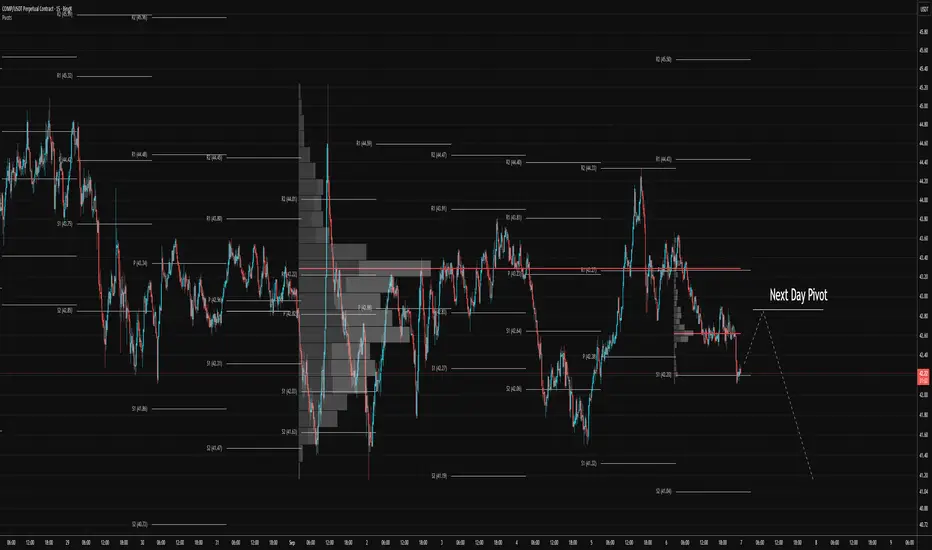
COMP: Pivot PlayExperimenting with stop orders on COMPUSDT and a few other altcoins.
Overnight, COMPUSDT might be attracted to the daily PIVOT for the next day and then fall again to continue the trend.
Elliot Wave charting in altcoins is almost pointless. Instead, I have to rely on simple tricks like pivot level
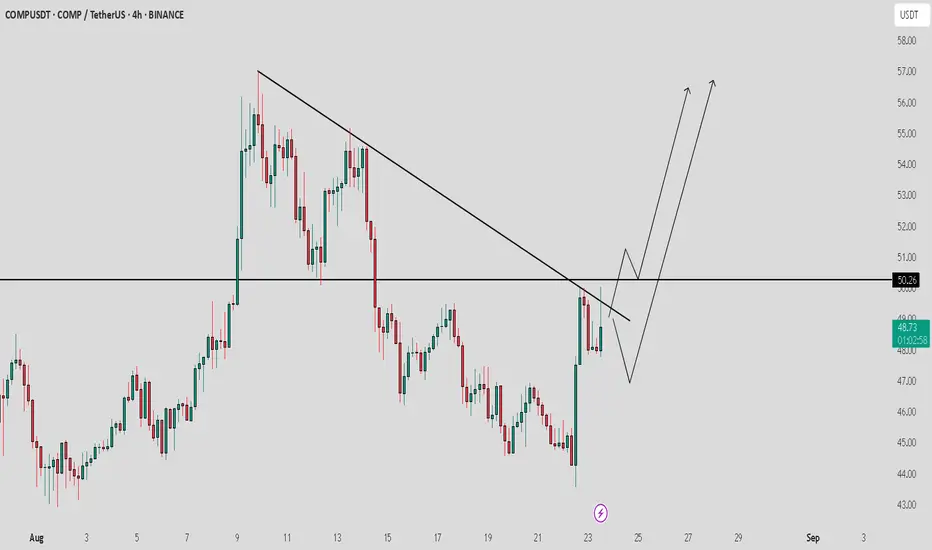
Comp / USDT : Looking bullishCOMP/USDT is approaching a key trendline resistance and looks ready for a breakout. A successful move above this level could trigger a strong rally toward $56–58 in the short term.
For the mid-term outlook, the next target zone stands around $80 if momentum continues.
Keep a close watch and trade
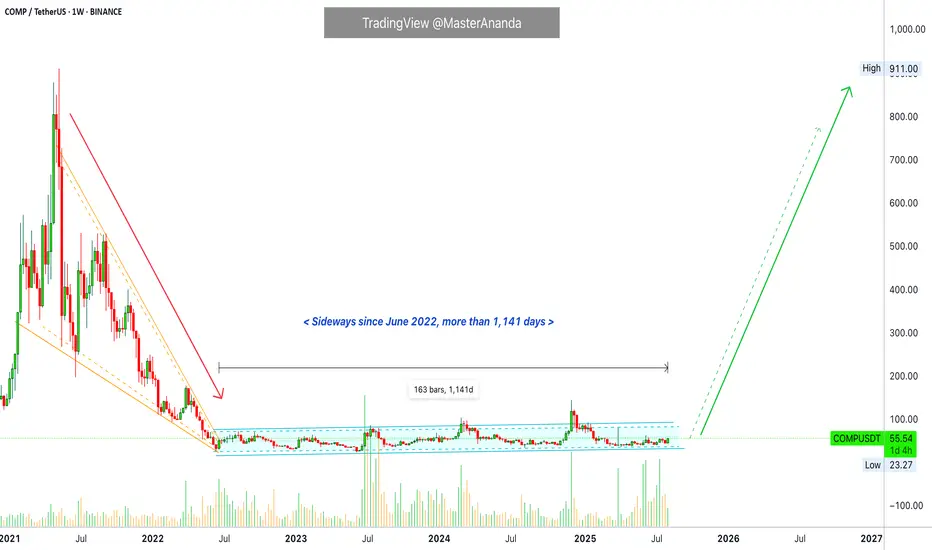
Compound 1,141 Days Long Consolidation EndsCompound is trading at true bottom prices. Compound has been sideways for 1,141 days, more than three years.
This is not a bear market. The market has been even rising slowly within the long-term accumulation and consolidation period.
Trading volume has been big on the buy-side for years. Major bu
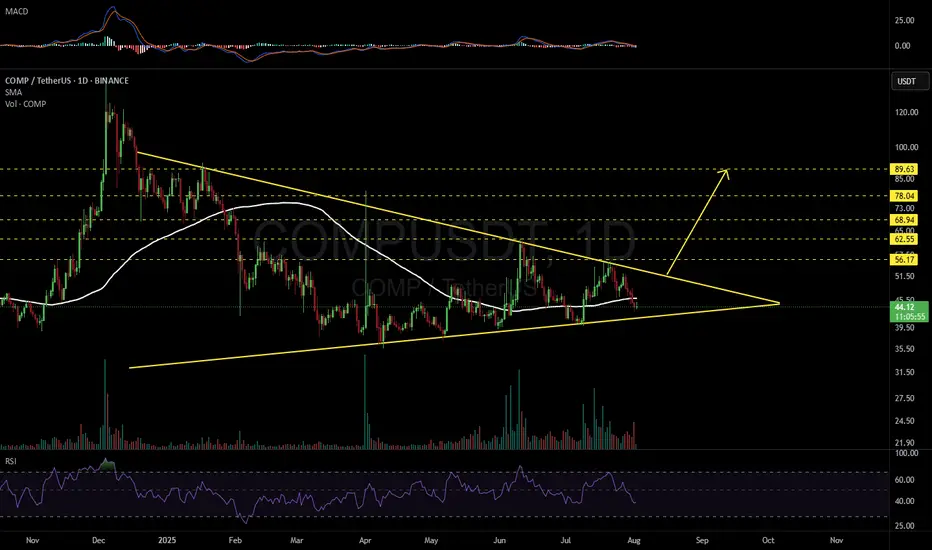
COMPUSDT 1DMany of you have been asking about #COMP.
It needs to hold the triangle’s support line and ideally reach above the daily SMA100 as soon as possible — only then can we expect a potential bullish move.
In any case, if a breakout occurs above the triangle resistance, the upside targets are:
🎯 $56.17
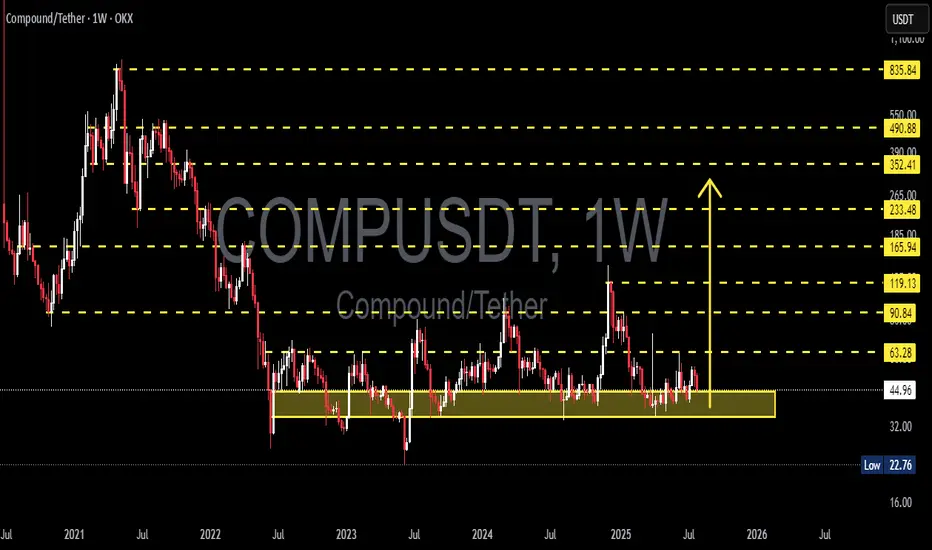
COMPUSDT in a Strong Demand Zone! Reversal Potential / Breakdown🔍 In-Depth Analysis (Timeframe: Weekly / 1W)
The COMP/USDT pair is currently hovering above a long-term demand zone that has held strong since mid-2022. Price is sitting around $44.90, just above the key support area of $32 – $45 (highlighted in yellow), which has acted as a major accumulation zone
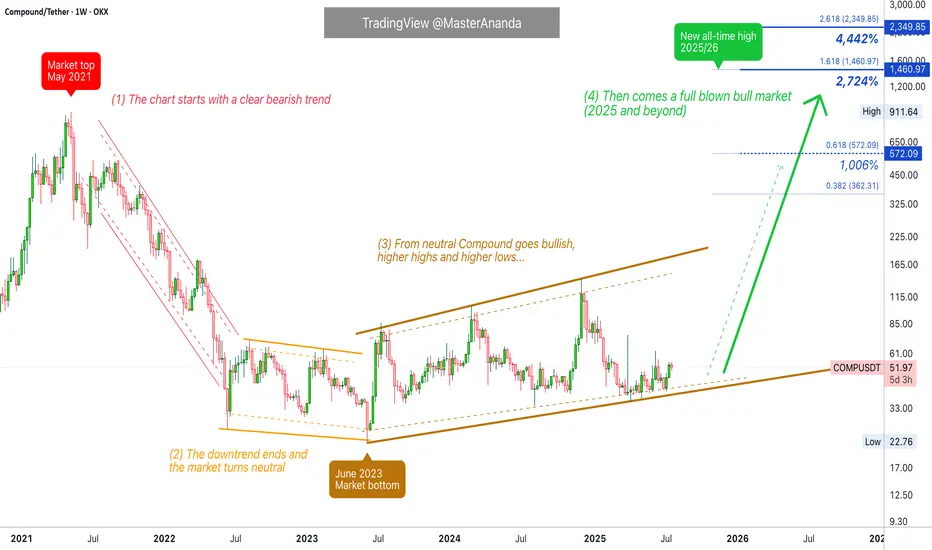
Compound Full Market Cycle · 1, 2, 3 & 4 (PP: 2,700% - 4,442%)This is the full long-term Compound (COMPUSDT) chart.
1) The market top happened May 2021. Notice how the bull market in 2021 ended early compared to 2025. While May signaled the start of a bear market, in 2025 we are already in July while trading at bottom prices.
High prices, a new all-time high
See all ideas
Summarizing what the indicators are suggesting.
Oscillators
Neutral
SellBuy
Strong sellStrong buy
Strong sellSellNeutralBuyStrong buy
Oscillators
Neutral
SellBuy
Strong sellStrong buy
Strong sellSellNeutralBuyStrong buy
Summary
Neutral
SellBuy
Strong sellStrong buy
Strong sellSellNeutralBuyStrong buy
Summary
Neutral
SellBuy
Strong sellStrong buy
Strong sellSellNeutralBuyStrong buy
Summary
Neutral
SellBuy
Strong sellStrong buy
Strong sellSellNeutralBuyStrong buy
Moving Averages
Neutral
SellBuy
Strong sellStrong buy
Strong sellSellNeutralBuyStrong buy
Moving Averages
Neutral
SellBuy
Strong sellStrong buy
Strong sellSellNeutralBuyStrong buy
Displays a symbol's price movements over previous years to identify recurring trends.