CopperXCUUSD
- Completed " 12345 " Impulsive Waves " A " Corrective Waves
- Break of Structure
- RSI - Divergence
- Fibonacci Level - 50.00% / 61.80%
- Demand Zone
About CFDs on Copper
Copper is an essential industrial metal used worldwide. Copper prices are followed in financial markets around the globe and the metal is growing in popularity. Copper is widely used in construction and because of its electrical properties is found in wires and circuit boards. Copper is mined in open mines around the world, with Chile and the United States leading in overall copper production. The demand for copper is increasing as countries such as China and India continue to develop, while the supply remains tight. The growing demand and constrained supply is likely to keep copper prices volatile in the near future. Copper prices are commonly quoted in USD.
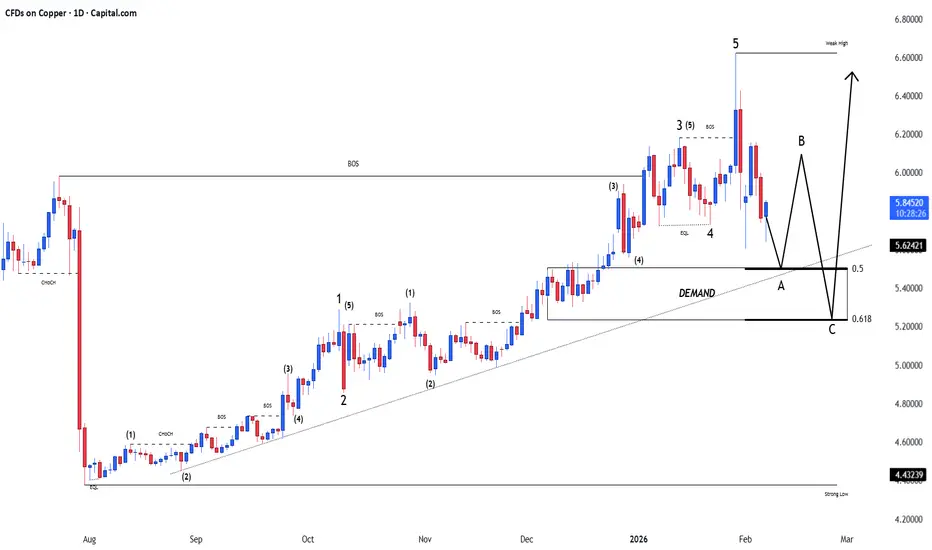
Copper: 5 Waves in BULLISH Completed now correction in 3 waves !DISCLAIMER : All labelling and wave counts done by me by manually and i will keep change according to the LIVE MARKET PRICE ACTION. So don't bias, hope on my trade plans...try to learn and make your own strategy...Following is not that much easy...I AM NOT RESPONSIBLE FOR ANY LOSSES IF U TOOK THE TR

Copper Long-Term Buy: Accumulate at $4.76 Order Block – LONG Signal – Copper (CFD / HG1!)
Long-Term Accumulation Setup Entry Zone: Around 4.76 – 4.80 (on reaction to major Order Block + downside liquidity sweep) Targets (Long-Term): Intermediate: 5.40 – 5.60
Primary: 6.00 – 6.40+ (previous highs & extension zone)
Stop Loss: Below 4.60 – 4.55 (below

Chart Pattern Analysis Of Copper.
K4 must close upon K0 to verify a valid break up of K1,
If not, the risk will sharply increase here.
I don’t think the market will finally break down K1 or the uptrend line.
If the market finally make it,
I will cut off all my long-term positions at copper.
At the same time,
The price along the

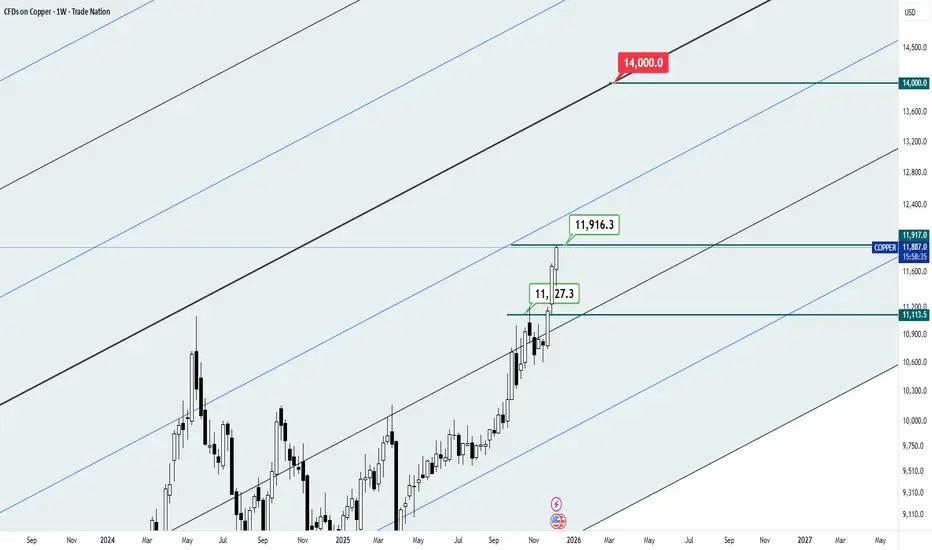
What is the rate of 14K displayed for?According to the past analysis that you can see in the link below and the speed of its realization:
What the chart on Friday morning can do is keep the copper market active awake. The predictable rates for this metal are colorful and to hedge the risk, you should keep an eye on the future rates
XCUUSD COPPERCopper is a chemical element with the symbol Cu and atomic number 29. It is a soft, malleable, ductile metal known for its high thermal and electrical conductivity
Key Properties
Copper serves as an excellent conductor in electrical wiring, plumbing, and alloys like bronze. Its corrosion resistance

Copper -- Bullish Perception - High Risk and Reward TradeCopper: Head and shoulder, right shoulder formation.
1. Right Shoulder in formation.
2. Head and shoulder formation at previous highs (all-time high).
3. Right shoulder trying to break n-1 highs and strong resistance - 6.174
Bullish scenario is price crosses value (Candle close) - 6.174
Entry pri

Copper likely bearishWe are seeing a RSI Divergence in the chart where this indicates a likely reversal trade which is likely to be short with a 10 % return

Copper Cycles Identify the Cycles.
Potentially last between 23-27 month before changing its behavior

Coppper to 15,00 this Februarythe fundamentals are strong, the need of copper is getting bigger and bigger, in the wiring industry, AI, EV`s and all that. Not just that but copper have shown great support not falling as much as near like silver and gold. Showing the strong support on the green line.
Im betting this will move fa

See all ideas
Displays a symbol's price movements over previous years to identify recurring trends.