Bitcoin No Math — Lover’s Pulse (BTC/WM1NS):the trend line fits like a vein, not a ruler. Bitcoin’s fractal feels like it breathes hugging the trend line like a lover.
Key data points
Previous close
—
Open
—
Day's range
—
About Market Cap BTC, $
Coin
On a stock market, a company's market cap can indicate how well it is doing — just like that, crypto market cap might be a good barometer for crypto investors. A growing market capitalization means investors are positive about a coin and are willing to invest — so if you're in two minds whether to buy Bitcoin or not, the chart of Bitcoin market cap might come in handy. It displays the total value of Bitcoin which is the number of coins in circulation multiplied by their price — analyzing this line can give you an idea of how Bitcoin is doing and where it's heading.

Bitcoin Location Road AtlasSimple Bitcoin is Mid-Cycle. Based on historical fractal behavior. BTC/WM1NS

Bitcoin’s Triple Cycle Overlap“Bitcoin’s Triple Cycle Overlap” reveals three distinct, self-reinforcing rhythms in Bitcoin’s price history:
• 4-year cycle (red) — tied to halvings, driving short-term bull/bear phases
• 8-year cycle (blue) — reflecting adoption waves and institutional entry
• 13-year cycle (green) — capturing

BTC/GOLDThe BTC/GOLD ratio just broke a multi-week descending trendline and pushed above a tight moving-average cluster, signalling trend transition from compression → expansion.
Momentum and breadth indicators have flipped bullish; this could be the onset of a 6–9 month relative outperformance cycle for B

$BTC Bottom soon? Expanded flat?CRYPTOCAP:BTC appears to printing wave Y of a running flat correction (or expanded flat)
The rules?
X pokes above all time high on a large 3-wave move and is often rejected even harder.
Y ends above W, if it goes below it is an expanded flat instead and likely ends just below W. Same outcome….

$BTC Double Top - Business Cycle & Global Liquidity Analysis TWIN PEAKS 🎄🌲
How the Business Cycle Supercharges Liquidity (and Crushes Cycles
Many of you may remember my BTC cycle thesis I wrote ~1.5 years ago. It was based solely on technical analysis covering previous cycles and did not take into account macro conditions such as global liquidity and the

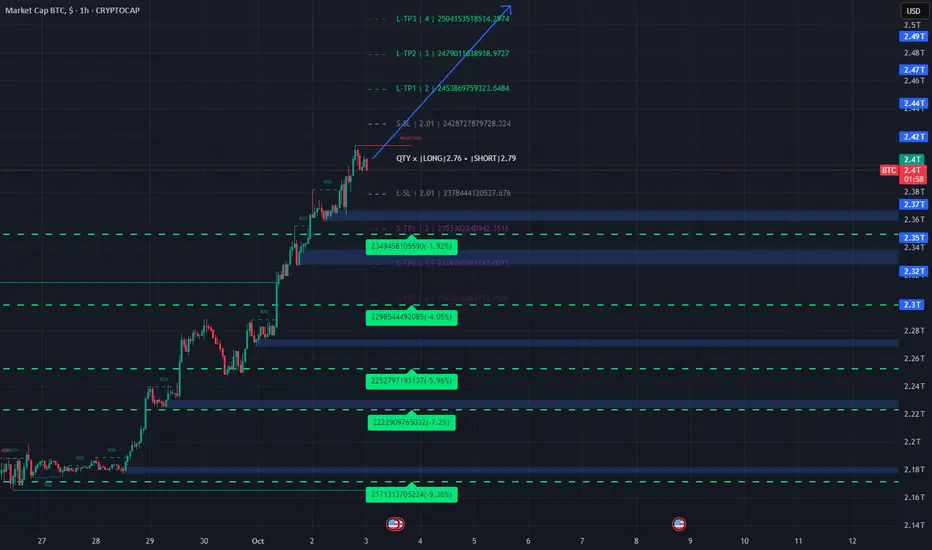
BTC Market Cap – Bearish Channel Reversal Setup (1H Analysis)Chart Context:
The chart shows BTC market cap moving within an ascending parallel channel, with price recently reaching the upper boundary resistance and starting to show signs of weakness.
📊 Key Levels
Entry Point: 2.46T
Stop Loss: 2.49T
Target (LABA TARGET POINT): 2.33T
Current Price: ~2.44T

Title: BTC/USD: Breakout Confirmed - Targeting $135K After SucceBitcoin has decisively broken and closed above the major resistance level of $120,000. Following a clean and successful retest of this level as new support, the structure confirms a strong bullish breakout.
The momentum is now building for the next leg up, with all signs pointing towards a challeng
BTC Dominance ForecastComparing the BTC.D to USDT.D
The BTC.D is currently bullish while the USDT.D is bearish.
From experience, both moves are 90% of the time opposite and from current analysis of BTC.D, the expected drop is perceived to be around $1.48 trillion down from the current level or at most $2.48 trillion leve

Gold -> BTCGold is heavy, slow, and infinite to mine — Bitcoin is light, instant, and forever capped at 21M.
Portability: You can send it globally in minutes; gold is heavy and slow to move.
Divisibility: Bitcoin can be split into tiny fractions; gold can’t easily.
Scarcity: Bitcoin has a fixed supp

See all ideas
Summarizing what the indicators are suggesting.
Oscillators
Neutral
SellBuy
Strong sellStrong buy
Strong sellSellNeutralBuyStrong buy
Oscillators
Neutral
SellBuy
Strong sellStrong buy
Strong sellSellNeutralBuyStrong buy
Summary
Neutral
SellBuy
Strong sellStrong buy
Strong sellSellNeutralBuyStrong buy
Summary
Neutral
SellBuy
Strong sellStrong buy
Strong sellSellNeutralBuyStrong buy
Summary
Neutral
SellBuy
Strong sellStrong buy
Strong sellSellNeutralBuyStrong buy
Moving Averages
Neutral
SellBuy
Strong sellStrong buy
Strong sellSellNeutralBuyStrong buy
Moving Averages
Neutral
SellBuy
Strong sellStrong buy
Strong sellSellNeutralBuyStrong buy
Displays a symbol's price movements over previous years to identify recurring trends.