Is total 3 about to fall?Drew this harmonic and it doesn't look great for TOTAL 3 as it stands just now
The 0,786 fib level has held previously a few times, let's see what happens this time. We are currently below the golden pocket.
NFA, please do your own TA......
Key data points
Previous close
—
Open
—
Day's range
—
About Crypto Total Market Cap Excluding BTC and ETH, $
Bitcoin and Ethereum are such major players and so popular among investors that when you enter the market, they draw all the attention to themselves leaving other coins in their shade. It's not that they do not deserve this attention, but without their colossal figures, investors could take a healthier look at the crypto market to define its overall state and direction. Following this logic, we've calculated total crypto market capitalization excluding BTC and ETH market caps and displayed how the final number changed over time on the chart. Hope it proves useful in your analysis of crypto markets.

CRYPTO TOTAL MARKET CAP EXCLUDING BTC and ETH OVERVIEWAs a crypto investor who holds 12 different altcoins and waiting for a massive bullrun on altcoins, I decided to share my overview on total market cap excluding BTC and ETH, here I highlighted three important levels on W- chart: 1.14T, 938.75B, 773.83B. These are three essential zones that everyone

Another one for the ALT sznJust throwing this here.
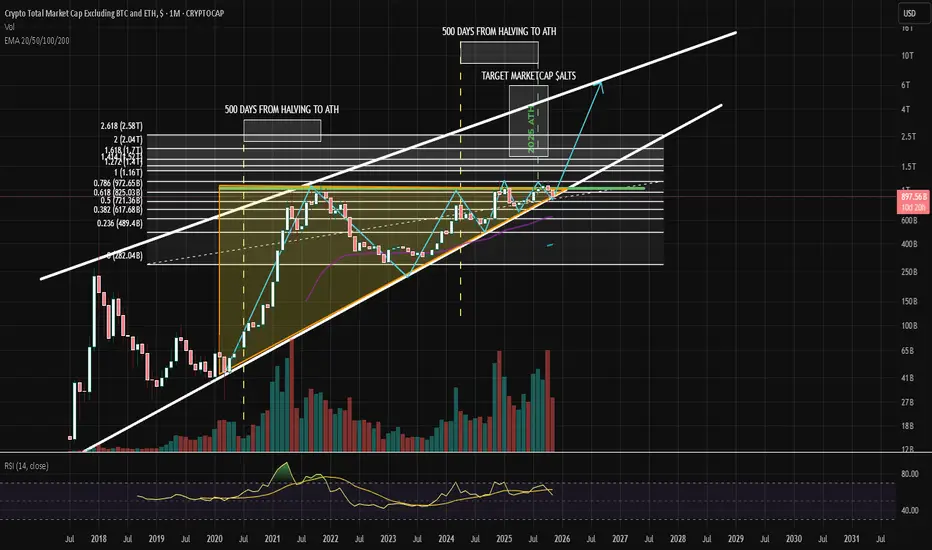
I still believe there is going to be a push to the upside .
What 2018 did to the masses when it went down , the 2026 will do it too ,but this time by going up only.

Potential Ascending Triangle - ALTCOINS Appears to be an ascending triangle forming on the weekly time frame. Is a breakout possible for Altcoins?
PURE TOTAL 3 ALTCOIN INDICATOR without stable coins, BTC and ETHCRYPTOCAP:TOTAL3-CRYPTOCAP:USDT-CRYPTOCAP:USDC-CRYPTOCAP:DAI
Original idea inspired by trader SpartaBTC — highly recommend checking out his page.

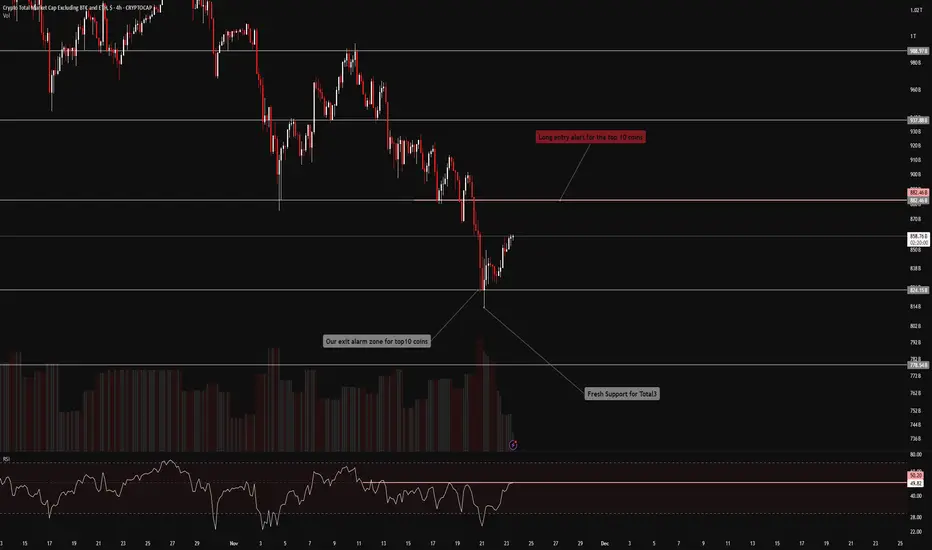
FireHoseReel | Total3: One Breakout Could Flip the Entire Market🔥 Welcome FireHoseReel !
Let’s break down what’s happening with TOTAL3 and see how the altcoin market is shaping up right now.
⭐ TOTAL3 Market Structure Update
The altcoin market (TOTAL3) has formed a solid support base around $824B after the recent pullback and is now pushing upward toward its

TOTAL 3 New Update (1D)It appears that wave G of Total 3 has completed, and the price has entered wave H. Wave H is expected to end within the green zone, after which we’ll move toward wave I.
For now, our outlook on Total 3 remains bearish, as the strong move a few days ago and the market crash indicate the formation of


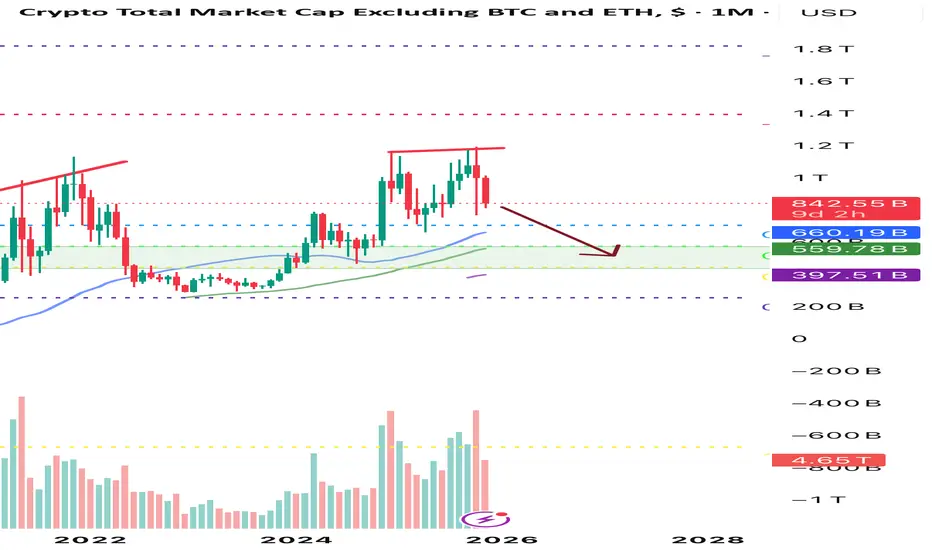
Macro Divergence Signals Building a Major CorrectionThe chart is showing a clear structural mismatch between price action and momentum—something that rarely appears on the monthly timeframe unless the market is entering a distribution → correction cycle.
1) Bearish Divergence Across Two Key Momentum Indicators
• Price made a Higher High, but
• RSI p
See all ideas
Summarizing what the indicators are suggesting.
Oscillators
Neutral
SellBuy
Strong sellStrong buy
Strong sellSellNeutralBuyStrong buy
Oscillators
Neutral
SellBuy
Strong sellStrong buy
Strong sellSellNeutralBuyStrong buy
Summary
Neutral
SellBuy
Strong sellStrong buy
Strong sellSellNeutralBuyStrong buy
Summary
Neutral
SellBuy
Strong sellStrong buy
Strong sellSellNeutralBuyStrong buy
Summary
Neutral
SellBuy
Strong sellStrong buy
Strong sellSellNeutralBuyStrong buy
Moving Averages
Neutral
SellBuy
Strong sellStrong buy
Strong sellSellNeutralBuyStrong buy
Moving Averages
Neutral
SellBuy
Strong sellStrong buy
Strong sellSellNeutralBuyStrong buy
Displays a symbol's price movements over previous years to identify recurring trends.