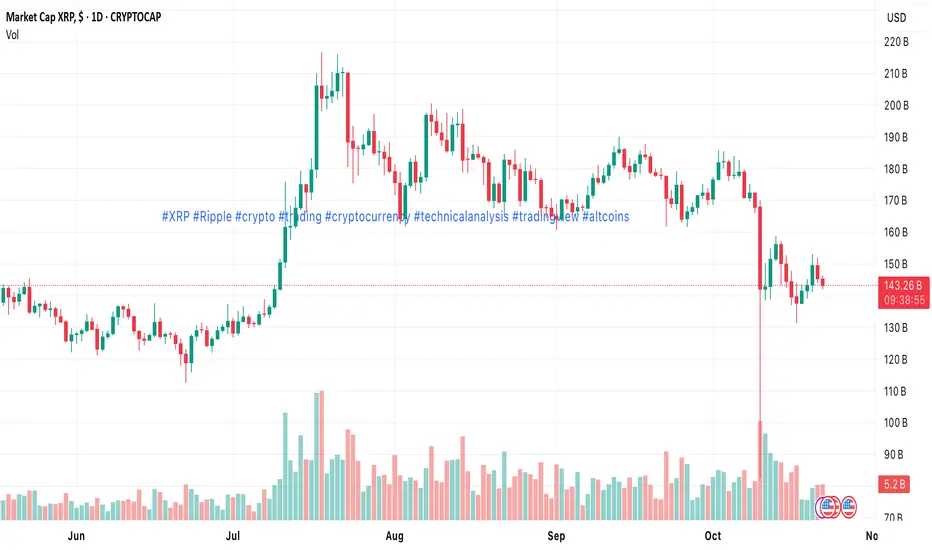
XRP–Potentially the Final Low-Risk Entry Before the Next Leg Up**XRP – Potentially the Final Low-Risk Entry Before the Next Leg Up**
After the brutal 2025 bear market that took XRP from $3.84 (217B MC peak) all the way down to ~$0.38, price has been quietly consolidating and is now showing multiple confluence signals that we may be at the end of the correction
Key data points
Previous close
—
Open
—
Day's range
—
About Market Cap XRP, $
Coin
A pioneer in the crypto market, XRP was originally created to be "the most practical cryptocurrency for applications across the financial services space". Judging by its market cap on the chart we've prepared for you, Ripple's path to success is a bumpy one — while it was once one of the most valuable cryptocurrencies, it couldn't avoid dips into the red. Depending on your life outlook, this chart can tell you two things: XRP, just like any other coin, is volatile, and its total market value can suddenly squeeze, so you should be prepared to take risks. On the other hand, Ripple has had its highlights and may have even more in the future — to predict them is up to you and your trading skills.

XRP Risks Dropping Below $2 as Sentiment Hits “Anxiety” – AnalysA bearish technical chart pattern formation could begin to take effect, triggering a drop in XRP price below $2. Amid the extreme fear sentiment in the crypto market, long-term holders and whales have shifted to the anxiety phase, according to an analyst.
Key Indicator Signals Dip in Long-Term Hold

Despite Market Fatigue, LeanHash Delivers Consistent ReturnsAs XRP prices continue to decline and the overall sentiment in the crypto market sinks, many investors are experiencing the double blow of asset shrinkage and shaken confidence. However, amidst this gloom, LeanHash offers XRP holders an alternative path to stable growth. LeanHash’s returns do not de

Roxtengraphs 2025: Crypto, Forex & Stocks — All on One PlatformNovember 2025 has been a real stress test for millions of traders and investors.
In just two weeks Bitcoin dropped from $109,200 to $96,400, Ethereum lost 22 %, Solana 31 %, and tech stocks (Nvidia, Tesla, Apple) fell 14–28 %. At the same time gold broke above $3,250, the DXY rolled back below 105.8

XRP/USD: Price Rejected at Mid-Range, Bearish Trend ExtendsXRP/USD continues to trade inside a medium-term descending channel. Last week, the pair resumed its decline in line with the broader crypto market. Price is now holding below the midline of the Bollinger Bands, signaling sustained bearish pressure.
XRP is currently testing 2.1484 (Murray ). A brea

XRP/USD — Consolidation Ahead of Ripple ETF Launch (Weekly TradiThe XRP/USD pair is consolidating after last week’s volatility. Following the bipartisan agreement to fund the U.S. government through January 2026, ending the country’s longest-ever shutdown, XRP briefly tested 2.5391 (Murray ), but failed to extend losses and rebounded to its prior range.
In the

XRP/USD — Bearish Momentum Persists Near Channel Lows (Weekly OuXRP/USD continues to trade within a medium-term descending channel, maintaining a strong bearish structure. This week, the pair resumed its decline and is now approaching the lower boundary of the channel. A confirmed breakout below 1.9531 (Murray level ) would likely accelerate losses toward 1.562

XRP/USD — Market on Edge Ahead of Fed Decision and U.S.–China TaXRP/USD remains steady near 2.64, as traders adopt a wait-and-see stance ahead of two major fundamental catalysts: the Federal Reserve’s rate decision at 20:00 (GMT+2) and tomorrow’s meeting between U.S. President Donald Trump and China’s President Xi Jinping at the APEC summit.
According to CME’s

XRP/USD — Bears in Control as Price Tests Key SupportXRP/USD continues to move within a descending channel, confirming a sustained bearish structure. Earlier in the month, the pair attempted to break out above 3.1250 (Murray ), but the move failed, triggering a renewed selloff as U.S.–China trade tensions escalated and risk appetite faded.
Currently
XRP/USD — Sharp Sell-Off Breaks Range; Risk of Further DeclineLast week, XRP/USD broke below its medium-term sideways range of 3.1250–2.7344 (Murray – ), plunging by roughly 43% on Saturday and hitting a multi-month low near 1.4060. The drop came amid heightened geopolitical tensions, as U.S. President Donald Trump vowed to impose 100% tariffs on all Chinese

See all ideas
Summarizing what the indicators are suggesting.
Oscillators
Neutral
SellBuy
Strong sellStrong buy
Strong sellSellNeutralBuyStrong buy
Oscillators
Neutral
SellBuy
Strong sellStrong buy
Strong sellSellNeutralBuyStrong buy
Summary
Neutral
SellBuy
Strong sellStrong buy
Strong sellSellNeutralBuyStrong buy
Summary
Neutral
SellBuy
Strong sellStrong buy
Strong sellSellNeutralBuyStrong buy
Summary
Neutral
SellBuy
Strong sellStrong buy
Strong sellSellNeutralBuyStrong buy
Moving Averages
Neutral
SellBuy
Strong sellStrong buy
Strong sellSellNeutralBuyStrong buy
Moving Averages
Neutral
SellBuy
Strong sellStrong buy
Strong sellSellNeutralBuyStrong buy
Displays a symbol's price movements over previous years to identify recurring trends.