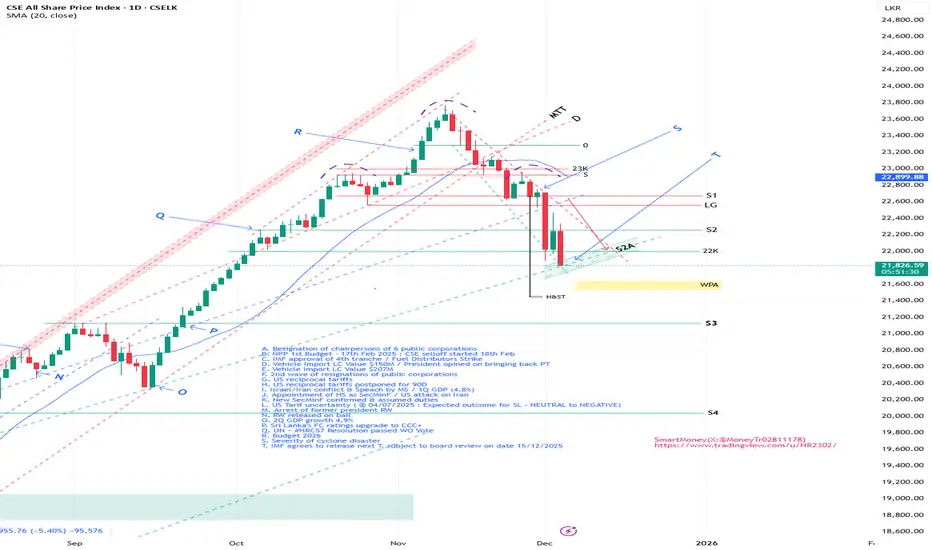
ASI : CSE - Will a reversal develop?Previous Update
We held a bearish bias in our last update, and the market played out as expected. On 28th Nov, the ASI tried to stage a reversal but ended up in a deeper pullback as sentiment turned more negative. The tragic cyclone fallout weighed heavily, and investor confidence in the gover
CSE All Share Price Index
No trades
Related indices
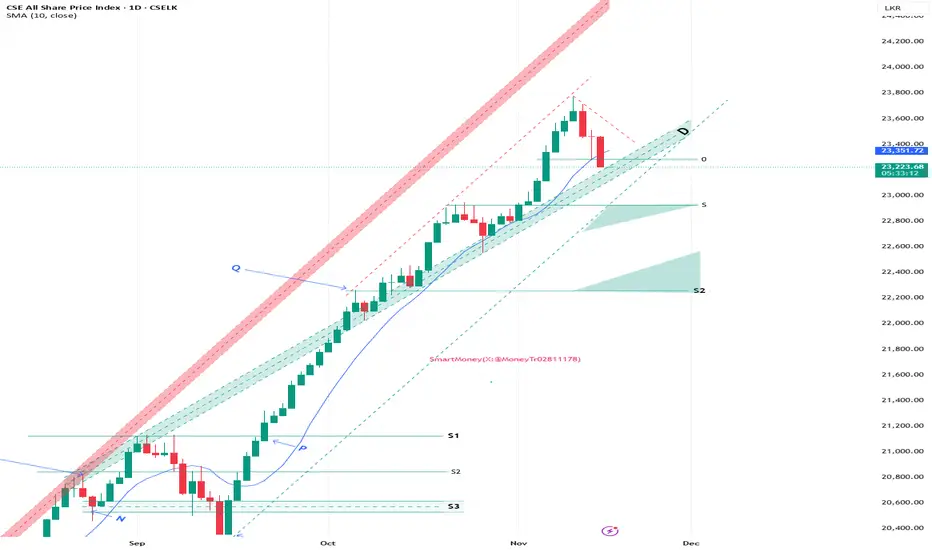
ASI : CSE - At a Decision PointPrevious Update
We are approaching 'D', the decision line again.
Expectations
1. Positive Continuation
While the ASI remains above 'D', upward trend to continue.
2. Pullback Risk
A breakdown below 'D' could trigger a pullback toward the Green Triangle
zones. S & S2.
My assessment is
CSE All Share Price Index 📈 CSE All Share Price Index (ASPI) – Technical + Fundamental Outlook
🔹 Trend Overview
The index is moving inside a strong ascending channel.
Multiple successful retests of channel support show consistent buying interest.
As long as price stays inside the channel, the trend remains bullish.

ASI : CSEBullish trend to Continue.
Recent upgrade of Sri Lanka’s foreign currency (FC) credit rating from default to CCC+ with a stable outlook will fuel the CSE uptrend further pushing index towards 26600 - 22000 area.
Ratings upgrade is very much positive for large cap blue chips & banking counters.

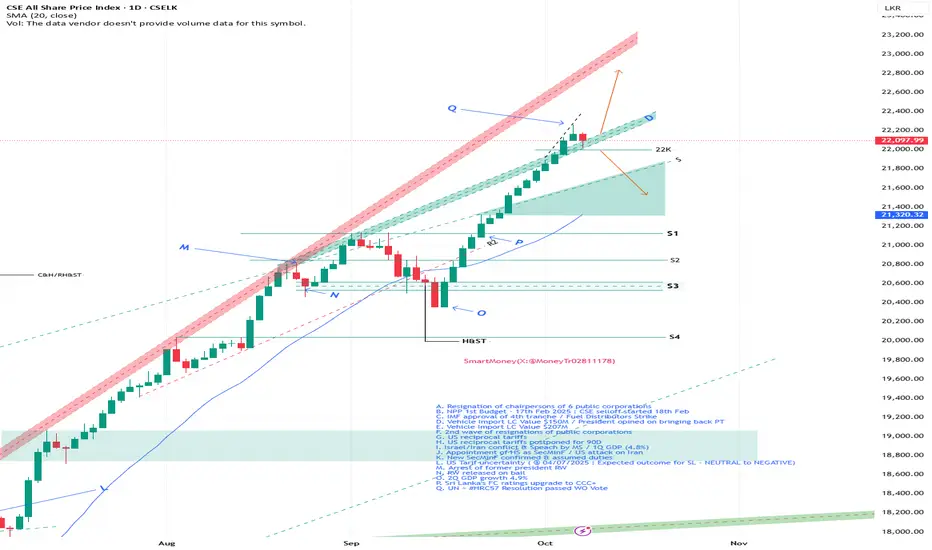
ASI : CSE - At a Decision PointPrevious Update
The market reached the target outlined in our previous update and decisively broke through the resistance line previously marked in amber—now reclassified as green 'D'.
Since 09/10, the market experienced a pullback, with selling pressure continuing through the morning session
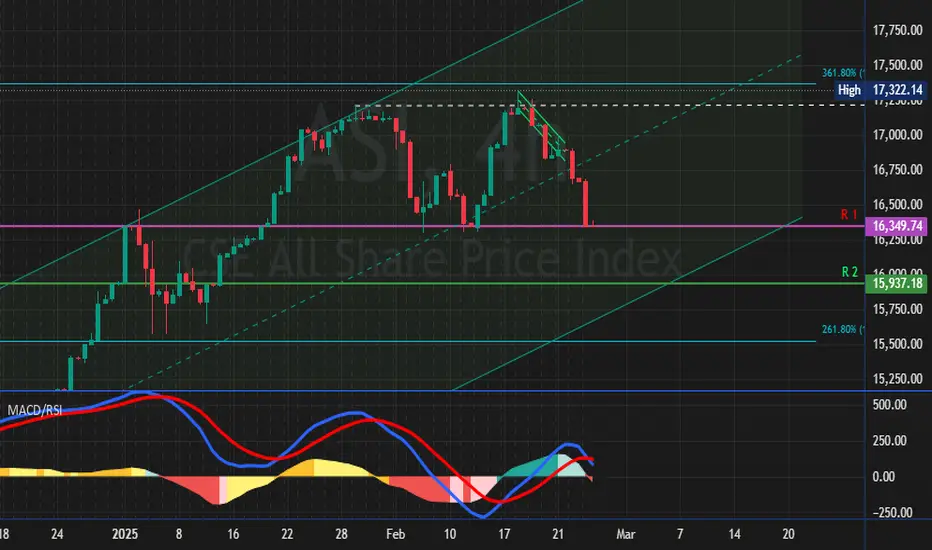
CSE ASI BEARISH SETUPThe monthly chart of the CSE All Share Price Index (ASI) reveals a technically significant scenario: the index is currently testing the upper boundary of a long-term ascending channel while also aligning with the 1.618 Fibonacci extension, both of which signal potential reversal pressure ahead.
Key

ASPI CSEDisclaimer;
The information provided on this website does not constitute investment advice, financial advice, trading advice, or any other advice, and you should not treat any of the website’s content as such. We do not recommend buying, selling, or holding any stock. Nothing on this website should

ASIDisclaimer
The information provided on this website does not constitute investment advice, financial advice, trading advice, or any other advice, and you should not treat any of the website’s content as such. We do not recommend buying, selling, or holding any stock. Nothing on this website should

ASPI CSEDisclaimer;
The information provided on this website does not constitute investment advice, financial advice, trading advice, or any other advice, and you should not treat any of the website’s content as such. We do not recommend buying, selling, or holding any stock. Nothing on this website should
Weekly ASI Performance AnalysisWeekly Close
Market had a weekly close above level 3, the last horizontal resistance before testing all time high again.
Incidentally market reached the target of the pattern, of which breakout happened on April 24th, 2025.
What Next:
We continue to remain bullish on the ASI/CSE and believ

See all ideas
Summarizing what the indicators are suggesting.
Oscillators
Neutral
SellBuy
Strong sellStrong buy
Strong sellSellNeutralBuyStrong buy
Oscillators
Neutral
SellBuy
Strong sellStrong buy
Strong sellSellNeutralBuyStrong buy
Summary
Neutral
SellBuy
Strong sellStrong buy
Strong sellSellNeutralBuyStrong buy
Summary
Neutral
SellBuy
Strong sellStrong buy
Strong sellSellNeutralBuyStrong buy
Summary
Neutral
SellBuy
Strong sellStrong buy
Strong sellSellNeutralBuyStrong buy
Moving Averages
Neutral
SellBuy
Strong sellStrong buy
Strong sellSellNeutralBuyStrong buy
Moving Averages
Neutral
SellBuy
Strong sellStrong buy
Strong sellSellNeutralBuyStrong buy
Displays a symbol's value movements over previous years to identify recurring trends.